. 2019 Dec 2;129(12):5357-5373.
doi: 10.1172/JCI125212.

HLA-B27-mediated activation of TNAP phosphatase promotes pathogenic syndesmophyte formation in ankylosing spondylitis

Affiliations

HLA-B27-mediated activation of TNAP phosphatase promotes pathogenic syndesmophyte formation in ankylosing spondylitis

Chin-Hsiu Liu et al. J Clin Invest. .

Abstract

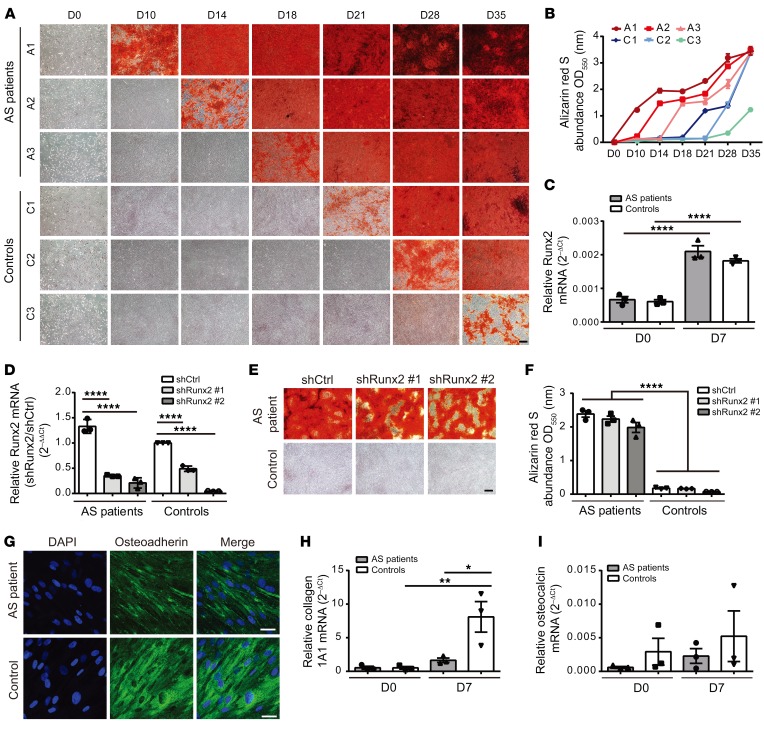
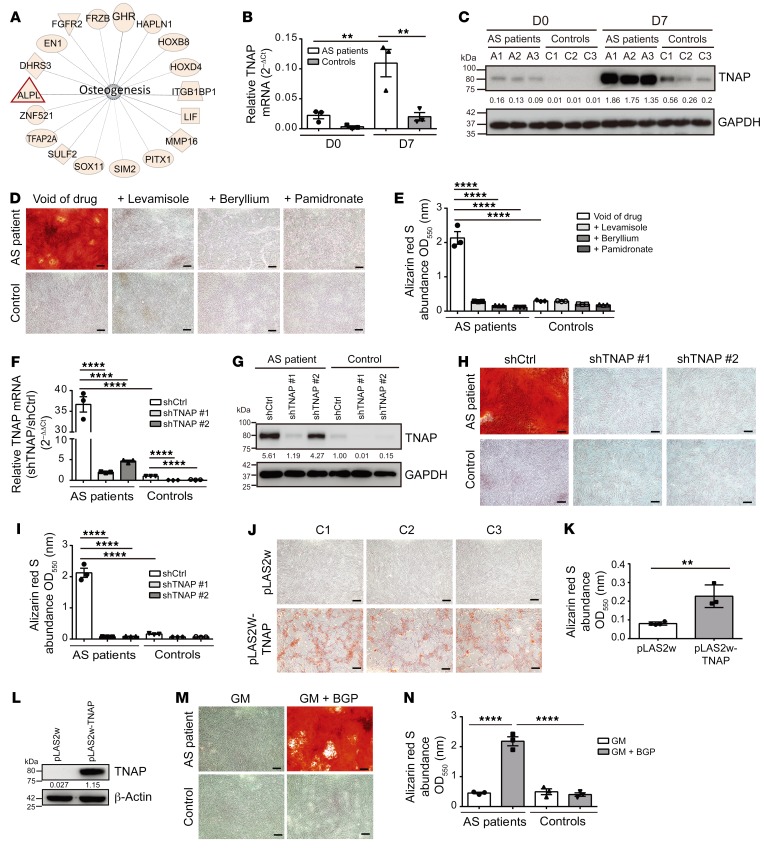
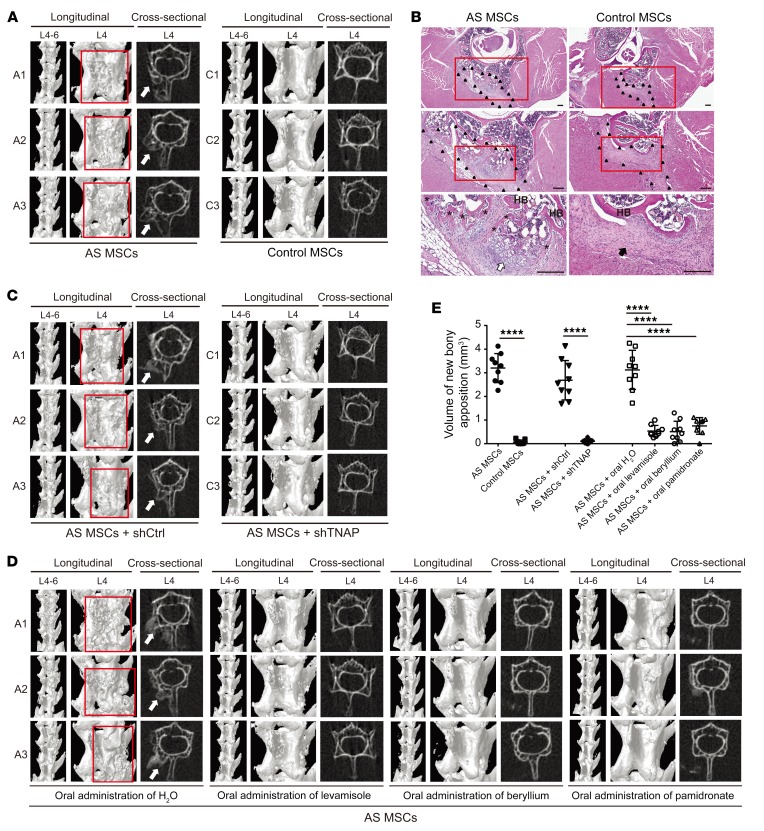
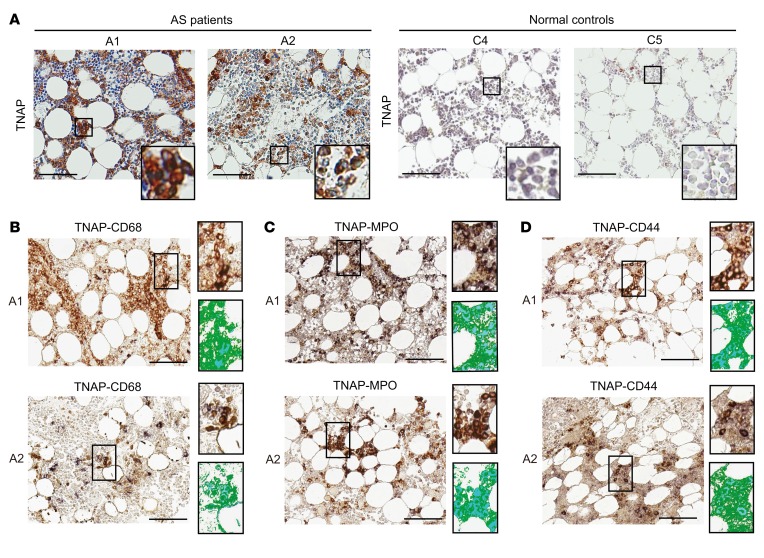
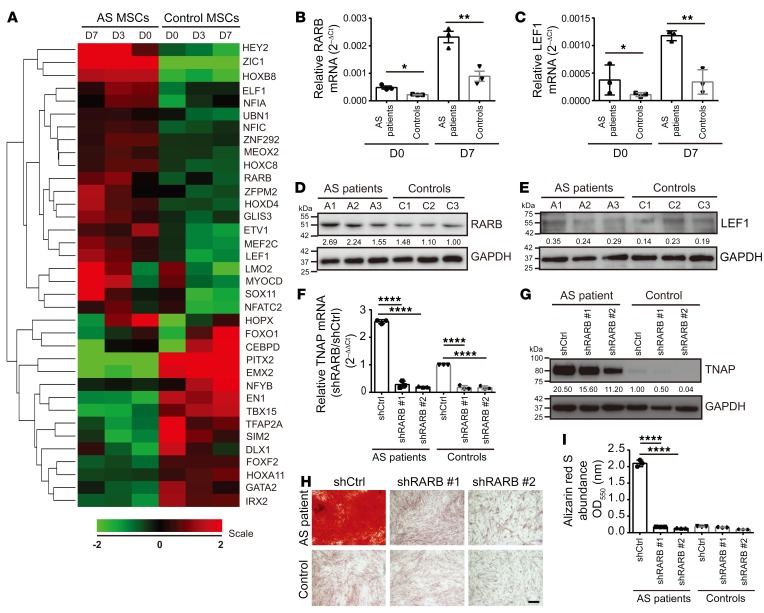
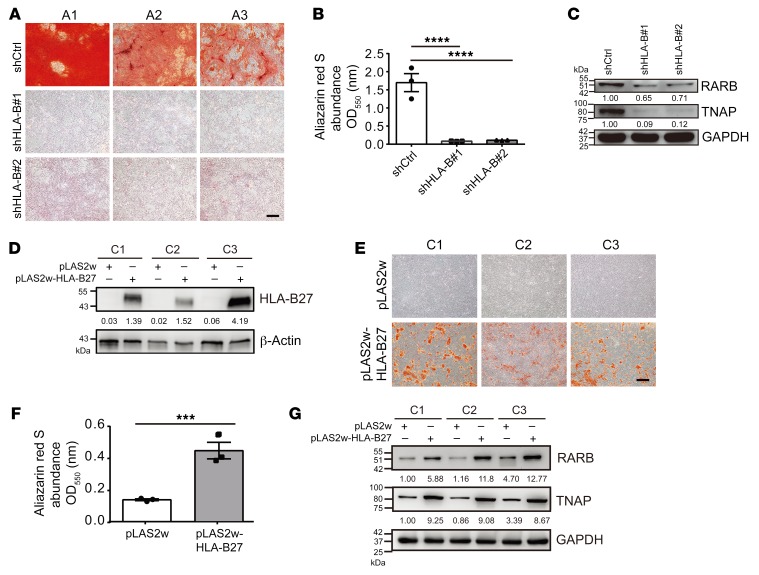
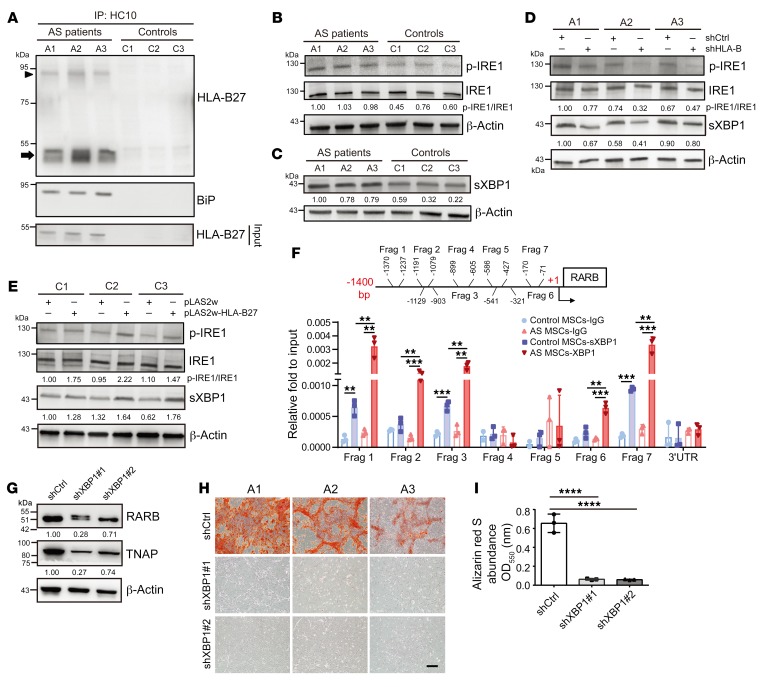
Ankylosing spondylitis (AS) is a type of axial inflammation. Over time, some patients develop spinal ankylosis and permanent disability; however, current treatment strategies cannot arrest syndesmophyte formation completely. Here, we used mesenchymal stem cells (MSCs) from AS patients (AS MSCs) within the enthesis involved in spinal ankylosis to delineate that the HLA-B27-mediated spliced X-box-binding protein 1 (sXBP1)/retinoic acid receptor-β (RARB)/tissue-nonspecific alkaline phosphatase (TNAP) axis accelerated the mineralization of AS MSCs, which was independent of Runt-related transcription factor 2 (Runx2). An animal model mimicking AS pathological bony appositions was established by implantation of AS MSCs into the lumbar spine of NOD-SCID mice. We found that TNAP inhibitors, including levamisole and pamidronate, inhibited AS MSC mineralization in vitro and blocked bony appositions in vivo. Furthermore, we demonstrated that the serum bone-specific TNAP (BAP) level was a potential prognostic biomarker to predict AS patients with a high risk for radiographic progression. Our study highlights the importance of the HLA-B27-mediated activation of the sXBP1/RARB/TNAP axis in AS syndesmophyte pathogenesis and provides a new strategy for the diagnosis and prevention of radiographic progression of AS.

Keywords: Autoimmunity; Bone Biology; Bone disease; Rheumatology.


Conflict of interest statement

Conflict of interest: The authors have declared that no conflict of interest exists.

Figures

Figure 1
Figure 1. Runx2-independent accelerated mineralization in AS MSCs.
(A) ARS staining of enhanced mineralization in AS MSCs cultured under osteogenic conditions at the indicated days compared with control MSCs. (B) Quantification of ARS staining showing the differential rate in mineralization between AS MSCs and control MSCs at the indicated days. (C) RT-qPCR of Runx2 mRNA levels in AS MSCs and control MSCs at days 0 and 7 under osteogenic induction. (DF) MSCs were transduced with lentiviral vectors carrying 2 independent shRNAs against Runx2 (shRunx2) or control shRNA (shCtrl) under osteogenic conditions. (D) RT-qPCR showing the knockdown efficiency by shRunx2 in AS MSCs and control MSCs at day 7 under osteogenic induction, normalized to the value of control MSCs expressing shCtrl. (E) ARS staining showing the effects of Runx2 knockdown on the mineralization of AS MSCs and control MSCs with quantification (F) at day 18 under osteogenic induction. (G) Immunofluorescence staining of AS MSCs and control MSCs at day 14 under osteogenic induction with DAPI (blue) and osteoadherin-specific antibody (green). (H and I) RT-qPCR of collagen 1A1 (H) and osteocalcin (I) mRNA levels in AS MSCs and control MSCs at days 0 and 7 under osteogenic induction. All experiments were done in the AS patient group using AS MSCs (derived from A1, A2, and A3 with experimental triplicates) and in the control group using control MSCs (derived from C1, C2, and C3 with experimental triplicates). Data are shown as the mean ± SEM. *P < 0.05; **P < 0.01; ****P < 0.0001 by 1-way ANOVA, followed by Tukey’s honestly significant difference (HSD) test. Representative images from AS (A1) MSCs and control (C3) MSCs are shown in E and G. Scale bars: 200 μm (A and E); 20 μm (G).
Figure 2
Figure 2. Enhanced expression of TNAP is essential for abnormal mineralization in AS MSCs.
(A) IPA of differentially expressed genes involved in osteogenesis between AS MSCs and control MSCs. (B and C) TNAP mRNA (B) and protein levels (C) in AS and control MSCs at the indicated days after osteogenic induction. (D) ARS staining of AS MSCs or control MSCs treated with TNAP inhibitors (100 μM levamisole, 100 μM beryllium sulfate, or 1 μg/mL pamidronate) under osteogenic induction with quantification (E). (F and G) TNAP mRNA (F) and protein levels (G) were suppressed by 2 shRNAs against TNAP in AS MSCs at day 7 under osteogenic induction. (H) ARS staining of AS MSCs expressing shTNAP or shCtrl under osteogenic induction with quantification (I). (J) ARS staining of control MSCs transduced with a control vector (pLAS2w) or vector overexpressing TNAP (pLAS2w-TNAP) with quantification (K). (L) Immunoblot shows TNAP protein expression in control MSCs transduced with pLAS2w or pLAS2w-TNAP. (M) ARS staining of AS MSCs and control MSCs cultured in GM with or without BGP at day 18 with quantification (N). All statistical data in the AS patient group and control group are from AS MSCs (A1, A2, and A3) and control MSCs (C1, C2, and C3), respectively, with 3 experimental repeats. Data are the mean ± SEM. **P < 0.01; ****P < 0.0001 by 2-tailed Student’s t test (2 groups) or 1-way ANOVA, followed by Tukey’s HSD test. Representative images from AS (A1) MSCs and control (C3) MSCs are shown in D, H, and M. Scale bars: 200 μm (D, H, J, and M).
Figure 3
Figure 3. TNAP blockade inhibits new bony appositions induced by AS MSCs in NOD-SCID mice.
(A, C, and D) Representative images of lumbar spine micro-CT of NOD-SCID mice implanted with AS MSCs (derived from A1, A2, and A3 with triplicates in each group) or control MSCs (derived from C1, C2, and C3 with triplicates in each group) in the artificial cortical defect of the right lamina of lumbar spine segment L4–5 (A); with AS MSCs (derived from A1, A2, and A3 with triplicates in each group) transduced with shCtrl or shTNAP (C); or with AS MSCs (derived from A1, A2, and A3 with triplicates in each group) plus daily oral administration of H2O (n = 9), levamisole (10 mg/kg) (n = 9), beryllium sulfate (7.5 mg/kg) (n = 9), or pamidronate (0.3 mg/kg) (n = 9) (D). Images were taken 3 weeks after implantation. Longitudinal view over L4–6 (left), longitudinal view at high magnification over L4 (middle), and cross-sectional view over L4 (right) are shown. New bony appositions are highlighted by a red rectangle (middle) and white arrow (right). (B) Representative H&E staining images showing MSC-implanted sites (arrowhead-dotted areas) in the spinal tissues. AS MSCs (A1) formed new woven bone apposition (asterisks) bridging with host bone (HB), with some osteochondral-like tissues surrounding the newly formed bone (white arrow), while control MSCs (C3) formed fibrous-like tissues (black arrow) in direct contact with host bone. Higher-magnification views of areas in red rectangles in upper panels are shown in lower panels (scale bars: 200 μm). (E) The quantitative volumes of new bony appositions (mm3) between groups (A, C, and D). Data are the mean ± SEM (n = 9 in E). ****P < 0.0001 by 2-tailed Student’s t test (2 groups) or 1-way ANOVA, followed by Tukey’s HSD test.
Figure 4
Figure 4. TNAP in the BM from AS patients is enhanced significantly in comparison with controls.
(A) IHC staining of the BM from AS patients (A1 and A2) and normal controls (C4 and C5) with a TNAP-specific antibody. Inset represents high magnification of the boxed area. (BD) Double IHC staining of BM sections from AS patients (A1 and A2) with TNAP antibody (in brown) and the indicated second primary antibodies (in blue). The colocalizations of TNAP/CD68 (monocyte lineage) (B), TNAP/myeloperoxidase (MPO) (myeloid lineage) (C), and TNAP/CD44 (MSC) (D) were visualized as dark purple. Inset represents high magnification of the boxed area; top image is the microscopic image, and bottom image is the composite pseudocolored image by spectral unmixing technique with a spectral library (staining with TNAP antibody in brown and secondary antibody in blue). The colocalizations of TNAP/CD68, TNAP/MPO, and TNAP/CD44 are presented as turquoise. Scale bars: 100 μm (AD).
Figure 5
Figure 5. RARB is an upstream regulator that promotes TNAP expression in AS MSCs.
(A) Differential gene expression of transcription factors between AS MSCs and control MSCs under osteogenic induction at the indicated days. (BE) Expression of transcription factors RARB and LEF1 in AS and control MSCs measured by RT-qPCR (B and C) and immunoblotting (D and E). (F and G) RT-qPCR (F) and immunoblot analyses (G) showing reduced TNAP expression in AS or control MSCs transduced with 2 shRNAs against RARB at day 7 under osteogenic induction compared with the effects of shCtrl. (H) ARS staining of mineralization in AS or control MSCs expressing shRARB or shCtrl under osteogenic induction with quantification (I). All experiments were done in the AS patient group using AS MSCs (derived from A1, A2, and A3 with experimental triplicates) and/or in the control group using control MSCs (derived from C1, C2, and C3 with experimental triplicates). Data are the mean ± SEM. *P < 0.05; **P < 0.01; ****P < 0.0001 by 1-way ANOVA, followed by Tukey’s HSD test. Representative immunoblots from AS (A1) MSCs and control (C3) MSCs are shown in G and H. Scale bar: 200 μm (H).
Figure 6
Figure 6. HLA-B27 mediates the upregulation of the RARB/TNAP axis in AS MSCs.
(A) ARS staining of mineralization in AS MSCs transduced with shHLA-B or shCtrl under osteogenic induction with quantification (B). (C) Immunoblot analyses showing the expression of RARB and TNAP in AS MSCs expressing shHLA-B or shCtrl at day 7 under osteogenic induction. (D) Immunoblot showing HLA-B27 expressions of control MSCs transduced with pLAS2w or pLAS2w-HLA-B27. (E) ARS staining of control MSCs transduced with control lentiviral vector (pLAS2w) or a vector expressing HLA-B27 (pLAS2w-HLA-B27) with quantification (F). (G) Immunoblot analyses showing RARB and TNAP expressions in control MSCs transduced with pLAS2w or pLAS2w-HLA-B27. All experiments done in the AS patient group and the control group are from AS MSCs (A1, A2, and A3) and control MSCs (C1, C2, and C3), respectively, with at least 2–3 experimental repeats. Data are the mean ± SEM. ***P < 0.001; ****P < 0.0001 by 2-tailed Student’s t test (2 groups) or 1-way ANOVA, followed by Tukey’s HSD test. Representative images from AS (A1) MSCs are shown in C. Scale bars: 200 μm (A and E).
Figure 7
Figure 7. The HLA-B27–mediated activation of the p-IRE1/sXBP1 pathway promotes the upregulation of the RARB/TNAP axis in AS MSCs.
(A) Unfolded or misfolded HCs were immunoprecipitated (IP) from lysates of AS MSCs and control MSCs with HC10 antibody, followed by immunoblotting with HLA-B27 and anti-BiP antibodies. In AS MSCs, monomers of HLA-B27 HCs and dimers of disulfide-linked HLA-B27 HCs are indicated by an arrow and an arrowhead, respectively. (B and C) Immunoblot showing the expressions of p-IRE1 (B) and sXBP1 (C) protein in AS and control MSCs at day 7 under osteogenic induction. (D) Immunoblot showing the expressions of p-IRE1 and sXBP1 in AS MSCs transduced with shHLA-B or shCtrl. (E) Immunoblot showing the expressions of p-IRE1 and sXBP1 protein in control MSCs transduced with pLAS2w-HLA-B27 or pLAS2w. (F) ChIP assay showing sXBP1 binding at fragments (Frags) 1, 2, 3, 6, and 7 within 1400 bp upstream of the RARB transcriptional start site in AS MSCs. RARB 3′-untranslated region (3′UTR) was used as the negative control locus. (G) Immunoblot showing the expressions of RARB and TNAP in AS MSCs expressing shXBP1 or shCtrl. (H) ARS staining of mineralization in AS MSCs transduced with shXBP1 or shCtrl under osteogenic induction with quantification (I). All experiments done in the AS patient group and control group are from AS MSCs (A1, A2, and A3) and control MSCs (C1, C2, and C3), respectively, with at least 2–3 experimental repeats. Data are the mean ± SEM. **P < 0.05; ***P < 0.001; ****P < 0.0001 by 2-tailed Student’s t test (2 groups) or ****P < 0.0001 by 1-way ANOVA, followed by Tukey’s HSD test. Representative immunoblots from AS (A1) MSCs are shown in G.

Comment in

References

    1. Dougados M, Baeten D. Spondyloarthritis. Lancet. 2011;377(9783):2127–2137. doi: 10.1016/S0140-6736(11)60071-8. - DOI - PubMed
    1. Tam LS, Gu J, Yu D. Pathogenesis of ankylosing spondylitis. Nat Rev Rheumatol. 2010;6(7):399–405. doi: 10.1038/nrrheum.2010.79. - DOI - PubMed
    1. Benjamin M, Toumi H, Suzuki D, Hayashi K, McGonagle D. Evidence for a distinctive pattern of bone formation in enthesophytes. Ann Rheum Dis. 2009;68(6):1003–1010. doi: 10.1136/ard.2008.091074. - DOI - PubMed
    1. Wanders A, et al. Nonsteroidal antiinflammatory drugs reduce radiographic progression in patients with ankylosing spondylitis: a randomized clinical trial. Arthritis Rheum. 2005;52(6):1756–1765. doi: 10.1002/art.21054. - DOI - PubMed
    1. Poddubnyy D, et al. Effect of non-steroidal anti-inflammatory drugs on radiographic spinal progression in patients with axial spondyloarthritis: results from the German Spondyloarthritis Inception Cohort. Ann Rheum Dis. 2012;71(10):1616–1622. doi: 10.1136/annrheumdis-2011-201252. - DOI - PubMed

Publication types

MeSH terms