. 2019 Dec;33(12):14680-14689.
doi: 10.1096/fj.201901792R. Epub 2019 Nov 2.

Complexes formed with integrin-α5 and KCNB1 potassium channel wild type or epilepsy-susceptibility variants modulate cellular plasticity via Ras and Akt signaling

Affiliations

Complexes formed with integrin-α5 and KCNB1 potassium channel wild type or epilepsy-susceptibility variants modulate cellular plasticity via Ras and Akt signaling

Wei Yu et al. FASEB J. 2019 Dec.

Abstract

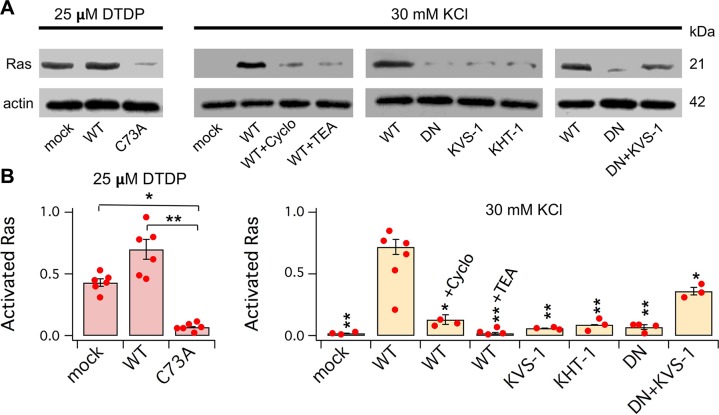
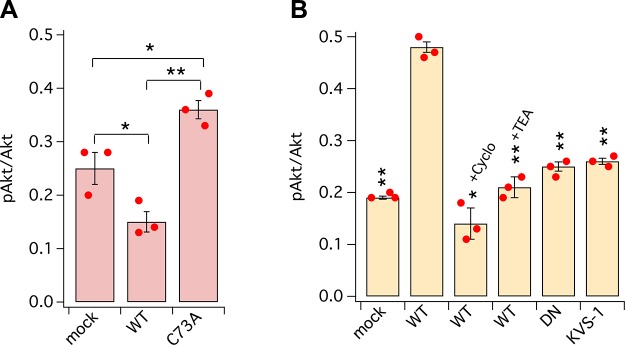
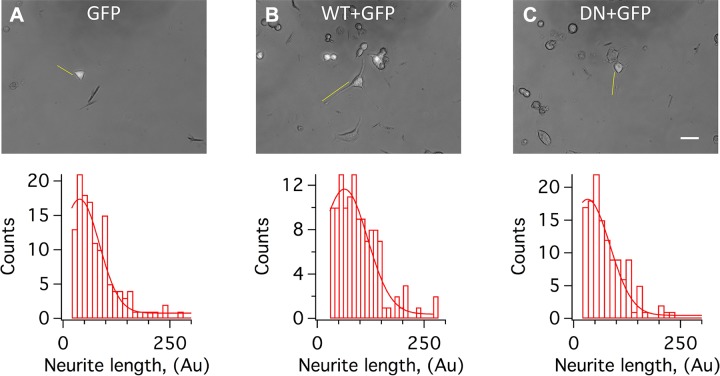
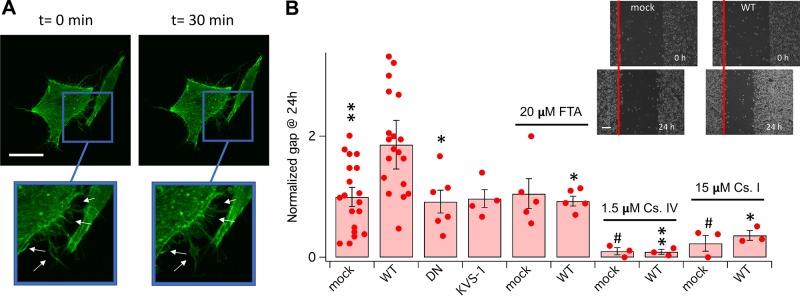
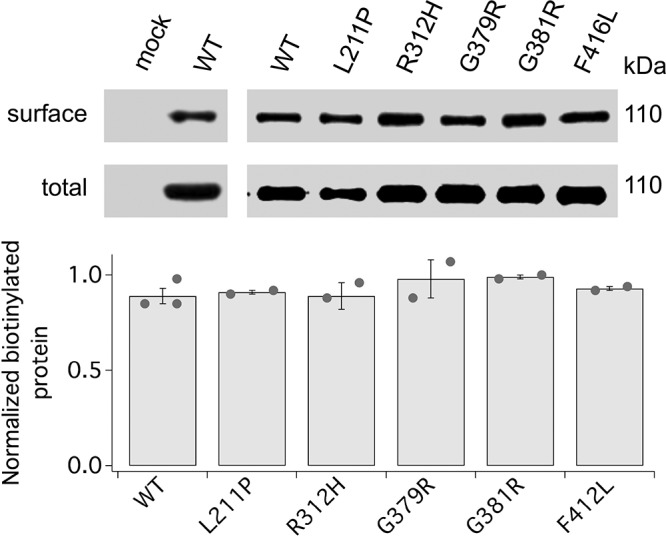
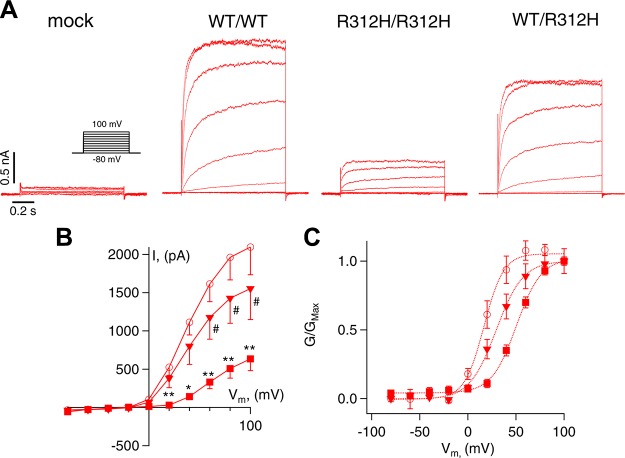
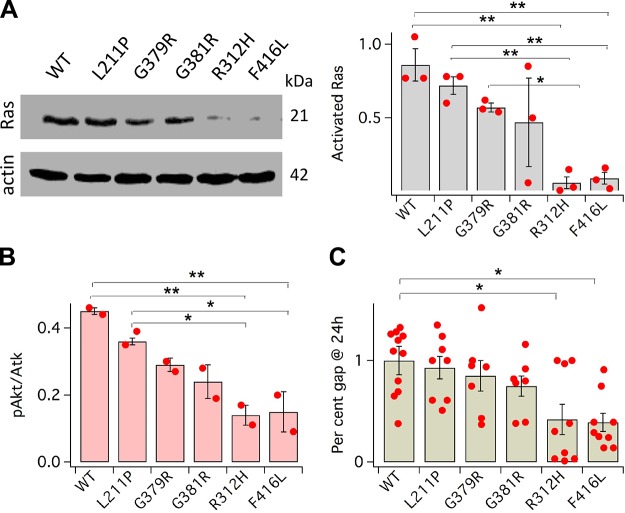
Voltage-gated potassium (K+) channel subfamily B member 1 (KCNB1, Kv2.1) and integrin-α5 form macromolecular complexes-named integrin-α5-KCNB1 complexes (IKCs)-in the human brain, but their function was poorly understood. Here we report that membrane depolarization triggered IKC intracellular signals mediated by small GTPases of the Ras subfamily and protein kinase B (Akt) to advance the development of filopodia and lamellipodia in Chinese hamster ovary cells, stimulate their motility, and enhance neurite outgrowth in mouse neuroblastoma Neuro2a cells. Five KCNB1 mutants (L211P, R312H G379R, G381R, and F416L) linked to severe infancy or early-onset epileptic encephalopathy exhibited markedly defective conduction. However, although L211P, G379R, and G381R normally engaged Ras/Akt and stimulated cell migration, R312H and F416L failed to activate Ras/Akt signaling and did not enhance cell migration. Taken together, these data suggest that IKCs modulate cellular plasticity via Ras and Akt signaling. As such, defective IKCs may cause epilepsy through mechanisms other than dysregulated excitability such as, for example, abnormal neuronal development and resulting synaptic connectivity.-Yu, W., Shin, M. R., Sesti, F. Complexes formed with integrin-α5 and KCNB1 potassium channel wild type or epilepsy-susceptibility variants modulate cellular plasticity via Ras and Akt signaling.


Conflict of interest statement

The authors thank Drs. Mladen-Roko Rasin and Huaye Zhang (Robert Wood Johnson Medical School, Rutgers University) for help with the confocal microscope and Drs. Kiram Madura and Li Chen (Robert Wood Johnson Medical School, Rutgers University) for help with the plate reader. The Lifeact-GFP construct was provided by the Addgene repository. This work was supported by National Science Foundation (NSF) Grant 1456675 and U.S. National Institutes of Health (NIH) Grants R01AG060919 (National Institute on Aging) and R21NS0966 (National Institute of Neurological Disorders and Stroke) to F.S. The authors declare no conflicts of interest.

Figures

Figure 1
Figure 1
IKCs activate Ras GTPases. A) Representative Western blots of activated (GTP-bound) Ras GTPases and for control, actin, from CHO cells transfected with the indicated cDNAs and incubated in DMEM + 25 μM 2,2′-dithiodipyridine for 5 min or 30 mM KCl for 15 min, prior to lysis. Cyclo(-RGDfK) (200 nM) and TEA (15 mM) were added 10 min prior to KCl and maintained until lysis. B) Densitometric quantification of the of amounts of activated Ras protein normalized to actin in response to an oxidative challenge. N = 6 biologic experiments (dots). C) Densitometric quantification of activated Ras protein normalized to actin in response to KCl-induced depolarization. For each bar, N ≥ 3 biologic experiments (dots). Densitometry analysis was performed using ImageJ 1.52a software. *P < 0.05, **P < 0.01. Pair-wise comparisons are referred to WT.
Figure 2
Figure 2
IKCs promote Akt phosphorylation at Ser473. A) ELISA quantification of pAkt normalized to total Akt in CHO cells incubated in DMEM + 25 μM 2,2’-dithiodipyridine for 5 min prior to lysis. B) As in A, for cells incubated in DMEM + 30 mM KCl for 15 min prior to lysis. Cyclo(-RGDfK) (200 nM) and TEA (15 mM) were added 10 min prior to KCl and maintained until lysis. N = 3 biologic experiments (dots) each with 2 technical replicates/experiment. *P < 0.05, **P < 0.01. Pair-wise comparisons are referred to WT (B).
Figure 3
Figure 3
IKCs stimulate neurite outgrowth in N2A cells. Representative images of N2A cells transfected with GFP alone (A), WT+GFP (1:5) (B), and DN+GFP (1:5) (C) and distributions of neurite length in arbitrary units (Au). Examples of how neurites were measured are shown in yellow color. Histograms were calculated and fitted to a gaussian distribution (Eq. 1) with medians, μ = 38.7, 63.3 and 32.5 Au and sd, σ = 65.2, 76.6 and 73.8 Au, respectively, using Igor software. Images were analyzed with ImageJ 1.52a. Scale bar, 50 μm. N = 3 biologic experiments. Number of samples = 108, 105, and 103 for GFP, WT+GFP, and DN+GFP, respectively.
Figure 4
Figure 4
IKCs enhance cell motility. A) Representative confocal images of CHO cells transfected with WT and Lifeact-GFP incubated in DMEM+30 mM KCl starting at t = 0 min. Representative changes in lamellipodia and filopodia structures are indicated by arrows in the insets. Scale bar, 10 μm. B) Mean distance covered in 24 h are expressed as percents of the original distance (gap, Eq. 2) in CHO cells transfected with the indicated cDNAs. Ras inhibitor FTA (20 μM), Akt inhibitor class IV (1.5 μM), and Arp2/3 complex inhibitor class I (15 μM) were applied at the time of the scratch. Inset representative pictures of gap distance in mock and WT transfected cells at 0 and 24 h. Scale bar, 100 μm. Images were analyzed with ImageJ 1.52a. For each bar, N ≥ 3 biologic experiments (dots) with 2 technical replicates/experiment. *P < 0.05, **P < 0.01 for statistical significance (pair-wise) compared to WT, #P < 0.05 for statistical significance compared to mock.
Figure 5
Figure 5
Surface expression of EOEE-susceptibility variants. Representative Western blots of surface and total expression of mock, WT, and EOEE-susceptibility KCNB1 variants and densitometric quantification of N = 2–3 experiments (dots). Normalization to total CHO cells were incubated with a membrane impermeant biotin analog before lysis. Western blot visualization was performed with anti-KCNB1 mAb.
Figure 6
Figure 6
R312H channels exhibit altered gating. A) Representative whole-cell currents in CHO cells transfected with mock, WT (WT/WT), R312H (R312H/R312H), or a 1:1 mixture of WT and R312H (WT/R312H) cDNAs. Inset: voltage protocol. B) Current-voltage relationships for WT/WT (circles), R312H/R312H (squares), and WT/R312H (triangles). C) Normalized macroscopic steady-state conductance-V relationships (G/GMax, Eq. 3) for WT/WT (circles), R312H/R312H (squares), and WT/R312H (triangles). Data are fitted to the Boltzmann function (Eq. 4) with V1/2 = 16.8 mV and Vs = 10.2 mV for WT/WT; V1/2 = 50.5 mV and Vs = 12.9 mV for R312H/R312H and V1/2 = 29.5 mV and Vs = 13.9 mV for WT/R312H. N = 9 cells for each group. *P < 0.05, **P < 0.01, for pair-wise comparisons between WT/WT and R312H/R312H; #P < 0.05 for pair-wise comparisons between WT/WT and WT/R312H.
Figure 7
Figure 7
EOEE-susceptibility variants affect Ras/Akt signaling and cell motility. A) Representative Western blot of activated Ras protein and for control, actin, and mean fractions of activated Ras protein (normalized to actin) in CHO cells transfected with WT or the indicated EOEE-susceptibility KCNB1 variants. Cells were incubated in DMEM + 30 mM KCl for 15 min prior to lysis. N = 3 biologic experiments (dots). B) ELISA quantification of pAkt normalized to total Akt. N = 2 biologic experiments (dots) with 2 technical replicates/experiment. C) Mean gap distances (Eq. 2) in CHO cells transfected with WT or the indicated KCNB1 variants. For each bar, N ≥ 5 biologic experiments (dots) with 2 technical replicates/experiment. Images were analyzed with ImageJ 1.52a. *P < 0.05, **P < 0.01.

References

    1. Kaczmarek L. K. (2006) Non-conducting functions of voltage-gated ion channels. Nat. Rev. Neurosci. 7, 761–771 - PubMed
    1. Becchetti A., Pillozzi S., Morini R., Nesti E., Arcangeli A. (2010) New insights into the regulation of ion channels by integrins. Int. Rev. Cell Mol. Biol. 279, 135–190 - PubMed
    1. Wei Y., Shin M. R., Sesti F. (2018) Oxidation of KCNB1 channels in the human brain and in mouse model of Alzheimer’s disease. Cell Death Dis. 9, 820 - PMC - PubMed
    1. Yu W., Gowda M., Sharad Y., Singh S. A., Sesti F. (2017) Oxidation of KCNB1 potassium channels triggers apoptotic integrin signaling in the brain. Cell Death Dis. 8, e2737 - PMC - PubMed
    1. Cotella D., Hernandez-Enriquez B., Wu X., Li R., Pan Z., Leveille J., Link C. D., Oddo S., Sesti F. (2012) Toxic role of K+ channel oxidation in mammalian brain. J. Neurosci. 32, 4133–4144 - PMC - PubMed

Publication types