

Intratumoral Cytotoxic T-Lymphocyte Density and PD-L1 Expression Are Prognostic Biomarkers for Patients with Colorectal Cancer
- PMID: 31683723
- PMCID: PMC6915478
- DOI: 10.3390/medicina55110723
Intratumoral Cytotoxic T-Lymphocyte Density and PD-L1 Expression Are Prognostic Biomarkers for Patients with Colorectal Cancer
Abstract
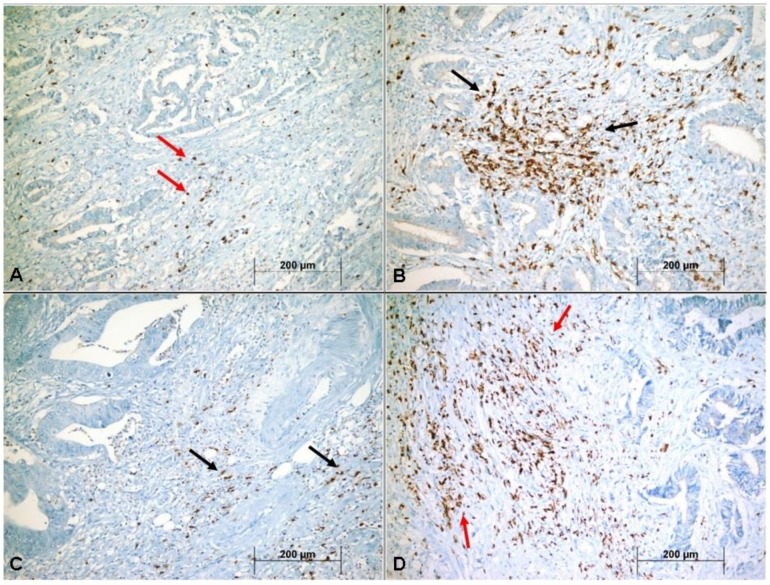
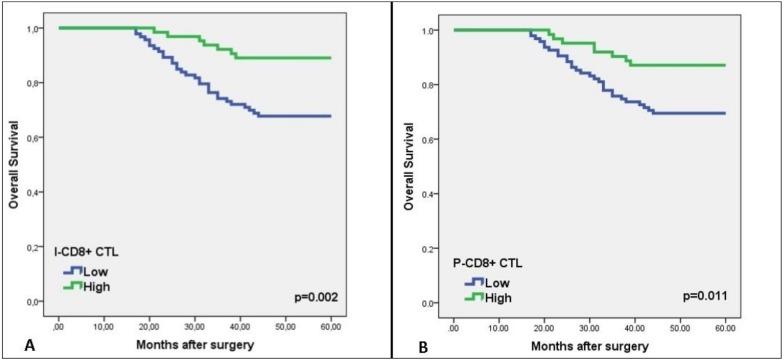
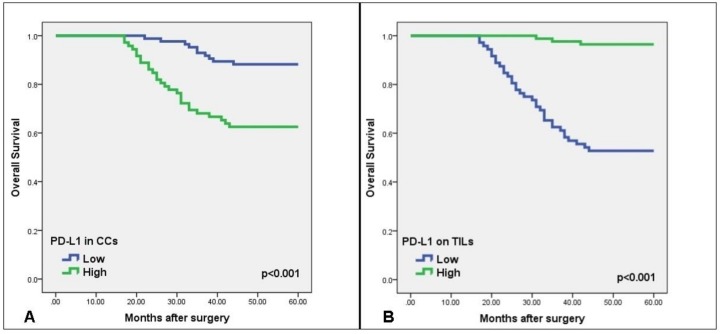
Background and objectives: Cytotoxic T-lymphocyte (CTL)-mediated inflammatory response to tumors plays a crucial role in preventing the progression of some cancers. Programmed cell death ligand 1 (PD-L1), a cell-surface glycoprotein, has been reported to repress T-cell-mediated immune responses against tumors. However, the clinical significance of PD-L1 in colorectal cancer (CRC) remains unclear. Our aim was to elucidate the prognostic significance of PD-L1 expression and CD8+ CTL density in CRC. Materials and methods: CD8 and PD-L1 immunostaining was conducted on 157 pathologic specimens from patients with CRC. The CD8+ CTL density and PD-L1 expression within the tumor microenvironment were assessed by immunohistochemistry. Results: Tumor invasion (pT) was significantly correlated with intratumoral (p = 0.011) and peritumoral (p = 0.016) CD8+ CTLs density in the tumor microenvironment. In addition, there was a significant difference in the intensity of CD8+ CTLs between patients with and without distant metastases (intratumoral p = 0.007; peritumoral p = 0.037, T-test). Lymph node metastasis (pN) and TNM stage were significantly correlated with PD-L1 expression in CRC cells (p = 0.015, p = 0.029, respectively). Multivariate analysis revealed a statistically significant relationship between the intratumoral CD8+ CTL density and disease-free survival (DFS) (hazard ratio [HR] 2.06; 95% confidence interval [CI]: 1.01-4.23; p = 0.043). The DFS was considerably shorter in patients with a high expression of PD-L1 in cancer cells than those with a low expression (univariate HR 2.55; 95% CI 1.50-4.34; p = 0.001; multivariate HR 0.48; 95% CI 0.28-0.82; p = 0.007). Conversely, patients with high PD-L1 expression in tumor-infiltrating lymphocytes had a longer DFS in both univariate analysis (HR 0.25; 95% CI: 0.14-0.44; p < 0.001) and multivariate analysis (HR 3.42; 95% CI: 1.95-6.01; p < 0.001). Conclusion: The CD8+ CTL density and PD-L1 expression are prognostic biomarkers for the survival of patients with CRC.
Keywords: PD-L1 expression; colorectal cancer; cytotoxic T lymphocytes; prognosis; tumor microenvironment.
Conflict of interest statement
The authors declare no conflicts of interest.
Figures

References
-
- Dylag-Trojanowska K., Rogala J., Pach R., Siedlar M., Baran J., Sierzega M., Zybaczynska J., Lenart M., Rutkowska-Zapala M., Szczepanik A.M. T Regulatory CD4+CD25+FoxP3+ Lymphocytes in the Peripheral Blood of Left-Sided Colorectal Cancer Patients. Medicina. 2019;55:307. doi: 10.3390/medicina55060307. - DOI - PMC - PubMed
MeSH terms
Substances
LinkOut - more resources
Full Text Sources
Medical
Research Materials
