. 2019 Nov 4;20(1):805.
doi: 10.1186/s12864-019-6192-1.

Cox regression increases power to detect genotype-phenotype associations in genomic studies using the electronic health record

Affiliations

Cox regression increases power to detect genotype-phenotype associations in genomic studies using the electronic health record

Jacob J Hughey et al. BMC Genomics. .

Abstract

Background: The growth of DNA biobanks linked to data from electronic health records (EHRs) has enabled the discovery of numerous associations between genomic variants and clinical phenotypes. Nonetheless, although clinical data are generally longitudinal, standard approaches for detecting genotype-phenotype associations in such linked data, notably logistic regression, do not naturally account for variation in the period of follow-up or the time at which an event occurs. Here we explored the advantages of quantifying associations using Cox proportional hazards regression, which can account for the age at which a patient first visited the healthcare system (left truncation) and the age at which a patient either last visited the healthcare system or acquired a particular phenotype (right censoring).

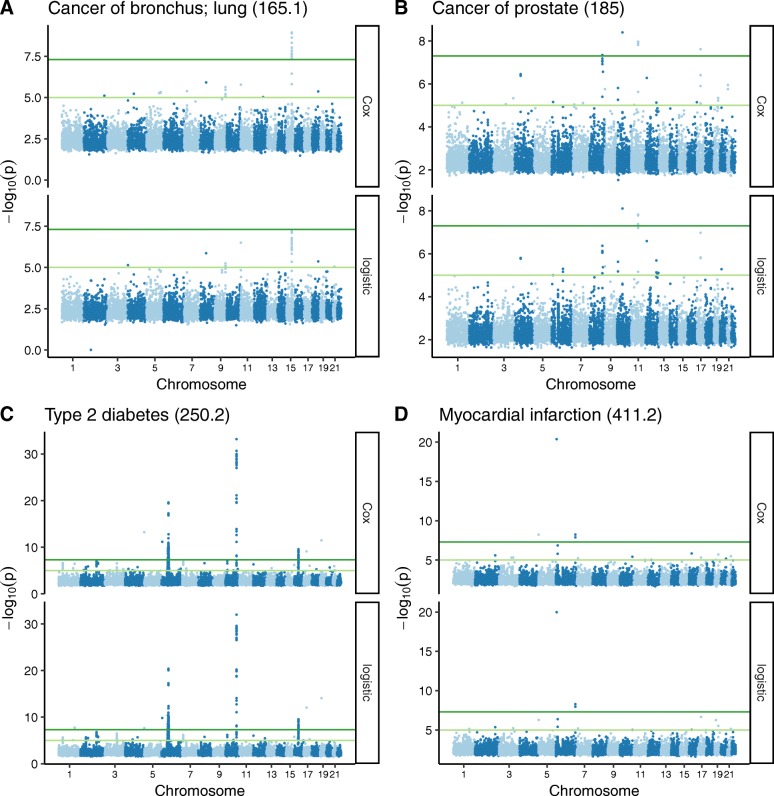
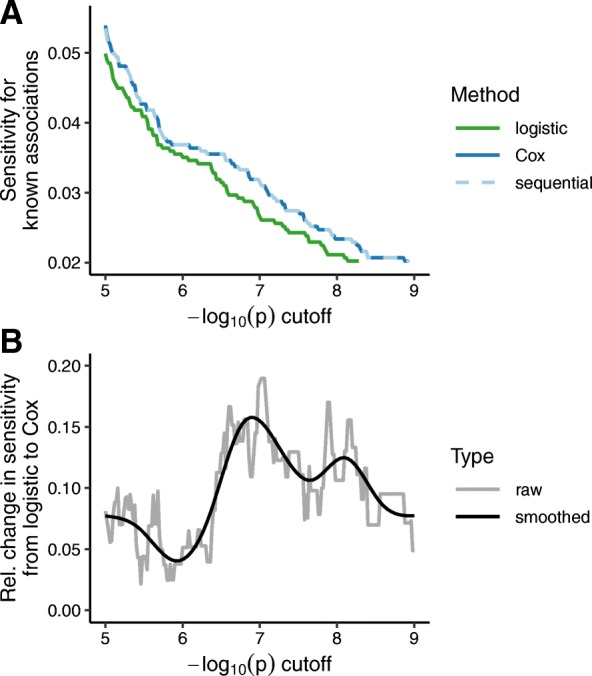
Results: In comprehensive simulations, we found that, compared to logistic regression, Cox regression had greater power at equivalent Type I error. We then scanned for genotype-phenotype associations using logistic regression and Cox regression on 50 phenotypes derived from the EHRs of 49,792 genotyped individuals. Consistent with the findings from our simulations, Cox regression had approximately 10% greater relative sensitivity for detecting known associations from the NHGRI-EBI GWAS Catalog. In terms of effect sizes, the hazard ratios estimated by Cox regression were strongly correlated with the odds ratios estimated by logistic regression.

Conclusions: As longitudinal health-related data continue to grow, Cox regression may improve our ability to identify the genetic basis for a wide range of human phenotypes.

Keywords: Cox regression; Electronic health record; GWAS; Time-to-event modeling.


Conflict of interest statement

The authors declare they have no competing interests.

Figures

Fig. 1
Fig. 1
Comparing logistic regression and Cox regression on data simulated from either a logistic model or a Cox model (1000 simulations each). Each simulation included 100 risk alleles and 799,900 alleles not associated with the phenotype. True positive rate was calculated as the fraction of risk alleles having Bonferroni-adjusted p-value less than the given cutoff. a Boxplots of true positive rate for logistic regression, Cox regression, and the sequential strategy, across simulations from each simulation model. The sequential strategy used the p-value from Cox regression, if the unadjusted p-value from logistic regression was ≤10− 4. For ease of visualization, outliers are not shown. b 95% confidence intervals of the difference between the true positive rates of Cox and logistic regression
Fig. 2
Fig. 2
Manhattan plots of GWAS results using Cox and logistic regression for four phenotypes (phecode in parentheses). For each phenotype, only associations having mean(−log10(P)) ≥ 2 are shown. Dark green lines correspond to P = 5·10− 8 and light green lines correspond to P = 10− 5
Fig. 3
Fig. 3
Comparing Cox regression and logistic regression for the ability to detect known genotype-phenotype associations for the 50 phenotypes analyzed. Known significant associations (P ≤ 5·10− 8) were curated from the NHGRI-EBI GWAS Catalog and aggregated by LD for each phenotype. a Sensitivity of each method, i.e., fraction of known and tested associations that gave a p-value less than or equal to the specified cutoff. The sequential strategy used the p-value from Cox regression, if the unadjusted p-value from logistic regression was ≤10− 4. The sequential line overlaps the Cox line. b Relative change in sensitivity between logistic and Cox regression, i.e., difference between the sensitivities for Cox and logistic, divided by the sensitivity for logistic. The gray line corresponds to the raw value at each cutoff, while the black line corresponds to the smoothed value according to a penalized cubic regression spline in a generalized additive model
Fig. 4
Fig. 4
Kaplan-Meier curves for three phenotype-SNP pairs, showing the fraction of at-risk persons still undiagnosed as a function of age and allele count. For each phenotype, the corresponding phecode is in parentheses. As in the GWAS, diagnosis was defined as the second date on which a person received the given phecode. The curves do not account for sex or principal components of genetic ancestry, and thus are not exactly equivalent to the Cox regression used for the GWAS

Similar articles

Cited by

References

    1. Denny JC, Van Driest SL, Wei W-Q, Roden DM. The Influence of Big (Clinical) Data and Genomics on Precision Medicine and Drug Development. Clin Pharmacol Ther. 2018;103:409–418. doi: 10.1002/cpt.951. - DOI - PMC - PubMed
    1. Aschard H, Vilhjálmsson BJ, Greliche N, Morange P-E, Trégouët D-A, Kraft P. Maximizing the power of principal-component analysis of correlated phenotypes in genome-wide association studies. Am J Hum Genet. 2014;94:662–676. doi: 10.1016/j.ajhg.2014.03.016. - DOI - PMC - PubMed
    1. Cortes A, Dendrou CA, Motyer A, Jostins L, Vukcevic D, Dilthey A, et al. Bayesian analysis of genetic association across tree-structured routine healthcare data in the UK Biobank. Nat Genet. 2017;49:1311–1318. doi: 10.1038/ng.3926. - DOI - PMC - PubMed
    1. Collett D. Modelling Survival Data in Medical Research: CRC Press; 2015.
    1. Cox DR. Regression models and life-tables. J R Stat Soc Series B Stat Methodol. 1972;34:187–202.