. 2019 Nov 26;116(48):24310-24316.
doi: 10.1073/pnas.1903268116. Epub 2019 Nov 4.

Hsp110 mitigates α-synuclein pathology in vivo

Affiliations

Hsp110 mitigates α-synuclein pathology in vivo

Yumiko V Taguchi et al. Proc Natl Acad Sci U S A. .

Abstract

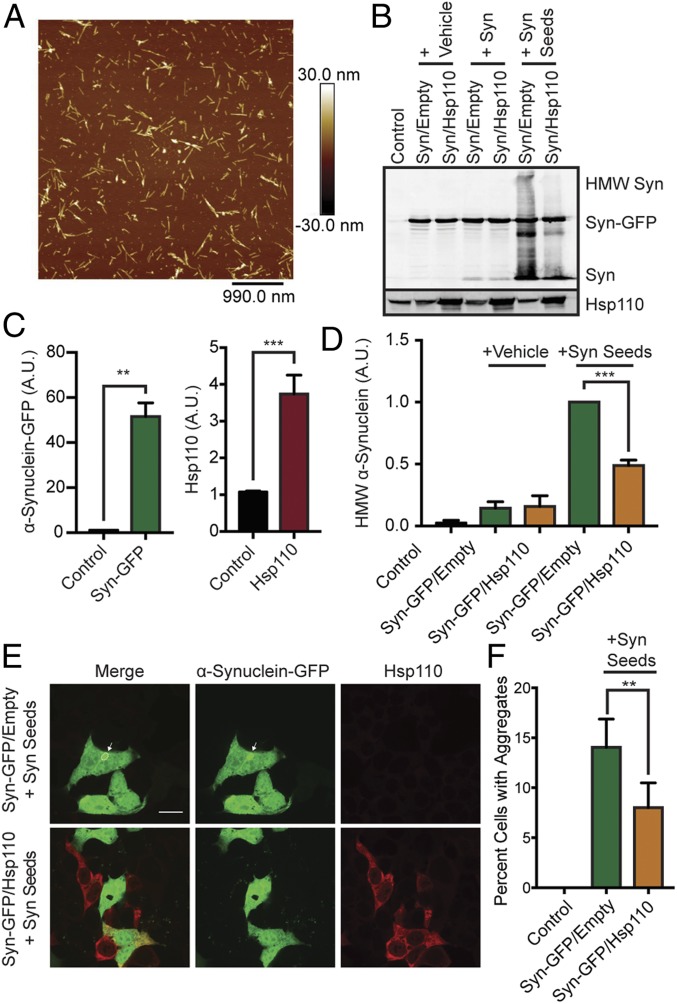
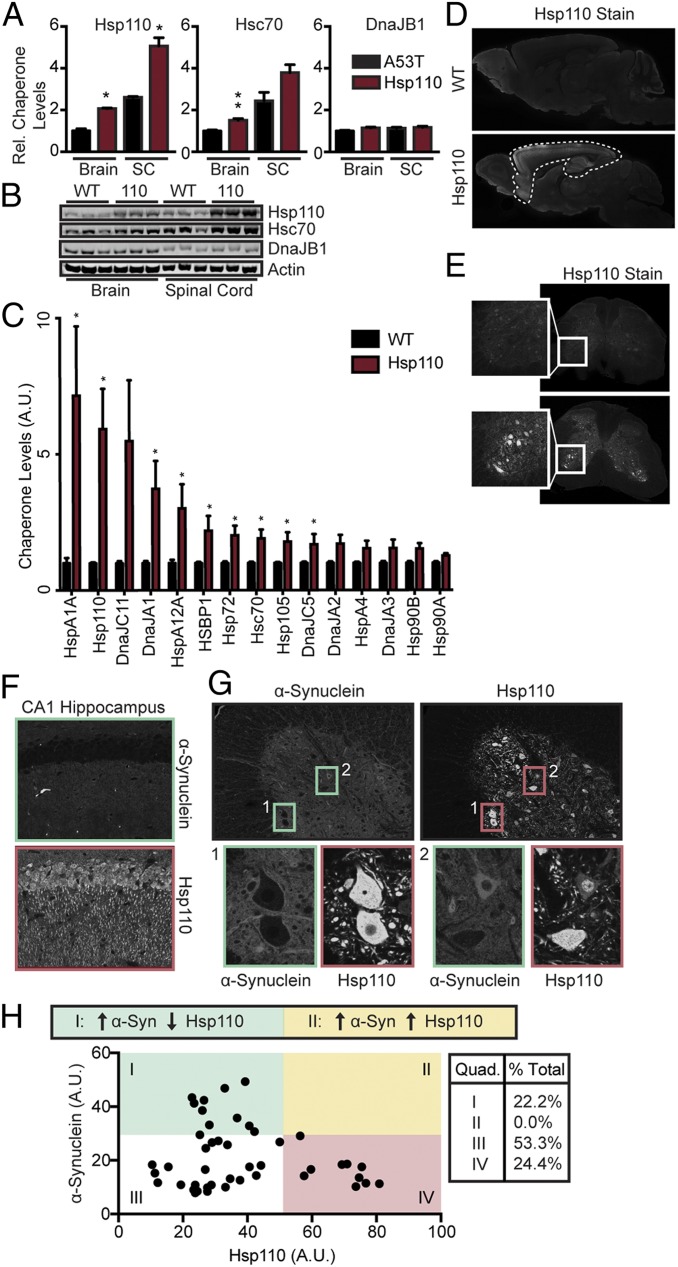
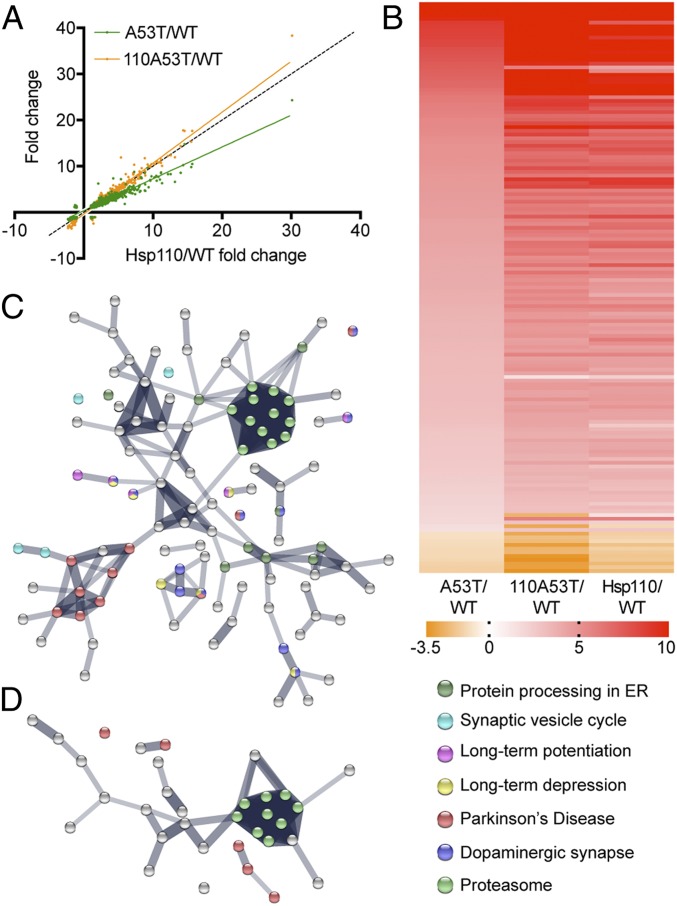
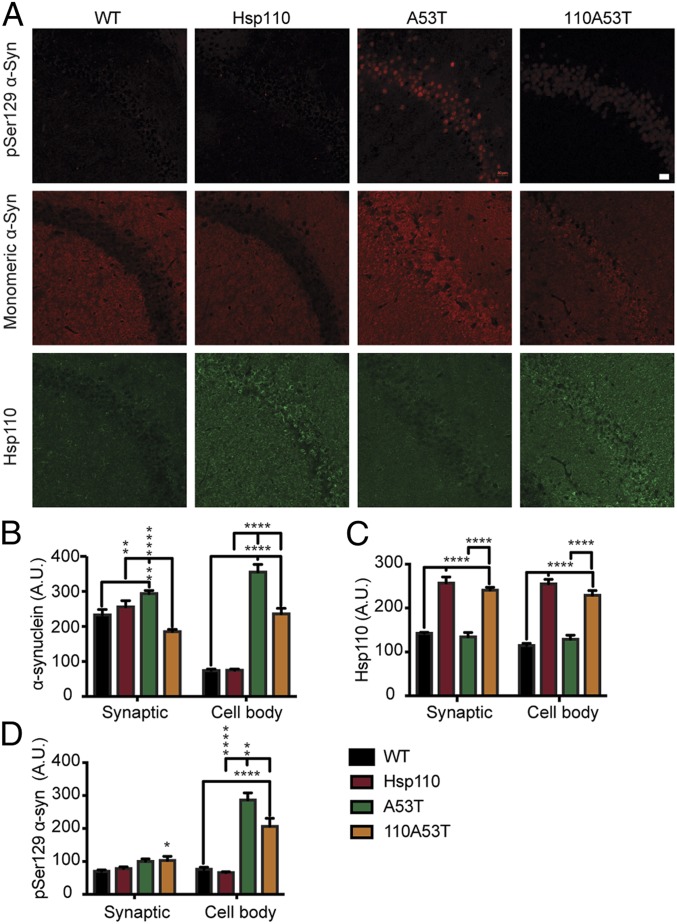
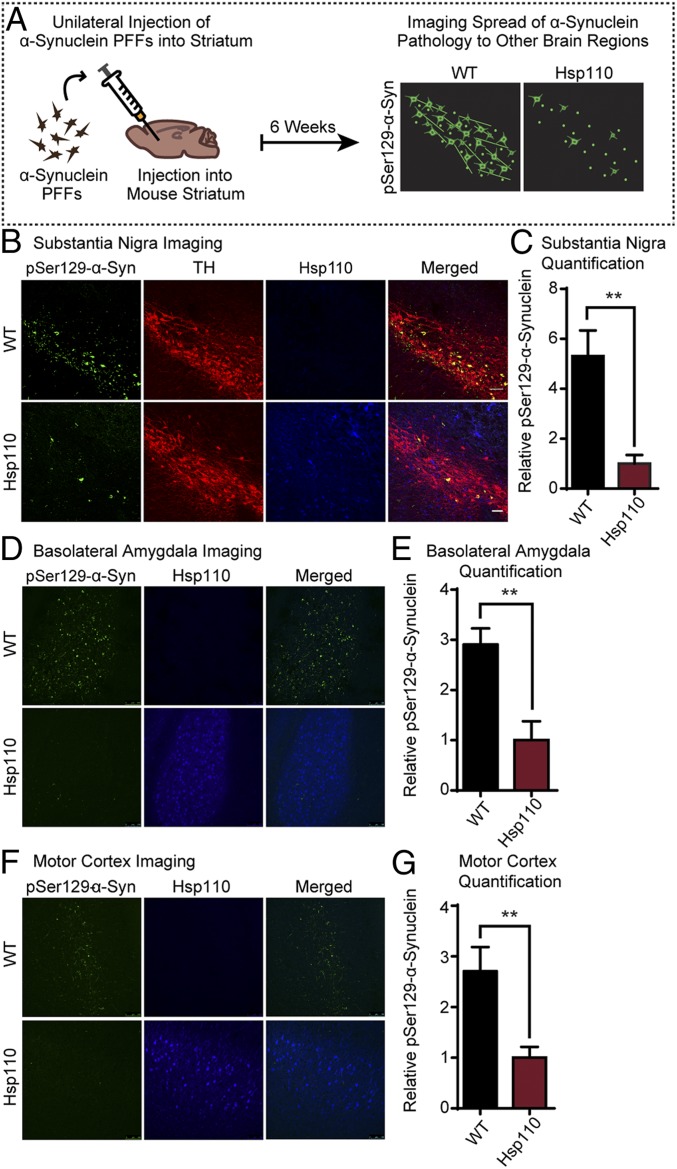
Parkinson's disease is characterized by the aggregation of the presynaptic protein α-synuclein and its deposition into pathologic Lewy bodies. While extensive research has been carried out on mediators of α-synuclein aggregation, molecular facilitators of α-synuclein disaggregation are still generally unknown. We investigated the role of molecular chaperones in both preventing and disaggregating α-synuclein oligomers and fibrils, with a focus on the mammalian disaggregase complex. Here, we show that overexpression of the chaperone Hsp110 is sufficient to reduce α-synuclein aggregation in a mammalian cell culture model. Additionally, we demonstrate that Hsp110 effectively mitigates α-synuclein pathology in vivo through the characterization of transgenic Hsp110 and double-transgenic α-synuclein/Hsp110 mouse models. Unbiased analysis of the synaptic proteome of these mice revealed that overexpression of Hsp110 can override the protein changes driven by the α-synuclein transgene. Furthermore, overexpression of Hsp110 is sufficient to prevent endogenous α-synuclein templating and spread following injection of aggregated α-synuclein seeds into brain, supporting a role for Hsp110 in the prevention and/or disaggregation of α-synuclein pathology.

Keywords: Lewy body; chaperone; disaggregase; proteomics; synapse.


Conflict of interest statement

The authors declare no competing interest.

Figures

Fig. 1.
Fig. 1.
Hsp110 overexpression in mammalian cells alleviates α-synuclein aggregation. (A) Atomic force microscopy showing morphology of α-synuclein oligomers (Syn seeds). (B) Western blot of HEK293T cells overexpressing α-synuclein–GFP or both α-synuclein–GFP and Hsp110 treated with vehicle, α-synuclein fibrils (Syn), or α-synuclein oligomers (Syn seeds). HMW α-synuclein is indicative of internalization of seeds and intracellular α-synuclein aggregation. (C) Quantification of α-synuclein–GFP and Hsp110 overexpression in HEK293T Western blot, shown in B. (D) Quantification of HMW α-synuclein in HEK293T Western blot, shown in B. n = 3 experiments per condition. (E) Representative images of HEK293T cells transfected with α-synuclein–GFP (green) and Hsp110 (red) following α-synuclein aggregate addition. (Scale bar, 10 μm applies to all panels.) A GFP-positive α-synuclein aggregate is indicated by a white arrow. (F) Quantification of the percentage of GFP-positive HEK293T cells with intracellular GFP-positive aggregates templated from added α-synuclein seeds. Two-tailed Student t test: n = 6/condition; **P < 0.01; ***P < 0.001.
Fig. 2.
Fig. 2.
Characterization of Hsp110 transgenic mouse line. (A and B) Western blot and quantitation of Hsp110, Hsc70, and DnaJB1 expression levels in whole mouse brain and spinal cord at 6 mo (n = 3/genotype). (C) Quantification of chaperone levels in WT and Hsp110 transgenics by LFQ mass spectrometry (n = 3 biological replicates, 3 technical replicates; at 6 mo). (D) Immunohistochemistry of WT and Hsp110 mouse brain stained for Hsp110 at 6 mo. Hsp110 mice show strong Hsp110 overexpression in the hippocampus, cortex, and anterior olfactory nucleus. Mild overexpression is observed in the thalamus and caudate putamen. (E) Immunohistochemistry of WT and Hsp110 mouse spinal cord stained for Hsp110 at 6 mo. (Inset) Ventral horn depicts strong somatic Hsp110 expression in motor neurons. (F) Immunohistochemistry of WT and Hsp110 mouse hippocampus stained for Hsp110 at 6 mo. (G) Representative fluorescence images of the ventral horn of L2 of the spinal cord of 6-mo-old Hsp110-overexpressing mice, stained with α-synuclein (Left, green channel) and Hsp110 (Right, red channel). α-Synuclein exposure has been artificially increased in the Left image to allow for easier viewing. Two representative images of neurons are enlarged in both channels. Inset 1 depicts an example of motor neurons with low somatic α-synuclein and high somatic Hsp110 levels (quadrant IV in H), while Inset 2 depicts an example of a motor neuron with high somatic α-synuclein and low somatic Hsp110 (quadrant I in H). (H) Scatterplot illustrating somatic α-synuclein and Hsp110 levels in each motor neuron assessed. A mild inverse relationship was found (slope = −0.35, R2 = 0.22), with no high-fluorescing Hsp110 cells also expressing high levels of α-synuclein. n = 45 cells. Quadrants are defined with an α-synuclein threshold of 30 A.U. and Hsp110 threshold of 50 A.U. All Hsp110 motor neurons fall in quadrants I, III, and IV, while no neurons fall in quadrant II, suggesting that high expression of Hsp110 prevents somatic relocation of α-synuclein. n = 3 to 4 mice/genotype; *P < 0.05; **P < 0.01. Data analyzed by Student’s t test in C.
Fig. 3.
Fig. 3.
Proteomic analysis of 110A53T, A53T, and Hsp110 brains. (A) Synaptic protein expression levels in 110A53T were plotted against those in A53T and Hsp110 after normalization to WT. Confidence interval for slope of the line for A53T = 0.606 ± 0.006 while slope of the line for Hsp110 = 0.844 ± 0.00611. Dotted line indicates x = y. (B) Heatmap of protein expression changes in A53T, Hsp110, and 110A53T as compared to WT. The expression levels of 142 proteins with a >1-fold change difference in A53T/WT versus 110A53T/WT are shown here in order of decreasing A53T/WT ratio. Red indicates a 10-fold change or greater, orange indicates a −3.5-fold change or less, and white indicates no change. (C) STRING analysis of differences between A53T and 110A53T. (D) STRING analysis of differences between Hsp110 and 110A53T. n = 3 biological, 3 technical replicates. Mice were 6 mo old.
Fig. 4.
Fig. 4.
Characterization of α-synuclein pathology in 110A53T brains. (A) Representative fluorescence images of 6-mo-old WT, Hsp110, A53T, and 110A53T mouse CA1 of hippocampus. First row of images: pSer129–α-synuclein in red; second row, total α-synuclein in red; and third row, Hsp110 in green. (Scale bar, 20 μm, applies to all panels.) (B) Quantification of total α-synuclein levels in cell body layer as well as synaptic regions; n = 3 mice per genotype. (C) Quantification of Hsp110 levels in cell body layer and in synaptic regions; n = 3 mice per genotype. (D) Quantification of pSer129–α-synuclein levels in cell body layer and in synaptic regions, n = 3 mice per genotype. Data were analyzed by ANOVA; *P value < 0.05; **P value < 0.01; ****P value < 0.0001.
Fig. 5.
Fig. 5.
Transgenic expression of Hsp110 mitigates the spread of injected α-synuclein PFFs. (A) Schematic showing stereotaxic brain injections of α-synuclein PFFs and subsequent imaging. WT and Hsp110 mice were injected with α-synuclein PFFs into the striatum at 7 mo of age. After 6 wk, the mice were perfused, and the substantia nigra was imaged for the presence of pSer129–α-synuclein, indicating spread of pathology from the striatum. (B) Representative images of WT and Hsp110 mouse substantia nigra 6 wk postinjection, with pSer129–α-synuclein stained in green, tyrosine hydroxylase (TH) stained in red, and Hsp110 in blue. (C) Quantitation of pSer129–α-synuclein levels in WT and Hsp110 mouse substantia nigra. n = 6 mice/genotype; **P < 0.01, Student’s t test. (D) Representative images of WT and Hsp110 mouse basolateral amygdala 6 wk postinjection with pSer129–α-synuclein stained in green and Hsp110 in blue. (E) Quantitation of pSer129–α-synuclein levels in WT and Hsp110 mouse basolateral amygdala. n = 6 or 7 mice/genotype; **P < 0.01, Student’s t test. (F) Representative images of WT and Hsp110 mouse motor cortex 6 wk postinjection, with pSer129–α-synuclein stained in green and Hsp110 in blue. (G) Quantitation of pSer129–α-synuclein levels in WT and Hsp110 mouse motor cortex. (Scale bar, 50 μm, and applies to all panels in A, B, D, and F.) n = 6 or 7 mice/genotype; **P < 0.01, Student’s t test.

References

    1. Nussbaum R. L., Ellis C. E., Alzheimer’s disease and Parkinson’s disease. N. Engl. J. Med. 348, 1356–1364 (2003). - PubMed
    1. Chandra S., Chen X., Rizo J., Jahn R., Südhof T. C., A broken alpha-helix in folded alpha-synuclein. J. Biol. Chem. 278, 15313–15318 (2003). - PubMed
    1. Vargas K. J., et al. , Synucleins regulate the kinetics of synaptic vesicle endocytosis. J. Neurosci. 34, 9364–9376 (2014). - PMC - PubMed
    1. Nemani V. M., et al. , Increased expression of alpha-synuclein reduces neurotransmitter release by inhibiting synaptic vesicle reclustering after endocytosis. Neuron 65, 66–79 (2010). - PMC - PubMed
    1. Burré J., et al. , Alpha-synuclein promotes SNARE-complex assembly in vivo and in vitro. Science 329, 1663–1667 (2010). - PMC - PubMed

Publication types

MeSH terms