. 2019 Nov 19;116(47):23743-23752.
doi: 10.1073/pnas.1912625116. Epub 2019 Nov 4.

Maternal diabetes induces autism-like behavior by hyperglycemia-mediated persistent oxidative stress and suppression of superoxide dismutase 2

Affiliations

Maternal diabetes induces autism-like behavior by hyperglycemia-mediated persistent oxidative stress and suppression of superoxide dismutase 2

Xiumin Wang et al. Proc Natl Acad Sci U S A. .

Abstract

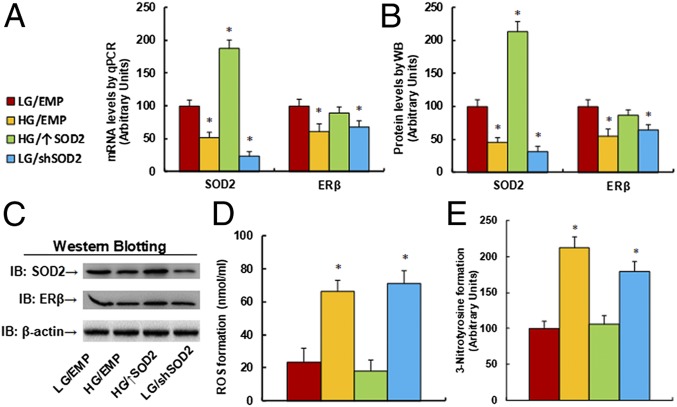
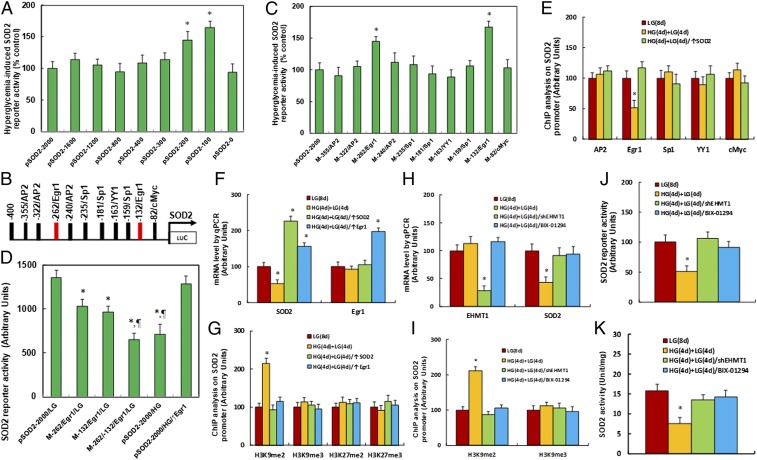
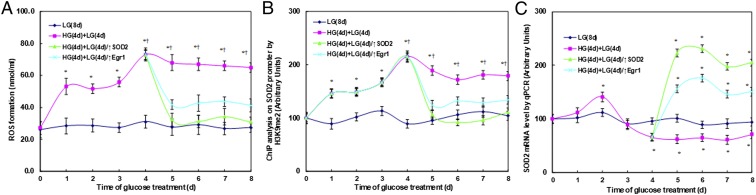
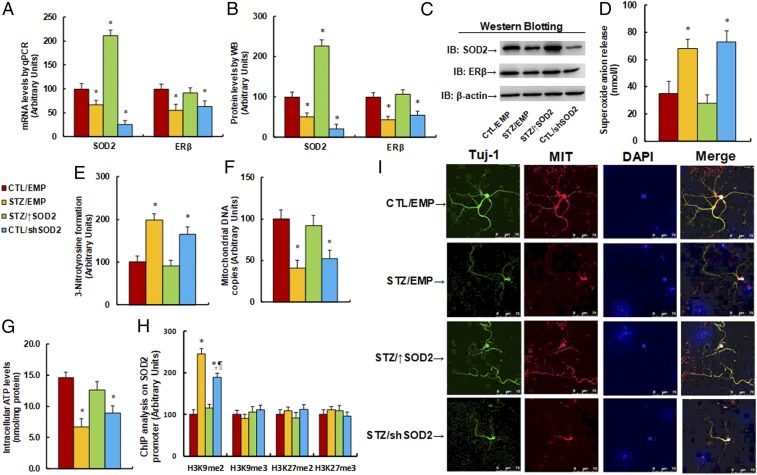
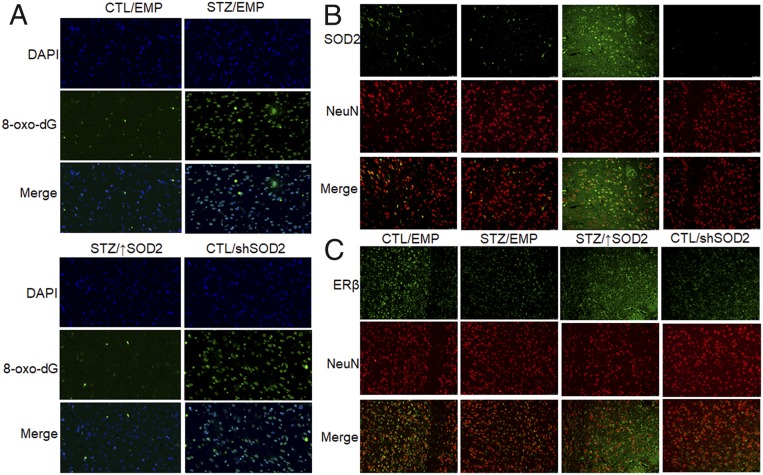
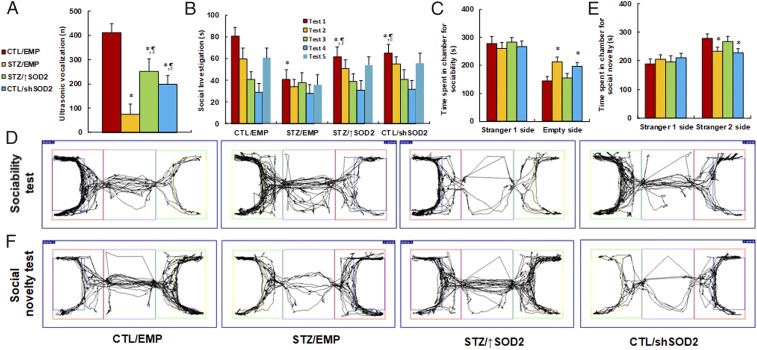
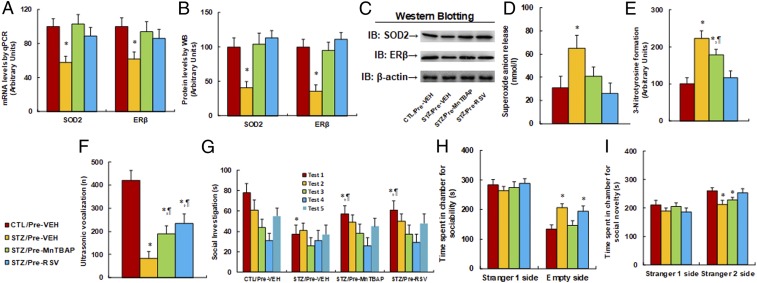
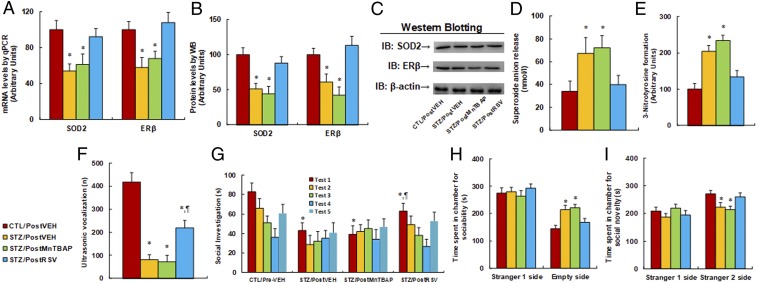
Epidemiological studies show that maternal diabetes is associated with an increased risk of autism spectrum disorders (ASDs), although the detailed mechanisms remain unclear. The present study aims to investigate the potential effect of maternal diabetes on autism-like behavior in offspring. The results of in vitro study showed that transient hyperglycemia induces persistent reactive oxygen species (ROS) generation with suppressed superoxide dismutase 2 (SOD2) expression. Additionally, we found that SOD2 suppression is due to oxidative stress-mediated histone methylation and the subsequent dissociation of early growth response 1 (Egr1) on the SOD2 promoter. Furthermore, in vivo rat experiments showed that maternal diabetes induces SOD2 suppression in the amygdala, resulting in autism-like behavior in offspring. SOD2 overexpression restores, while SOD2 knockdown mimics, this effect, indicating that oxidative stress and SOD2 expression play important roles in maternal diabetes-induced autism-like behavior in offspring, while prenatal and postnatal treatment using antioxidants permeable to the blood-brain barrier partly ameliorated this effect. We conclude that maternal diabetes induces autism-like behavior through hyperglycemia-mediated persistent oxidative stress and SOD2 suppression. Here we report a potential mechanism for maternal diabetes-induced ASD.

Keywords: SOD2; autism spectrum disorders; epigenetics; maternal diabetes; oxidative stress.


Conflict of interest statement

The authors declare no competing interest.

Figures

Fig. 1.
Fig. 1.
Hyperglycemia induces SOD2 suppression and oxidative stress. Human ACS-5003 neurons were infected with empty (EMP), SOD2 overexpression (↑SOD2), or SOD2 knockdown (shSOD2) lentivirus for 1 d and then treated with either 5 mM low glucose (LG) or 25 mM high glucose (HG) for 4 d in the presence of 1% serum; the cells were then harvested for further analysis. (A) The mRNA levels for gene expression of SOD2 and ERβ (n = 4). (B) Quantitation of protein levels (n = 5). (C) Representative Western blotting pictures for B. (D) ROS formation (n = 5). (E) The 3-nitrotyrosine formation (n = 5; *P < 0.05 vs. LG/EMP group). Data are expressed as mean ± SEM.
Fig. 2.
Fig. 2.
Hyperglycemia induces SOD2 suppression through histone methylation and the subsequent decreased association of Egr1 on the SOD2 promoter. (A) The conditional immortalized ACS-5003 neurons were transiently transfected by either SOD2 full length (pSOD2-2000) or deletion reporter plasmids. After 24 h, the cells were treated by either 5 mM low glucose (LG) or 25 mM high glucose (HG) for 3 d, and the SOD2 reporter activities were calculated (n = 4; *P < 0.05 vs. pSOD2-2000 group). (B) The schematic picture for the potential transcriptional binding motif in the range of approximately −400 to 0 (from transcription start site) on the SOD2 promoter in addition to the 2 potential Egr1 binding sites are marked in red. (C) The cells were transiently transfected by either wild type SOD2 reporter construct (pSOD2-2000) or single point mutation at the site shown in B and then treated with either LG or HG for 3 d, and the SOD2 reporter activities were calculated (n = 4; *P < 0.05 vs. pSOD2-2000 group). (D) The cells were transiently transfected by SOD2 full length (pSOD2-2000) or single point mutation as indicated or infected by Egr1 lentivirus (↑Egr1), and were then treated with either LG or HG for 3 d; the SOD2 reporter activities were then calculated (n = 4; *P < 0.05 vs. pSOD2-2000/LG group; P < 0.05 vs. M-262/Egr1/LG group). (E) Cells were treated by either 8-d LG [LG(8 d)], or 4-d HG plus 4-d LG [HG(4 d)+LG(4 d)] or the cells were infected on day 4 by SOD2 lentivirus [HG(4 d)+LG(4 d)/SOD2↑]; the cells were then used for ChIP analysis [n = 4; *P < 0.05 vs. LG(8 d) group]. (F and G) Cells were treated by either LG(8 d) or HG(4 d)+LG(4 d) or the cells were infected on day 4 by SOD2 [HG(4 d)+LG(4 d)/↑SOD2] or Egr1 lentivirus [HG(4 d)+LG(4 d)/↑Egr1]; the cells were then used for ChIP analysis [n = 4; *P < 0.05 vs. LG(8 d) group]. (HK) Cells were treated by either LG(8 d) or HG(4 d)+LG(4 d), and the cells were infected on day 4 by shEHMT1 lentivirus [HG(4 d)+LG(4 d)/shEHMT1] or cells were treated on day 4 by EHMT1 inhibitor BIX-01294 [HG(4 d)+LG(4 d)/BIX-01294]; then, cells were used for the following further analysis: (H) mRNA analysis (n = 4), (I) ChIP analysis by H3K9me2 and H3K9me3 antibodies (n = 4), (J) SOD2 reporter activity assay (n = 5), and (K) SOD2 activities [n = 5; *P < 0.05 vs. LG(8 d) group]. Data are expressed as mean ± SEM.
Fig. 3.
Fig. 3.
Hyperglycemia-induced persistent oxidative stress and SOD2 suppression were restored by expression of SOD2/Egr1 lentivirus. The human ACS-5003 neurons were treated by either 8-d LG [LG(8 d)] or 4-d HG plus 4-d LG [HG(4 d)+LG(4 d)] or the cells were infected on day 4 by SOD2 lentivirus [HG(4 d)+LG(4 d)/↑SOD2] or Egr1 lentivirus [HG(4 d)+LG(4 d)/↑Egr1]; the cells were then used for further analysis: (A) ROS formation (n = 4), (B) ChIP analysis on SOD2 promoter (n = 4), and (C) SOD2 mRNA levels [n = 4; *P < 0.05 vs. LG(8 d) at day 0 group; P < 0.05 vs. LG(8 d) at day 1 group]. Data are expressed as mean ± SEM.
Fig. 4.
Fig. 4.
Maternal diabetes induces suppression of SOD2 and ERβ with oxidative stress and mitochondrial dysfunction, while SOD2 overexpression restores, and SOD2 knockdown mimics, this effect. The 6-wk-old male offspring from dams where diabetes (STZ) had been induced or from controls (CTL) received empty (EMP), SOD2 overexpression (↑SOD2), or SOD2 knockdown (shERβ) lentivirus infusion; then, the offspring at 8 wk of age were sacrificed for further analysis. (AJ) The amygdala tissues were isolated for further analysis as below: (A) mRNA levels for gene expression of SOD2 and ER (n = 4), (B) representative pictures for Western blotting, (C) quantitation of protein levels (n = 5), (D) in vivo superoxide anion release (n = 5), (E) quantitation of 3-nitrotyrosine formation (n = 5), (F) mitochondrial DNA copies (n = 4), and (G) intracellular ATP levels (n = 5). (H and I) The amygdala neurons were isolated at embryonic day (E18) from the above treatment for further analysis. (H) ChIP analysis for histone modification in amygdala neurons (n = 4). (I) Immunostaining in amygdala neurons. The Tuj-1 was stained as neuron marker (green), mitochondria (MIT) was stained by MitoBeacon (red), nuclei were stained by DAPI (blue), and “merge” means the mixed color of triple staining (*P < 0.05 vs. CTL/EMP group; P < 0.05 vs. STZ/EMP group). Data are expressed as mean ± SEM. (Magnification, 400×.)
Fig. 5.
Fig. 5.
Immunohistochemistry staining of amygdala. The 6-wk-old male offspring from either the control (CTL) or maternal diabetes (STZ) groups received empty control (EMP), SOD2 overexpression (↑SOD2), or SOD2 knockdown (shERβ) lentivirus infusion. Then, the offspring at 8 wk old were sacrificed, and the amygdala was isolated for immunohistochemistry staining. (A) The 8-oxo-dG staining for oxidative stress (green) and DAPI staining for nuclei (blue). (B) SOD2 staining (green) and NeuN staining for neurons (red). (C) ERβ staining (green) and NeuN staining for neurons (red). (Magnification, 100×.)
Fig. 6.
Fig. 6.
Maternal diabetes induces autism-like behavior in offspring, while SOD2 overexpression restores, and SOD2 knockdown mimics, this effect. The 6-wk-old male offspring from either the control (CTL) or maternal diabetes (STZ) groups received empty control (EMP), SOD2 overexpression (↑SOD2), or SOD2 knockdown (shERβ) lentivirus infusion, and then the offspring at 8 wk of age were used for autism-like behavior analysis. (A) Ultrasonic vocalization (n = 9). (B) Social recognition: seconds socially investigating a conspecific [same conspecific in tests 1 to 4; novel conspecific in test 5 (a new stimulus rat was introduced), n = 9; *P < 0.05 vs. CTL/EMP group; P < 0.05 vs. STZ/EMP group]. (CF) Three-chambered social tests (n = 8). (C) Time spent in chamber for sociability. (D) Representative trace recorder for C. (E) Time spent in chamber for social novelty. (F) Representative trace recorder for E (*P < 0.05 vs. CTL/EMP group; P < 0.05 vs. STZ/EMP group). Data are expressed as mean ± SEM.
Fig. 7.
Fig. 7.
Prenatal treatment of SOD mimetic MnTBAP and resveratrol partly ameliorates maternal diabetes-induced autism-like behavior in offspring. The dams from either maternal diabetes (STZ) or control (CTL) group received treatments of either SOD mimetic MnTBAP or resveratrol (RSV), and the 8-wk-old male offspring were used for autism-like behavior analysis before being sacrificed for further biomedical analysis. (AE) The amygdala tissues were isolated for further analysis as below: (A) mRNA levels for gene expression of SOD2 and ERβ (n = 4), (B) representative pictures for Western blotting, (C) quantitation of protein levels (n = 5), (D) in vivo superoxide anion release (n = 5), (E) quantitation of 3-nitrotyrosine formation (n = 5), (FI) autism-like behavior analysis (n = 8), and (F) ultrasonic vocalization (n = 9). (G) Social recognition: seconds socially investigating a conspecific [same conspecific in tests 1 to 4; novel conspecific in test 5 (a new stimulus rat was introduced), n = 9; *P < 0.05 vs. CTL/EMP group; P < 0.05 vs. STZ/EMP group]. (H and I) Three-chambered social tests for time spent in chamber for sociability (H) and time spent in chamber for social novelty (I). *P < 0.05 vs. CTL/Pre-VEH group. Data are expressed as mean ± SEM.
Fig. 8.
Fig. 8.
Postnatal treatment of resveratrol partly ameliorates maternal diabetes-induced autism-like behavior in offspring, while SOD mimetic MnTBAP has no effect. The male offspring at 6 wk old from either the maternal diabetes (STZ) or control (CTL) groups received treatments of either SOD mimetic MnTBAP or resveratrol (RSV), and the 8-wk-old male offspring were used for autism-like behavior analysis before being sacrificed for further biomedical analysis. (AE) The amygdala tissues were isolated for further analysis as below: (A) mRNA levels for gene expression of SOD2 and ERβ (n = 4), (B) representative pictures for Western blotting, (C) quantitation of protein levels (n = 5), (D) in vivo superoxide anion release (n = 5), (E) quantitation of 3-nitrotyrosine formation (n = 5), (FI) autism-like behavior analysis (n = 8), and (F) ultrasonic vocalization (n = 6). (G) Social recognition: seconds socially investigating a conspecific [same conspecific in tests 1 to 4; novel conspecific in test 5 (a new stimulus rat was introduced), n = 9; *P < 0.05 vs. CTL/EMP group; P < 0.05 vs. STZ/EMP group]. (H and I) Three-chambered social tests for time spent in chamber for sociability (H) and time spent in chamber for social novelty (I). *P < 0.05 vs. CTL/Pre-VEH group. Data are expressed as mean ± SEM.

References

    1. Hoirisch-Clapauch S., Nardi A. E., Autism spectrum disorders: Let’s talk about glucose? Transl. Psychiatry 9, 51 (2019). - PMC - PubMed
    1. Langguth M., Fassin M., Alexander S., Turner K. M., Burne T. H. J., No effect of prenatal vitamin D deficiency on autism-relevant behaviours in multiple inbred strains of mice. Behav. Brain Res. 348, 42–52 (2018). - PubMed
    1. Xie W., et al. , Resveratrol ameliorates prenatal progestin exposure-induced autism-like behavior through ERβ activation. Mol. Autism 9, 43 (2018). - PMC - PubMed
    1. Modabbernia A., Velthorst E., Reichenberg A., Environmental risk factors for autism: An evidence-based review of systematic reviews and meta-analyses. Mol. Autism 8, 13 (2017). - PMC - PubMed
    1. Rossignol D. A., Frye R. E., A review of research trends in physiological abnormalities in autism spectrum disorders: Immune dysregulation, inflammation, oxidative stress, mitochondrial dysfunction and environmental toxicant exposures. Mol. Psychiatry 17, 389–401 (2012). - PMC - PubMed

Publication types

MeSH terms