. 2019 Nov;21(11):1321-1333.
doi: 10.1038/s41556-019-0402-6. Epub 2019 Nov 4.

Epigenetic remodelling licences adult cholangiocytes for organoid formation and liver regeneration

Affiliations

Epigenetic remodelling licences adult cholangiocytes for organoid formation and liver regeneration

Luigi Aloia et al. Nat Cell Biol. 2019 Nov.

Abstract

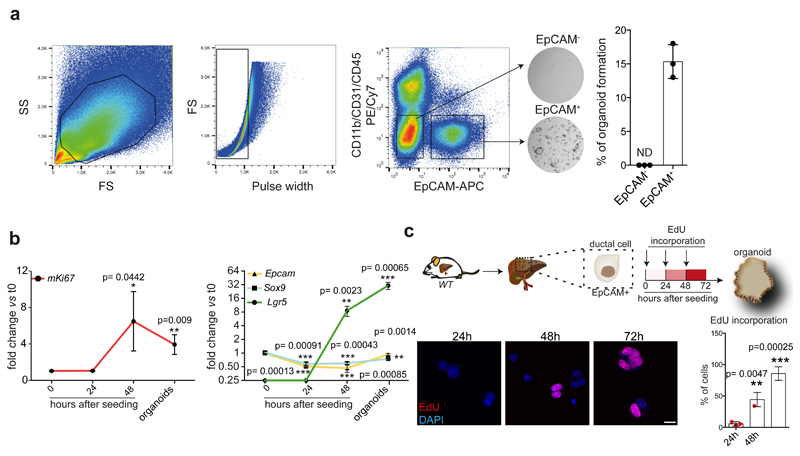
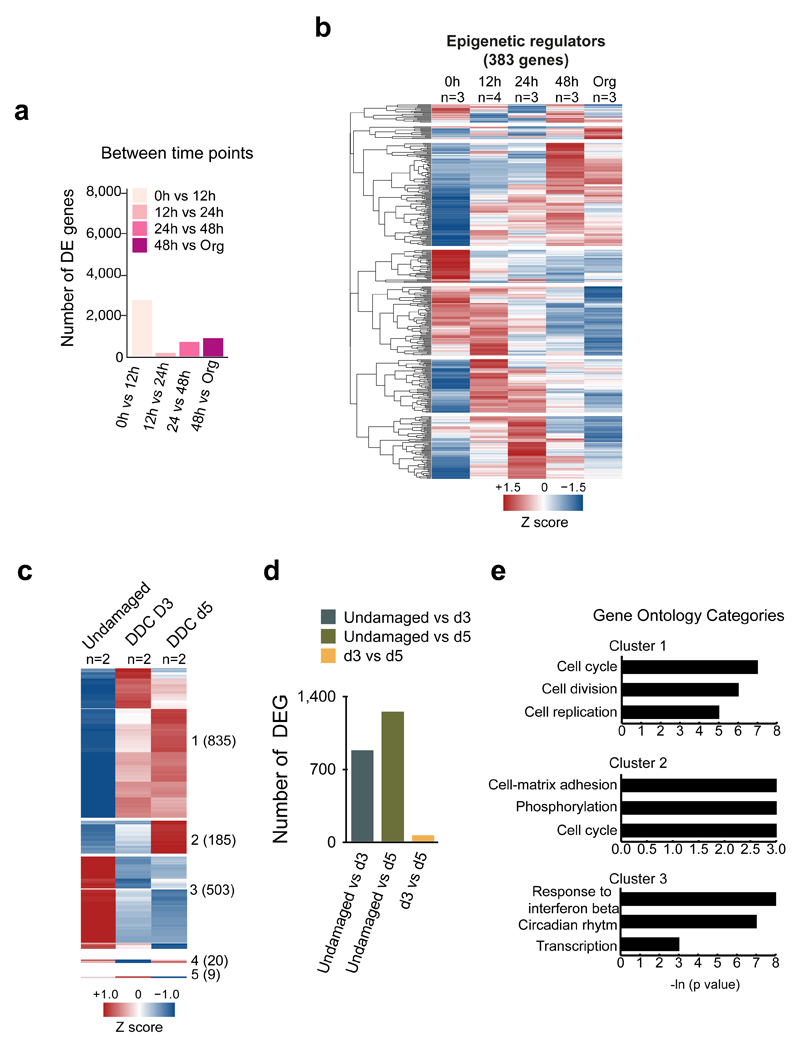
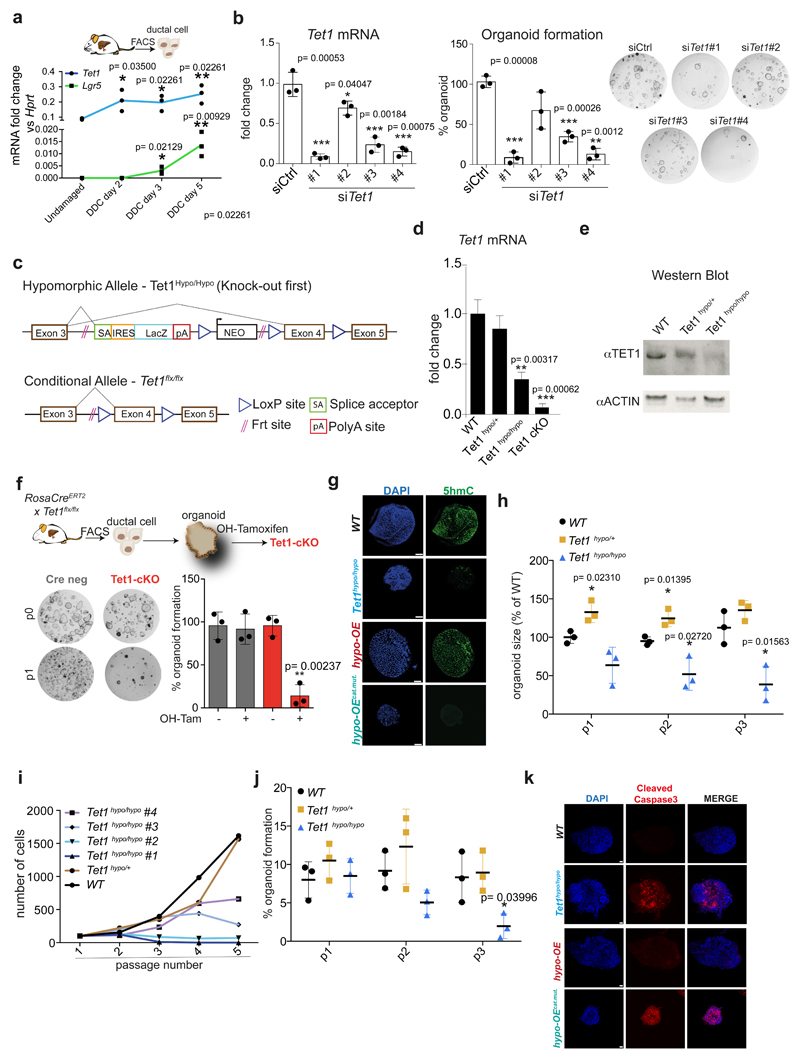
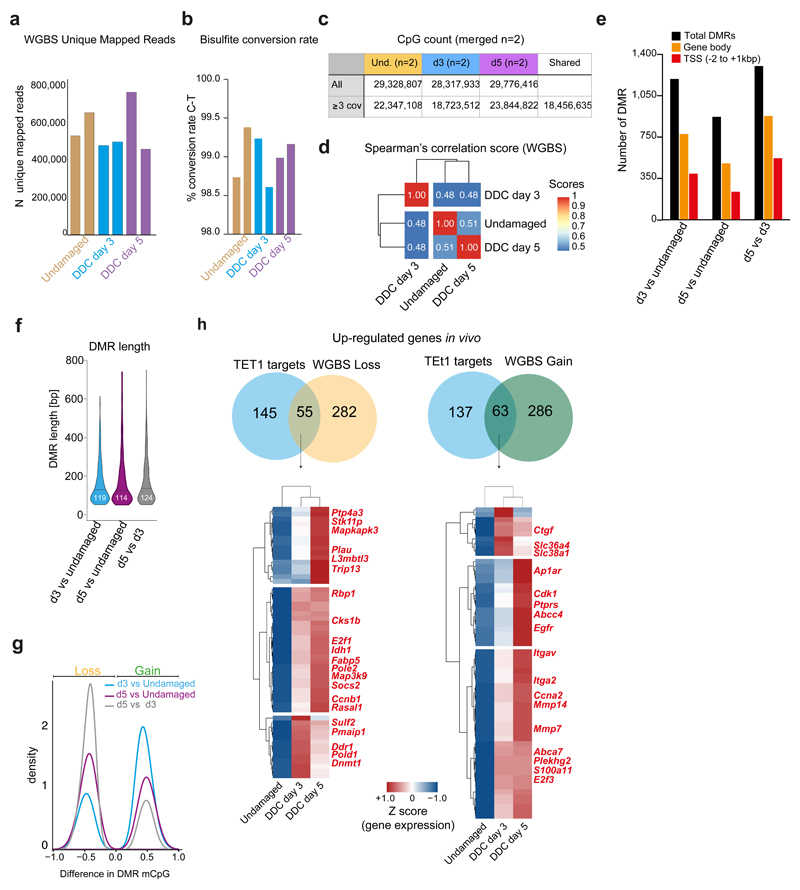
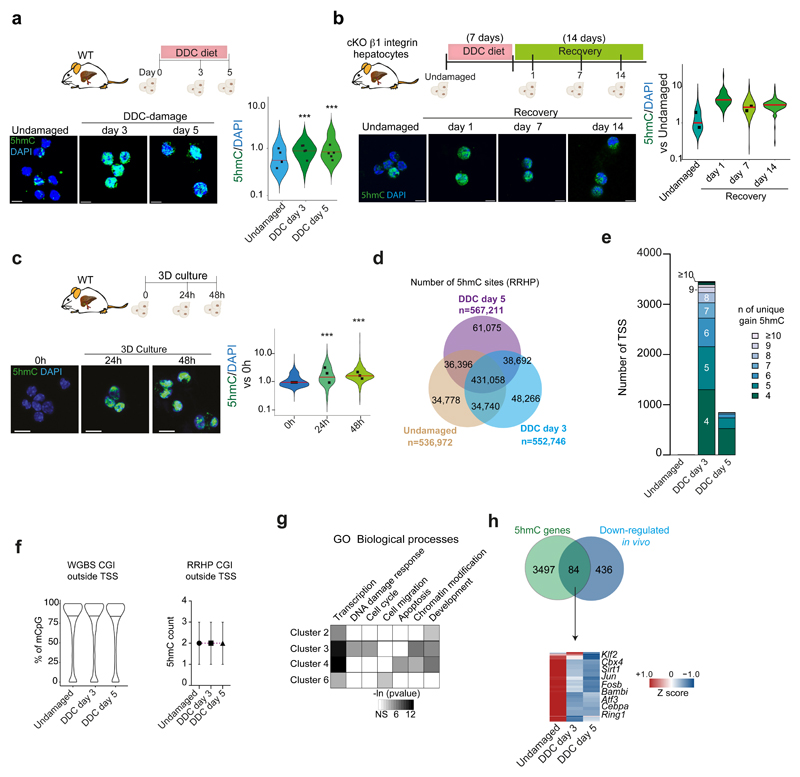
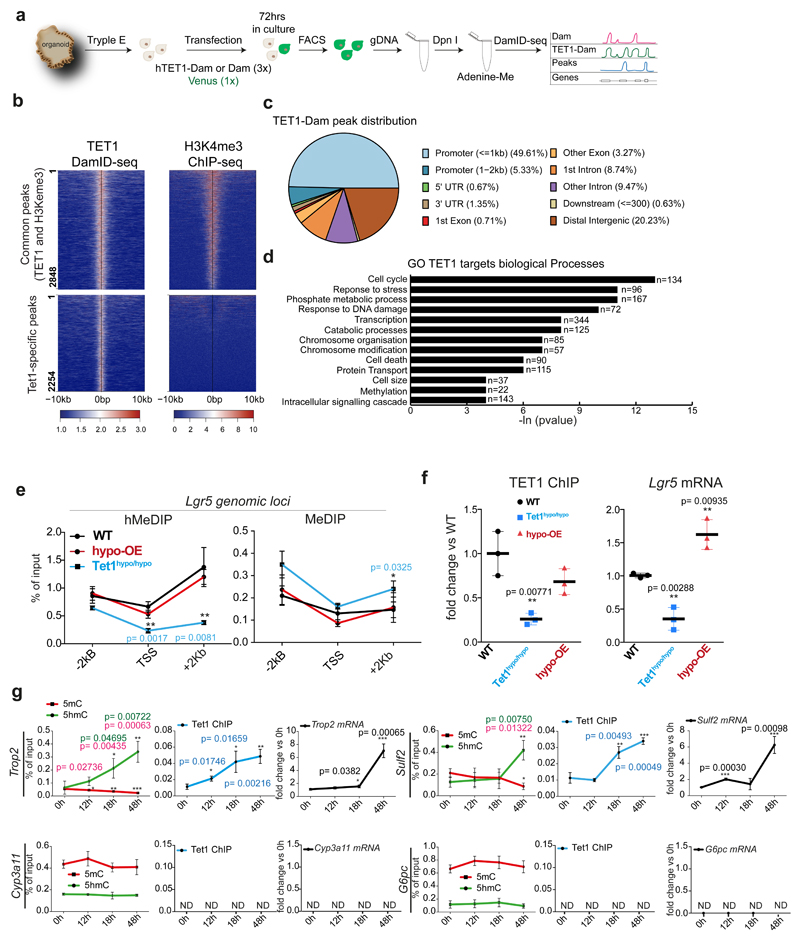
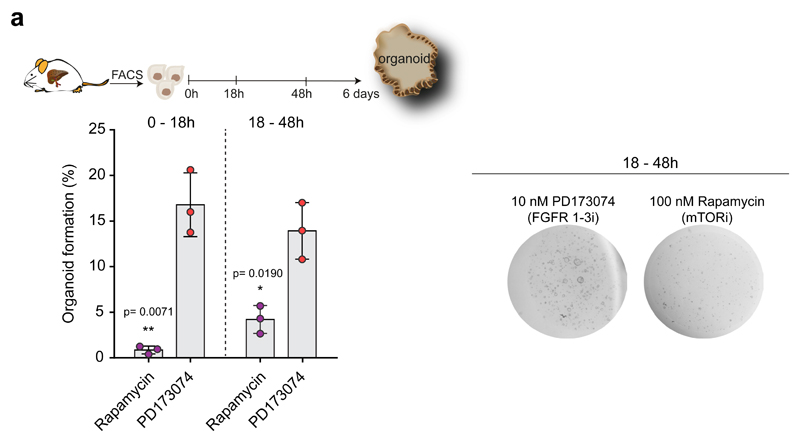
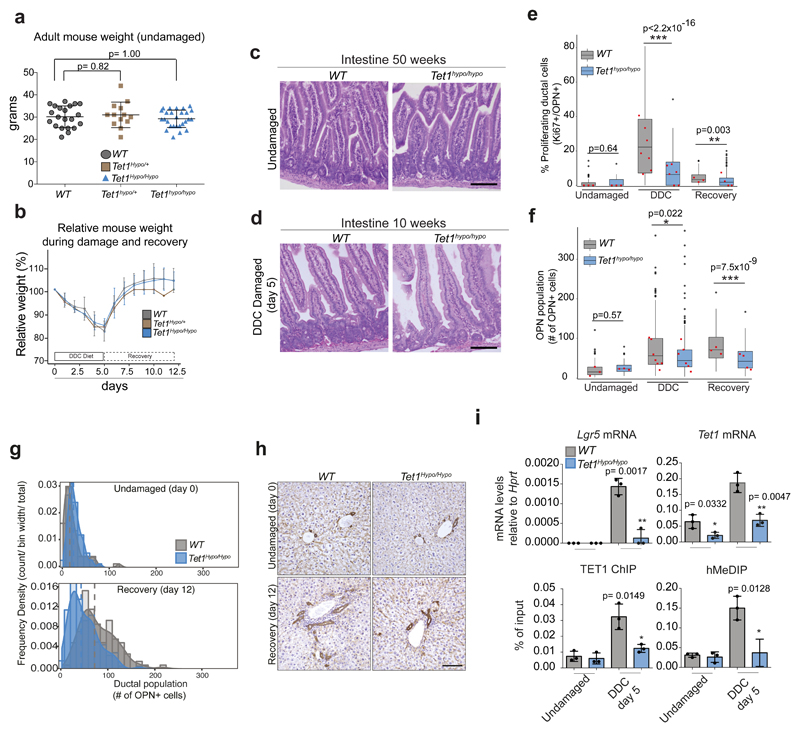
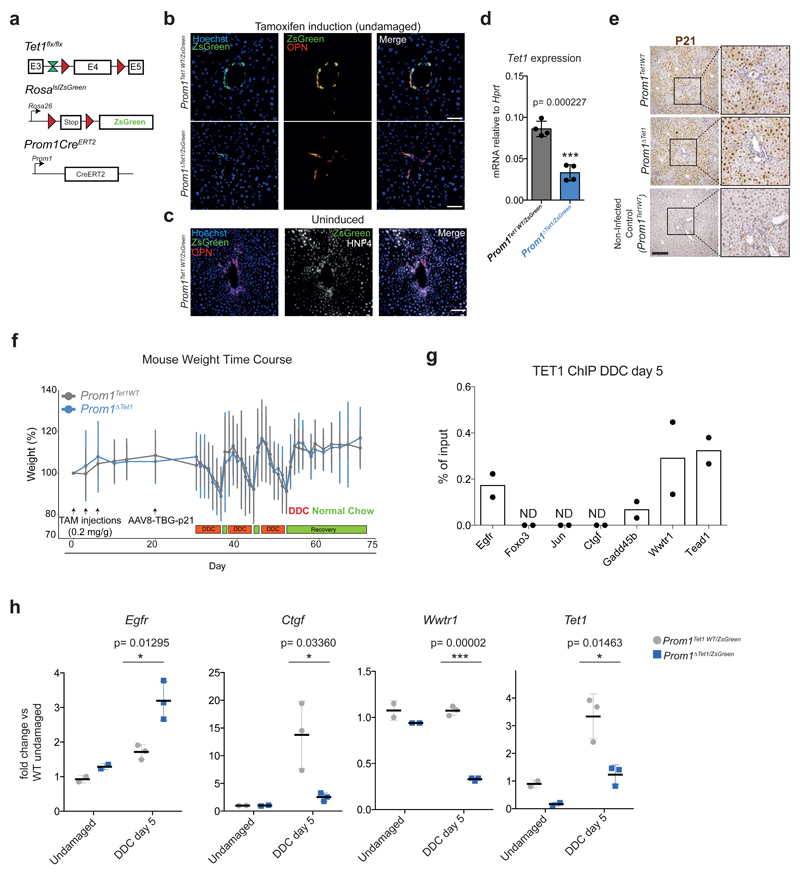
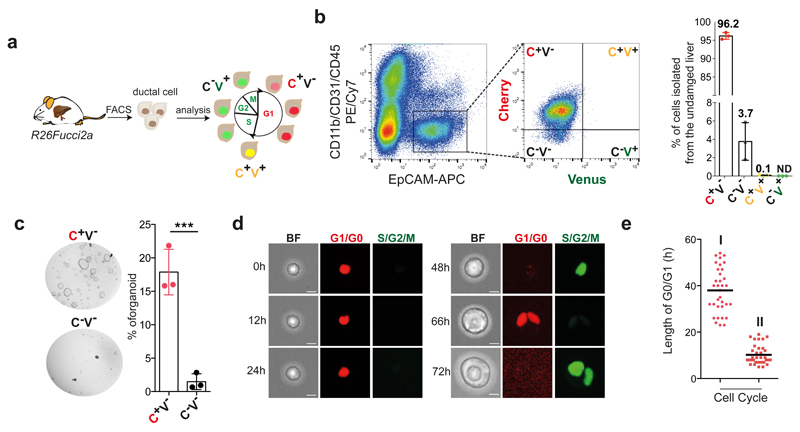
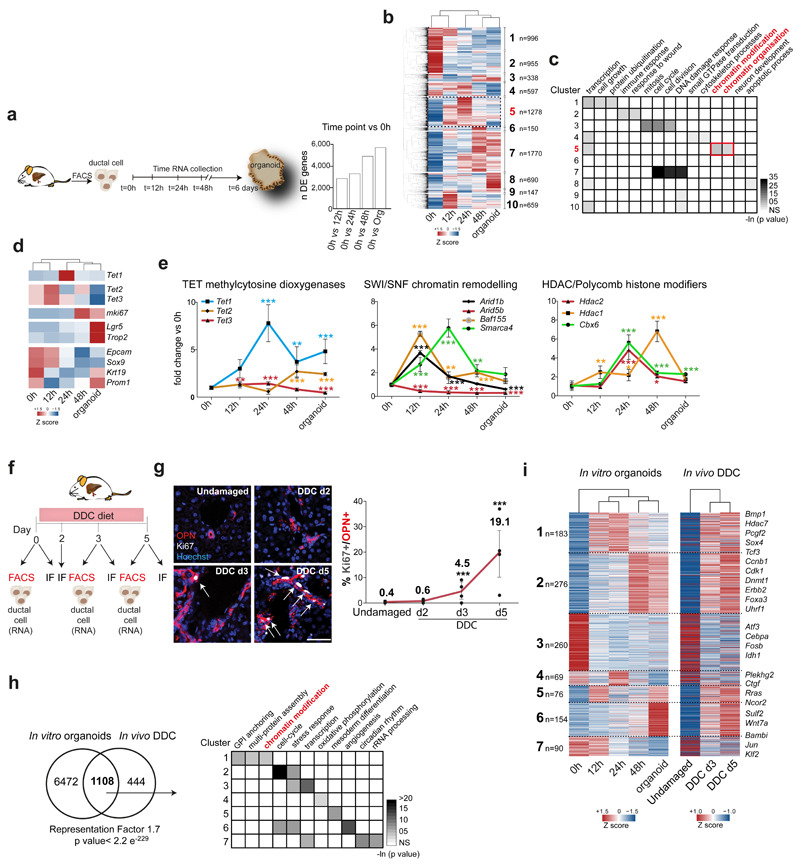
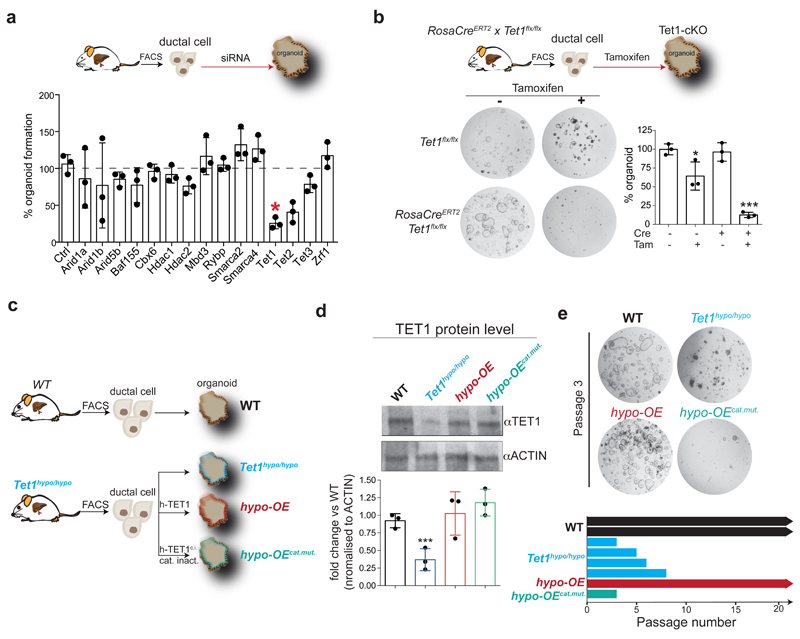
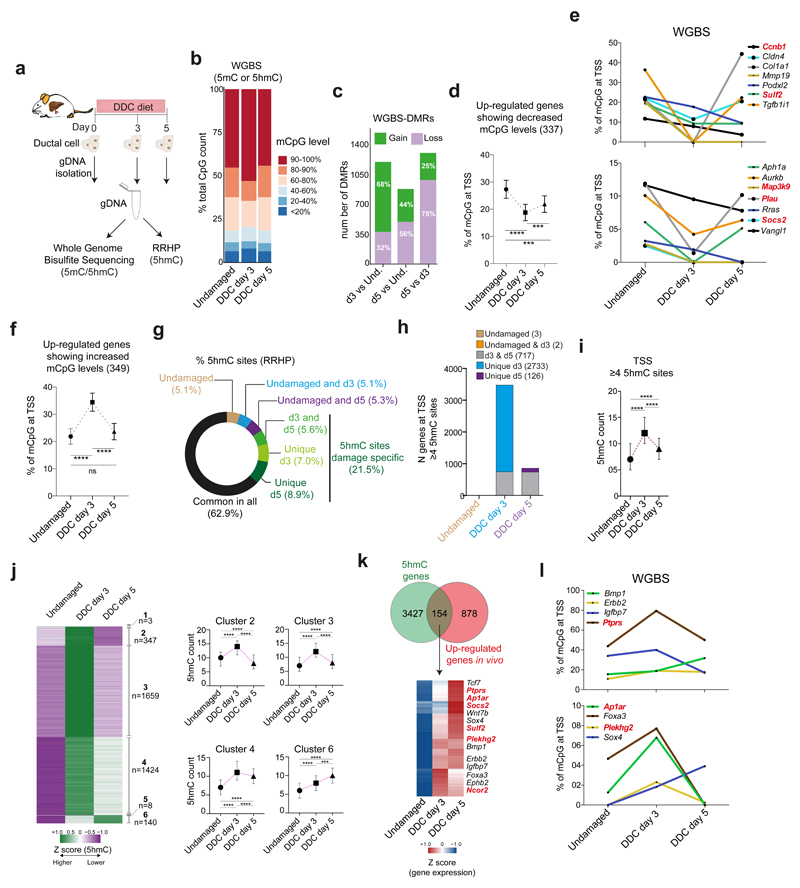
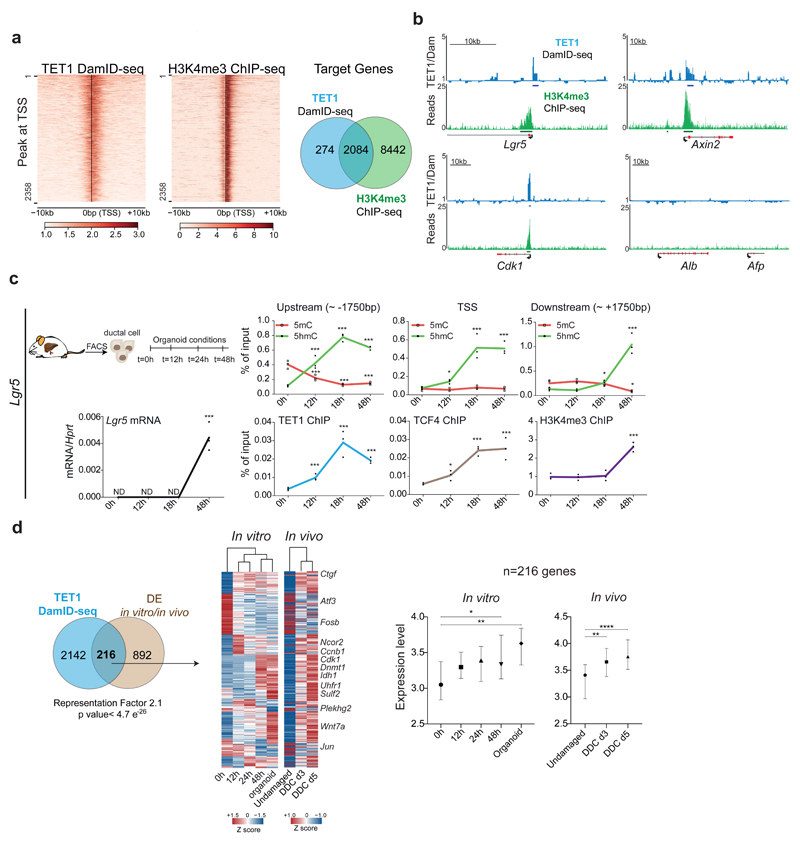
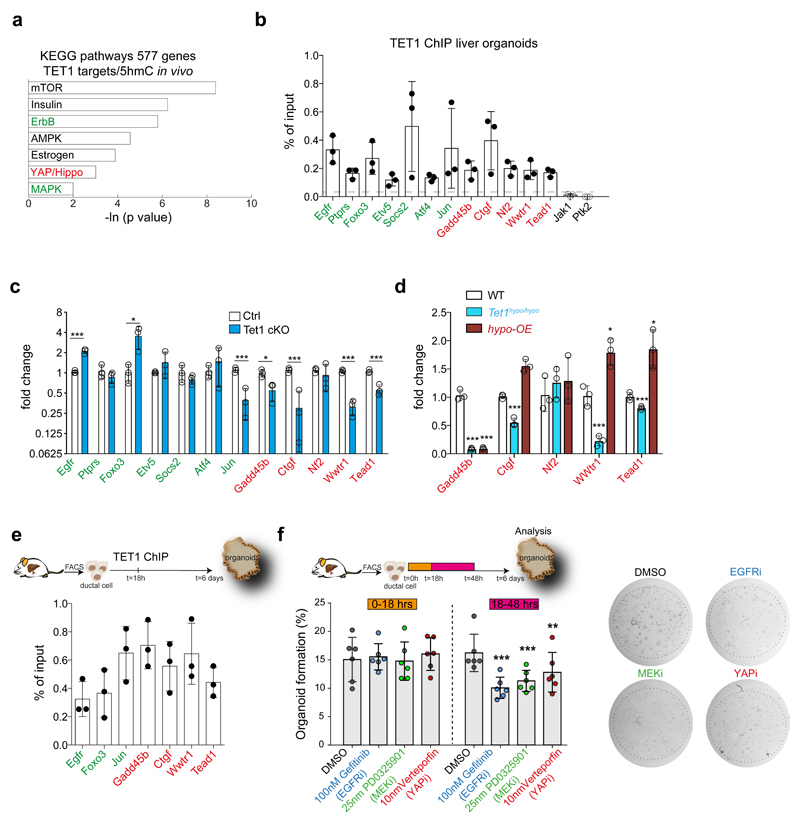
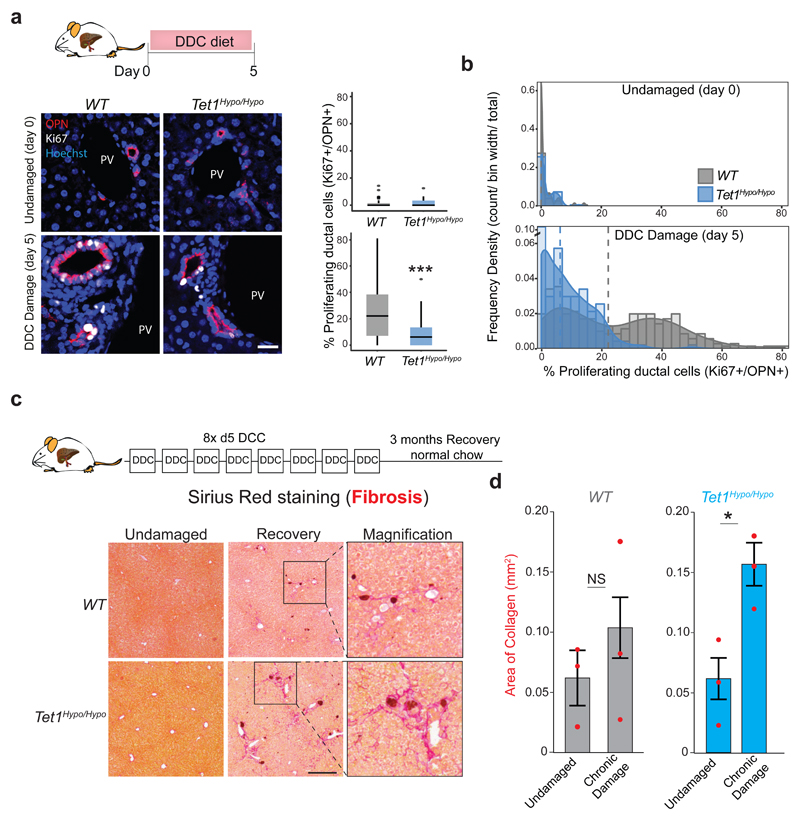
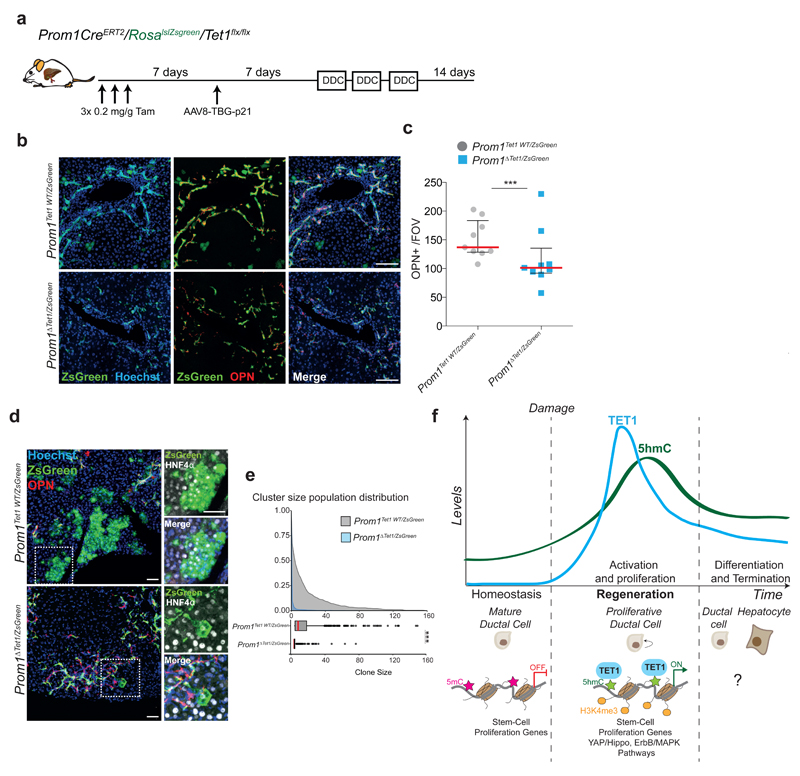
Following severe or chronic liver injury, adult ductal cells (cholangiocytes) contribute to regeneration by restoring both hepatocytes and cholangiocytes. We recently showed that ductal cells clonally expand as self-renewing liver organoids that retain their differentiation capacity into both hepatocytes and ductal cells. However, the molecular mechanisms by which adult ductal-committed cells acquire cellular plasticity, initiate organoids and regenerate the damaged tissue remain largely unknown. Here, we describe that ductal cells undergo a transient, genome-wide, remodelling of their transcriptome and epigenome during organoid initiation and in vivo following tissue damage. TET1-mediated hydroxymethylation licences differentiated ductal cells to initiate organoids and activate the regenerative programme through the transcriptional regulation of stem-cell genes and regenerative pathways including the YAP-Hippo signalling. Our results argue in favour of the remodelling of genomic methylome/hydroxymethylome landscapes as a general mechanism by which differentiated cells exit a committed state in response to tissue damage.


Conflict of interest statement

Authors declare no competing financial interests.

Figures

Extended Data Figure 1
Extended Data Figure 1. Non-proliferative EpCAM+ ductal cells initiate organoid cultures
a, EpCAM+ ductal cells were isolated from WT livers by FACS using a sequential gating strategy as follows: cells were gated for FSC and SSC and subsequently singlets were gated using FSC/Pulse width. Then, cells were negatively selected for PE/Cy7 (to exclude CD11b+, CD31+ and CD45+ cells) and positively selected for APC (EpCAM+) to obtain CD11b-/CD31-/CD45-/EpCAM+ ductal cells (EpCAM+ cells). These cells give rise to proliferative organoids with ~15% efficiency. Representative bright field pictures of 500 EpCAM+ and EpCAM- cells 6 days after seeding. Graph represents mean ±SD of n=3 independent experiments. b, RT-qPCR analysis of gene expression of the proliferation marker mKi67 (left) and stem-cell (Lgr5) and ductal (Epcam and Sox9) markers (right) at the indicated time points after seeding. Graphs represent the mean±SD of n= 3 independent experiments. p-value obtained using Student's two tailed t-test upon comparison to t= 0h. *, p<0.05; ***, p<0.001. c, Proliferation analysis. EdU (10μM) was incorporated to sorted EpCAM+ ductal cells at different intervals after seeding (0h, 24h and 48h, arrows) and evaluated by immunofluorescence analysis 24h after each incorporation. Representative images are shown. Scale bar, 10μm. Graph represents the percentage of EdU+ cells. Results are expressed as mean±SD cells from n= 3 independent experiments. Student's two tailed t-test statistical analyses were performed vs t=24h. *, p<0.05; **, p<0.01; ***, p<0.001
Extended Data Figure 2
Extended Data Figure 2. Transcriptional changes in ductal cells in vitro during liver organoid formation and in vivo upon damage
a-e, RNA-seq analysis of ductal cells isolated from adult livers (0h) and at different time points after culture. For DE genes, a pairwise approach with Wald test was performed on each gene using Sleuth. FDR <0.1 was selected as threshold. a, Graphs represent the number of significantly DE genes for each comparison. b, Hierarchical clustering analysis of epigenetic regulators found DE (383 out of 698 published in ref 49), in at least one comparison. Heatmap represents averaged TPM values scaled per gene. Results are presented as the averaged gene expression of ≥3 biological replicates. c-e, RNA-seq analysis of ductal cells isolated from adult livers (0h) and at day 3 and day 5 after liver damage (n=2 independent mice per time point). The heatmap shows 1552 genes DE at least in one comparison (TPM>5, FDR<0.1, |b|>0.58). Clustering analysis identified 5 different clusters (Clusters 1-5) according to the expression profile. Number of genes in each cluster is indicated in brackets. Results are presented as average of the at least 3 biological replicates. d, Graph represents the number of significant DE genes in the different comparisons. e, GO and statistical analyses of the 3 main clusters identified in c were perfomed using DAVID 6.8.
Extended Data Figure 3
Extended Data Figure 3. TET1 catalytic activity is required for liver organoid formation and maintenance
a, Tet1 and Lgr5 mRNA levels (n=3 mice). Student's two-tailed t-test statistical analyses were performed vs undamaged. b, Tet1 mRNA levels (24h after transfection) and organoid formation efficiency 10 days after Tet1 siRNA knock-down using 4 independent Tet1 siRNAs. Data is presented as percentage relative to siCtrl. Graph indicates mean±SD of n=3 independent experiments. Student's two-tailed t-test statistical analyses were performed vs siCtrl. c, Scheme of the two different Tet1 alleles used. d, Tet1 mRNA levels in WT, Tet1hypo/+ and Tet1hypo/hypo and Tet1 conditional knock-out (cKO) organoids presented as mean±SD of n=3 experiments. e, Representative Western blot image showing TET1 protein levels in WT, Tet1hypo/+ and Tet1hypo/hypo organoids (n=3 independent experiments). f, Organoid formation efficiency from FACS-sorted EpCAM+ cells derived from RosaCreERT2 x Tet1 flx/flx livers treated with 5μM hydroxytamoxifen (mean±SD of n=3 independent experiments). Student's two-tailed t-test statistical analyses were performed vs non-induced control. g, Whole mount immunofluorescence staining of 5hmC (green) on WT, Tet1hypo/hypo, hypo-OE and hypo-OEcat.mut. organoids. Representative images are shown (n=2 experiments). Scale bar, 50 μm. h, Graph represents organoid size at the indicated passages (mean±SD of n=3 independent experiments). Student's two tailed t-test statistical analyses were performed vs WT. i, Growth curves. j, Organoid formation efficiency at the indicated passage expressed as a percentage of organoids. Graphs represent mean±SD of n=3 independent experiments. Student's two tailed t-test statistical analyses were performed vs WT. k, Representative confocal images of Cleaved Caspase 3 whole mount immunostaining on WT, Tet1hypo/hypo, hypo-OE and hypo-OEcat.mut. organoids (n=2 independent experiments). Scale bar, 25μm.
Extended Data Figure 4
Extended Data Figure 4. WGBS of ductal cells upon damage uncovers a global epigenetic remodelling of the DNA methylome
a, Number of WGBS unique mapped reads in the different biological replicates. b, Bisulfite conversion rate. c-h, WGBS analyses were performed in merged biological replicates per time point (n=2). Only CpG sites with ≥3 reads were further analysed. c, CpG counts in merged biological replicates per time point. d, Genome-wide Spearman’s correlation score at the time points analysed shows dynamic CpG modifications. e, Functional localisation of DMRs. DMRs were called if the difference in cytosine modification between samples was ≥25% with a p-value of <0.05, using DSS software. f, Violin plot of the DMR length distribution (in base pairs) identified in the n=2 biological replicates. Lines and numbers, median. g, Density plot indicating the difference in mCpG levels for loss/gain DMRs for each comparison. h, Venn diagram showing the overlap between TET1 targets (see Figure 5) that are transcriptionally up-regulated and genes showing either loss (left) or gain (right) of mCpG at the TSS according to the WGBS analyses. Hierarchical clustering analyses of the overlapping genes are presented as heatmaps of TPMs scaled per gene (Z-score).
Extended Data Figure 5
Extended Data Figure 5. 5hmC levels increase in ductal cells in vitro andin vivo upon damage
a-c, EpCAM+ ductal cells sorted from 0.1% DDC livers (a), β1 integrin mutant mice fed with normal chow (undamaged) or DDC (b) or WT undamaged livers and grown as organoids (c). 5hmC fluorescence intensity was normalised to DAPI. Data are presented as violin plots of the ratio 5hmC/DAPI. Each dot represents the median value (shown in red) of cells counted/mouse (a, n=353 cells from 4 undamaged mice, n= 231 cells from 5 mice after 3 days of DDC, and n=392 cells from 5 mice at DDC d5; b, n=138 cells from undamaged, n=119 cells at day 1, n=247 at day 7 and n=125 at day 14 after returning the mice to normal chow (recovery); c, n=2500 (0h), n=900 (24h) and n=2000 (48h) cells from n=3 independent experiments. p-values were calculated using pairwise comparisons with Wilcoxon rank sum test. a, d3 vs d0 p= 1x10-13 ; d5 vs d0 p< 2.2x10⁻¹⁶. c, 0h vs 24h p< 2.2x10⁻¹⁶ ; 48h vs 0h p< 2.2x10⁻¹⁶. Scale bar, 10μm. d, All 5hmC sites identified by RRHP. e, Number of genes associated to TSS showing differential 5hmC levels. The number of CpG sites (n) with unique gain of hydroxymethylation is shown. f, Graphs represent distribution of percentage of mCpG identified by WGBS in CGI outside TSS (n=32673) using the average of the 2 independent samples (violin plots, black lines median, left) and number of 5hmC counts (median±IQR) in CGI outside TSS (n= 25579) (right) (n=2 independent samples). g, GO and statistical analyses of the clusters identified in Fig. 4j were performed using DAVID 6.8. Heatmap shows the expression profile of the 84 overlapping genes and is presented as averaged Z score of (n=2)
Extended Data Figure 6
Extended Data Figure 6. TET1 regulates actively transcribed genes in liver organoids
a-d, DamID-sequencing was performed in EpCAM+ sorted ductal cells derived from already established liver organoids (n=3 independent experiment). Only TET1-Dam peaks identified in all 3 experiments were considered for futher analyses. a, Scheme of DamID-seq protocol. b, Heatmaps showing TET1 peaks identified by DamID-seq (left panels) and H3K4me3 peaks identified by ChIP-seq (right panels). Heatmaps are centred in the middle of the peak (0) and show a genomic window of ±10kb. Top heatmaps represent common peaks between TET1 and H3K4me3 (2848 peaks) while bottom heatmaps represent TET1-specific peaks (2254 peaks). c, Pie-chart indicates the percentage of genomic distribution of TET1-Dam peaks. d, GO and statistical analyses of biological processes among TET1-Dam targets in liver organoids were performed using DAVID 6.8. n, number of genes. e, 5hmC and 5mC levels determined by MeDIP and hMeDIP followed by qPCR on the indicated genomic region surrounding Lgr5 TSS in WT (black), Tet1hypo/hypo (blue) and hypo-OE (red) organoids. Graphs represent mean±SD of n=3 independent experiments. Student's two tailed was performed comparing samples to WT. *, p<0.05; ** =p <0.01 f, TET1 ChIP-qPCR at Lgr5 TSS (left panel) and Lgr5 mRNA levels (right panel) in WT, Tet1hypo/hypo and hypo-OE organoids. Graphs represent mean±SD of 3 independent experiments. Student's two tailed t-test statistical analyses were performed vs WT. **, p <0.01 g, Sorted EpCAM+ cells from WT livers were cultured in organoid medium and harvested for DNA, chromatin and mRNA expression analyses at the indicated time points. Graphs represent mean±SD of 3 independent experiments. Student's two tailed t-test analyses were performed vs t=0h *, p<0.05; ** =p <0.01; *** =p <0.001
Extended Data Figure 7
Extended Data Figure 7. Treatment with Rapamycin impairs organoid formation
a, EpCAM+ ductal cells freshly isolated from the undamaged liver were treated at 0-18hrs or 18-48hrs with the indicated small molecule inhibitors. Organoid formation was quantified at day 6. Graph represents organoid formation efficiency and indicates mean ±SD of n=3 independent experiments. Statistical analyses were performed with two-ways ANOVA with Bonferroni’s multiple compared test (vs DMSO control group). DMSO control quantifications are shown in Fig. 6f. Representative pictures of organoids treated with the inhibitors at 18-48hrs are shown.
Extended Data Figure 8
Extended Data Figure 8. TET1 hypomorphic mice present a significantly impaired ductal regeneration upon damage.
a, Graph represents mean ±SD of mouse weight of WT (n=21 mice), Tet1hypo/+ (n=13 mice) and Tet1hypo/hypo (n=27 mice) littermates. Student's two tailed t-test statistical analyses were performed. b, Relative mouse weight of WT (n=5), Tet1hypo/+ (n=1) and Tet1hypo/hypo (n=5) mice. c, Representative H&E stainings (n=3 experiments) of intestines from 50 week old WT and Tet1hypo/hypo mice. Scale bar, 100μm. . d, Representative H&E stainings (n=3 experiments) of small intestine from 10 week old WT and Tet1hypo/hypo mice treated with DDC for 5 days. Scale bar, 100μm. e-f, Box-and-whisker plots showing median and IQR of proliferating ductal cells (OPN+/Ki67+) (e) or total ductal cells (OPN+) (f). Undamaged, n=3 WT and n=3 Tet1hypo/hypo ; DDC, n=7 WT and n=6 Tet1hypo/hypo ; Recovery, n=3 WT and n=4 Tet1hypo/hypo). Dots, outliers. Squares, median level corresponding to each independent mice. p-values obtained by two-sided Kolmogorov-Smirnov test. g, Population distribution of the total number of ductal cells (OPN+) Dashed lines show median values obtained from 55 FOV (n=3) for WT and 56 FOV for Tet1hypo/hypo (n=3) mice at day 0 (undamaged) and 110 FOV for WT (n=3) and 153 FOV for Tet1hypo/hypo (n=4) mice at day 12 (recovery). h, PCK immunohistochemistry (n=3 experiments) from WT (left) and Tet1hypo/hypo (right) undamaged or in recovery after DDC (day 12) livers. Nucleus, Haematoxylin. Scale bar, 100μm. i, Lgr5 and Tet1 mRNA levels, TET1 ChIP and hMedIP on Lgr5 TSS were analysed in undamaged and DDC treated livers. Graphs represent mean±SD of values obtained from n=3 independent biological replicates (dot). p-value was calculated using Student's two-tailed t-test.
Extended Data Figure 9
Extended Data Figure 9. Ductal specific Tet1 conditional deletion impairs duct-mediated liver regeneration
a, Schematic of the Prom1CreERT2/RosalslZsGreen/Tet1flx/flx mouse model. b, Representative immunofluorescence analysis (OPN+ red, ZsGreen+, green) of Prom1ΔTet1/ZsGreen and Prom1Tet1WT/ZsGreen upon tamoxifen treatment and injection of AAV8-TBG p21 (n=2 mice per genotype). Nucleus, Hoechst. Scale bar, 50 μm c, Representative immunofluorescence analysis of livers from Prom1Tet1WT/ ZsGreen mice injected with AAV8-TBG p21 not receiving tamoxifen treatment (n=2 mice per genotype). Scale bar, 100 μm. d, Tet1 expression in EpCAM+/ZsGreen+ ductal cells isolated by FACS from Prom1ΔTet1/ZsGreen (n=4) or Prom1Tet/ZsGreen (n=4) livers derived from mice treated for 3-cycles of DDC and collected 12 days after damage. Graph represents the expression of Tet1 for both genotypes expressed as a fold change compared to Prom1Tet1WT. Student's two tailed t-test statistical analyses were performed. ***, p<0.001. e, Representative pictures of P21 immunohistochemistry analyses. Scale bar, 200 μm. f, Weight curves of mice undergoing AAV8-TBG-p21 injection followed by DDC treatment (mean± 95%CI). g, TET1 ChIP-qPCR analyses on target genes in ZsGreen+/EpCAM+ ductal cells isolated from Prom1Tet1WT/ZsGreen DDC-treated livers for 5 days. Cells isolated from 3 mice littermates were pooled used for each independent experiment (n=2). ND, not detected. h, Graph represents mean ±SD of mRNA expression of Tet1 and selected target genes (fold change vs WT undamaged) in EpCAM+ ductal cells isolated from undamaged (n=2 per genotype) or day 5 DDC-treated livers (n=3 per genotype) derived from Prom1Tet1WT/ZsGreen (grey) or Prom1ΔTet1/ZsGreen (blue) mice. Statistical analysis was performed using Student's two-tailed t-test compared to the Prom1Tet1WT/ZsGreen value at the corresponding time point.
Fig. 1
Fig. 1. G1/G0 arrested liver ductal cells require ~48h to start cell proliferation and initiate liver organoids cultures
R26Fucci2a mice constitutively express a bi-cistronic cell-cycle reporter that allows discriminating between G1/G0 [Cherry-hCdt1+ (30/120), red] and S/G2/M [Venus-hGem+, (1/110) green] phases of the cell cycle. a, Experimental approach b, EpCAM+ liver ductal cells from R26Fucci2a mice were FACS-sorted according to the expression of mCherry-hCdt1 (C) and/or mVenus-hGem (V). The graph represents percentage of EpCAM+ cells positive for mCherry and/or mVenus. Each dot represents an independent experiment from an independent mouse (n=3). Graph is presented as mean±SD of 3 independent experiments. c, Representative bright field images of 500 C+/V- EpCAM+ and C-/V- EpCAM+ cells cultured for 6 days as liver organoids. The graph represents mean±SD of organoid formation efficiency (n=3 experiments). **, p-value (p=0.001413095) was calculated using Student's two tailed t-test. **, p<0.01. d, Still images from a representative movie of C+/V- EpCAM+ ductal cells monitored for 72h using a spinning-disk confocal microscope. Scale bars, 10μm. e, Graph represents G0/G1 length for the first (I) and second (II) cell cycles since t=0h (isolation) of 34 cells (n=3 independent experiments). Global mean of G0/G1 length is shown (G0O/G1 I = 37.97h hours; G0O/G1 II = 10.20h hours). h, hours.
Fig. 2
Fig. 2. Liver ductal cells undergo genome-wide changes in their transcriptional landscape during organoid initiation and in vivo upon damage
a-e, Expression analysis of ductal cells during organoid initiation. a, Experimental Scheme. Graph represents DE genes (pairwise approach with Wald test performed using Sleuth. Threshold FDR <0.1) b, Hierarchical clustering of all 7580 DE genes. Heatmap represents averaged TPM values of biological replicates (0h n=3; 12h n=4; 24h n=3; 48h n=3; organoid n=3) scaled per gene (Z-score). Number in bold, cluster. n, number of genes/cluster. c, GO and statistical analyses were performed using DAVID 6.8. Red, cluster containing DE genes at 12h and 24h. d, Heatmaps representing averaged Z-score of indicated genes. e, Graphs represent mean±SD of n=6 independent RT-qPCR experiments. Independent experimental data are listed in Source Data. Data are presented as fold-change compared to t=0h. p-value is calculated using two-way ANOVA combined with Tukey HSD test. p-value of comparisons vs t=0 are shown. **, p<0.01; ***, p<0.001. Exact p-values are provided in Source Data. f-i, Expression analysis of ductal cells following liver damage by supplementing the diet with 0.1% DDC (see methods). f, Experimental scheme. g, Immunofluorescence analysis of ductal cell proliferation upon damage. Representative images are shown (n=3 experiments). Scale bar, 50μm. Graph represents mean±SD of proliferating ductal cells (undamaged n=3, DDC d2 n=3, d3 n=4, d5 n=4). p-values were calculated vs undamaged using pairwise comparisons with Wilcoxon rank sum test (DDC d3 p= 0.01201; DDC d5 p= 7.6E-05). *, p<0.05; ***, p<0.001. h, RNA sequencing analysis of sorted EpCAM+ ductal cells isolated from undamaged or DDC-treated livers (day 3 and 5, n=2 per time point). Venn diagram, overlap between DE genes in vitro and in vivo. p-value is calculated using normal approximation of the hypergeometric probability. Table indicates the GO analysis (top 3 significant categories) of the 7 clusters identified in i and their p-values obtained with DAVID 6.8. i, Heatmap (averaged Z score) of the hierarchical clustering of the 1108 DE genes based on the in vitro expression profile. Number in bold, cluster. n, number of genes/cluster.
Fig. 3
Fig. 3. TET1 catalytic activity is required for liver organoid initiation and maintenance
a, FACS-sorted EpCAM+ ductal cells freshly isolated from WT undamaged livers were transfected with a pool of siRNAs, each of them targeting specifically a selected epigenetic modifier, and organoid formation efficiency was evaluated 10 days later. Results are shown as percentage of organoid formation efficiency compared to mock transfected cells. The graph represents mean±SD of n=3 independent experiments (dots). p-values were calculated using one-way ANOVA in conjunction with Tukey’s HSD test by comparison to siCtrl. *, p= 0.01031057 siTet1 vs siCtrl,. b, FACS-sorted EpCAM+ ductal cells derived from RosaCreERT2 x Tet1flx/flx mouse livers were plated in organoid isolation medium supplemented with 5μM hydroxytamoxifen or vehicle and organoid formation efficiency was evaluated 6 days later. Representative bright field images are shown. Data are reported as percentage of organoid formation compared to Cre-Tam- cells. Graphs represent mean±SD of n=3 independent experiments. p-value was calculated using Student's two-tailed t-test vs Cre-Tam- (*, Cre-Tam+ p=0.03781815; ***, Cre+Tam+ p=4.812E-05). c-e, EpCAM+ ductal cells isolated from Tet1 hypomorphic mice were used to generate liver organoids (Tet1hypo/hypo, blue) or were transfected with a hTET1 full length cDNA (hypo-OE organoids, red) or catalytically inactive hTET1 H1671Y/D1673A (hypo-OEcat.mut. organoids, turquoise). Organoids derived from WT littermates were used as controls (black). c, Scheme indicates the lines generated. d, Western blot analysis of TET1 protein levels. The graph represents TET1 levels. Complete blot is shown in data source. Results are presented as mean±SD of n=3 independent experiments (dot). **, p-value calculated using Student's two-tailed t-test vs WT (Tet1hypo/hypo p=0.006779543). e, Representative bright field images of WT (n=2), Tet1hypo/hypo(n=4) hypo-OE (n=1) and hypo-OEcat.mut. (n=1) organoid lines at passage 3. Graph indicates passage number.
Fig. 4
Fig. 4. Liver ductal cells undergo global remodelling of DNA methylation and hydroxymethylation landscapes in vivo upon damage
a-l, gDNA from undamaged or DDC-damaged livers was split in two fractions and prepared for WGBS (a-f) or RRHP (g-l) (n=2 mice per time point). a, Experimental design. b, Graph shows the percentage of modified CpG (mCpG) sites according to different level categories (average of replicates). c, Number of differentially methylated/hydroxymethylated regions (DMRs) present in the n=2 biological replicates. DMR were called based on a modification difference ≥25%, p<0.05 (see methods). d-e, Graphs (mean±95%CI) represent percentage of modified cytosines at TSS for all 337 up-regulated genes (d) or selected ones (e) showing decreased mCpG levels at d3 (average of replicates). p-value was obtained by Kruskal Wallis test with Dunns multiple comparison. ****, undamaged vs d3 p<0.0001, ***, undamaged vs d5 p=0.0003, d3 vs d5 p=0.0004. TET1 targets (see Figure 5) are represented in bold red. f, Graph represents all 349 up-regulated genes after damage presenting increased mCpG level at TSS (mean ±95% CI). p-value was obtained by Kruskal Wallis test with Dunns multiple comparison. ****, undamaged vs d3 p<0.0001, undamaged vs d5 p=0.3773, d3 vs d5 p<0.0001. g, Distribution of total 5hmC sites identified. h, Number of genes showing ≥4 5hmC sites around their TSS. i, Graph represents median±IQR of 5hmC counts from the 3581 genes differentially hydroxymethylated. p-value was obtained using Kruskal Wallis test coupled with Dunn’s multiple comparison. All p-values are <0.0001. ****, p<0.0001 j, The heatmap represents the z-score values of 5hmC absolute count. 5hmC levels were classified into 6 clusters. n, number of genes/cluster. Graphs (median±IQR) represent the number of 5hmC counts of differentially hydroxymethylated genes. p-value was obtained by Kruskal Wallis test with Dunns multiple comparison. All p-values correspond to p<0.0001 (****), except for ***, p=0.0009. k, Heatmap represents Z-score of the 154 overlapping genes. l, Graph represents the levels of mCpG from the 154 genes identified in k averaged for the 2 biological replicates. In k-l, TET1 targets (see Figure 5) are represented in bold red.
Fig. 5
Fig. 5. TET1 regulates the activation of genes involved in organoid formation and liver regeneration
a-b, TET1-DamID analyses were performed in n=3 independent experiments. a, Heatmaps of TET1-DamID (left) and H3K4me3 (right) binding at the TSS Venn diagram indicates the overlap between the DamID-seq TET1 and H3K4me3 target genes identified by ChIP-seq. b, Genome tracks of TET1 (Dam-ID) and H3K4me3 (ChIP) peaks on selected genes. Graphs show TET1-Dam/Dam only ratio (blue) and H3K4me3 number of reads (green). c, Sorted EpCAM+ cells from WT undamaged livers were cultured as organoids and analysed at the indicated time points (n=3 experiments). Upper panels: hMeDIP (dots, green) and MeDIP (squares, red) levels in the indicated genomic region upstream and downstream of the Lgr5 TSS. Lower panels: TET1 (blue), TCF4 (brown) and H3K4me3 (purple) ChIP-qPCR at the TSS. mRNA expression is shown in black. p-value was obtained using Student's two-tailed t-test. Statistical analyses were performed vs t=0h. (Upstream 5hmC 12h p=0.004305136, 18h, p=3.26345E-05, 48h p=8.36527E-06; 5mC 12h p=0.009532377, 18h, p=0.001130234, 48h p=0.001564496; TSS 5hmC 12h p=0.011044339, 18h, p=0.005230947, 48h p=0.000485153; Downstream 5hmC 18h, p=0.004305136, 48h p=3.26345E-05; 5mC 48h p=8.36527E-06; Lgr5 mRNA 48h p=0.001991489; TET1 ChIP 12h p=0.005403182, 18h, p=0.003789515, 48h p=0.000119801; H3K4me3 ChIP 48h p= 0.000774002). *, p<0.05; **, p <0.01***; p <0.001. d, Overlap between the 1108 DE genes identified in Fig. 2h-i and TET1 targets identified by DamID-seq. p-value of the overlap is calculated using normal approximation of the hypergeometric probability. The heatmap (TPM, z-scored) presents the expression profile of the 216 TET1 targets DE in vivo and in vitro. Graphs show the gene expression levels of 216 genes (median±95% CI) as ln(TPM +1). p-values are obtained with one-way ANOVA followed by Tukey’s multiple comparisons test. 0h vs 48h p=0.0379, 0h vs Org p=0.0039; Und vs d3 p=0.0013, Und vs d5 p<0.0001.*, p< 0.05; **, p <0.01; ***, p <0.001.
Fig. 6
Fig. 6. Tet1 regulates YAP/Hippo and ErbB, MAPK signalling pathways
a, KEGG pathway enrichment and statistical analyses on the genes identified as TET1-DamID targets in liver organoids (n=3) and showing differential levels of 5hmC in vivo from RRHP using DAVID 6.8. b, TET1 ChIP-qPCRs in liver organoids. Data are reported as percentage of input. Graph represents mean ±SD of n=3 independent experiments. c, mRNA expression levels of selected TET1 targets in WT or RosaCreERT2 x Tet1flx/flx organoids both treated with 5μM tamoxifen for 24hrs. Cells were harvested 24hrs after tamoxifen treatment. Data are reported as fold change compared to Ctrl. Graph represents mean±SD of n=3 independent experiments. p-value obtained using Student's two tailed t-test upon comparison to Ctrl. Egfr, p= 0.000479886; Foxo3, p= 0.031392276; Jun, p= 0.004319905; Gadd45b, p= 0.023554286; Ctgf, p= 0.005333732; Wwtr1, p= 0.000230442; Tead1, p= 0.002322422. *, p<0.05; **, p<0.01; ***, p<0.001. d, mRNA expression levels of YAP/Hippo TET1 targets in TET1hypo/hypo organoids and TET1hypo-OE organoids. Graph represents mean±SD of n=3 independent experiments. p-value obtained using Student's two tailed t-test upon comparison to WT. Gadd45b, TET1hypo/hypo p= 6.00424E-05; TET1hypo-OE p= 6.24089E-05. Ctgf, Tet1hypo/hypo p= 0.000677729; TET1hypo-OE p= 0.001247481. Wwtr1, TET1hypo/hypo p= 0.002222631; TET1hypo-OE p= 0.010861863. Tead1, TET1hypo/hypo p= 0.009343297; TET1hypo-OE p= 0.013645094. *, p<0.05; **, p<0.01; ***, p<0.001 e, TET1 ChIP-qPCRs in EpCAM+ FACS-sorted cells grown in organoid conditions for 18hrs. Data are reported as percentage of input. Graph represents mean ±SD of n=3 independent experiments. f, EpCAM+ ductal cells freshly isolated from undamaged livers were treated at 0-18hrs or 18-48hrs with the small molecule inhibitors as indicated. Organoid formation was quantified at day 6. Graph represents organoid formation efficiency and indicates mean ±SD of n=6 independent experiments. Statistical analyses were performed with two-ways ANOVA with Bonferroni’s multiple compared test vs DMSO control group. 18-48hrs Gefitinib, p<0.0001; PD0325901 p<0.0001; Verteporfin, p=0.0039. **, p<0.01; ***, p<0.001. Representative pictures of organoids are shown.
Fig. 7
Fig. 7. Tet1 hypomorphic mice exhibit reduced ductal regeneration and extensive fibrosis upon damage
a-b, WT (grey) and Tet1hypo/hypo mice (blue) were fed normal chow or a chow supplemented with 0.1% DDC for 5 days. Individual values of independent experiments are shown in Extended Data Figure 8f. a, Representative images of immunofluorescence staining for the ductal marker OPN (red) and the proliferation marker Ki67 (white). Scale bar, 25μm. PV, portal vein. Graphs represent the percentage of proliferating (Ki67+) ductal cells (OPN+) (median±IQR) obtained from 55 FOV for WT (n=3) and 56 FOV for Tet1hypo/hypo mice (n=3) at day 0 (undamaged), and 253 FOV for WT (n=7) and 169 FOV for Tet1hypo/hypo (n=6) at day5 of DDC damage. Data are represented a boxplots showing the median, IQR and overall range. Dots represent outliers from a single counted FOV defined as >1.5 IQR above or below the median. p-values were obtained using two-sided KolmogoroV-Smirnov test. ***, p< 2.2x10⁻¹⁶. b, Histogram showing the population distribution of proliferating ductal cells (OPN+, Ki67+) by plotting frequency density of counts across the sample range (bar) and the kernel density estimate line. Dashed lines show median values. c-d, WT (grey) and Tet1hypo/hypo (blue) mice were fed normal chow or a chow supplemented with 0.1% DDC for 5 days for 8 consecutive cycles as described in the scheme and methods. Liver tissues were collected 3 months after the last cycle and PicroSirius red staining was performed to analyse the levels of fibrosis (collagen deposition). c, Representative images of PicroSirius red staining (red) (n=3 mice per time point). Scale bar, 200μm. d, Graph represents mean±95% CI of the area of collagen deposition per FOV (n=3 mice per time point per genotype). Statistical analysis was performed on the 3 mean values per genotype compared to undamaged using Student's two-tailed t-test. *, p<0.05.
Fig. 8
Fig. 8. Ductal specific TET1 depletion results in impaired hepatocyte regeneration
a, Experimental Scheme. b, Representative images of 10μm liver sections showing ZsGreen+ ductal cells (OPN+) (n=9 per genotype). Scale bar, 50μm c, Graph showing median±IQR of average OPN+ cells per FOV for each individual mouse (n=9 per genotype). Global median level is highlighted in red. p-value was calculated using Wilcoxon rank sum test.*, p= 0.03768. d, Representative images of 50μm frozen liver sections showing regenerative clusters of ZsGreen+ hepatocytes (HNF4a+) and ductal cells (OPN+). Scale bar, 50μm. e, Cumulative relative frequency plots (top graph) and corresponding box plots (bottom graph) showing median (red), upper and lower quartiles and the range (dots represent outliers) of ZsGreen+ hepatocyte cluster size of Prom1Tet1WT/ZsGreen (n=3) and Prom1ΔTet1/ZsGreen (n=6) mice. p-value was determined by two sided KolomogoroV-Smirnov test. ***, p< 2.2x10⁻¹⁶. f, Experimental model.

References

    1. Choi TY, Ninov N, Stainier DY, Shin D. Extensive conversion of hepatic biliary epithelial cells to hepatocytes after near total loss of hepatocytes in zebrafish. Gastroenterology. 2014;146:776–788. doi: 10.1053/j.gastro.2013.10.019. - DOI - PMC - PubMed
    1. Russell JO, et al. Hepatocyte-specific beta-catenin deletion during severe liver injury provokes cholangiocytes to differentiate into hepatocytes. Hepatology. 2018 doi: 10.1002/hep.30270. - DOI - PMC - PubMed
    1. Espanol-Suner R, et al. Liver progenitor cells yield functional hepatocytes in response to chronic liver injury in mice. Gastroenterology. 2012;143:1564–1575 e1567. doi: 10.1053/j.gastro.2012.08.024. - DOI - PubMed
    1. Huch M, et al. In vitro expansion of single Lgr5+ liver stem cells induced by Wnt-driven regeneration. Nature. 2013;494:247–250. doi: 10.1038/nature11826. - DOI - PMC - PubMed
    1. Lu WY, et al. Hepatic progenitor cells of biliary origin with liver repopulation capacity. Nat Cell Biol. 2015;17:971–983. doi: 10.1038/ncb3203. - DOI - PMC - PubMed

Publication types

MeSH terms