. 2020 Jan;5(1):116-125.
doi: 10.1038/s41564-019-0591-6. Epub 2019 Nov 4.

Dietary L-serine confers a competitive fitness advantage to Enterobacteriaceae in the inflamed gut

Affiliations

Dietary L-serine confers a competitive fitness advantage to Enterobacteriaceae in the inflamed gut

Sho Kitamoto et al. Nat Microbiol. 2020 Jan.

Abstract

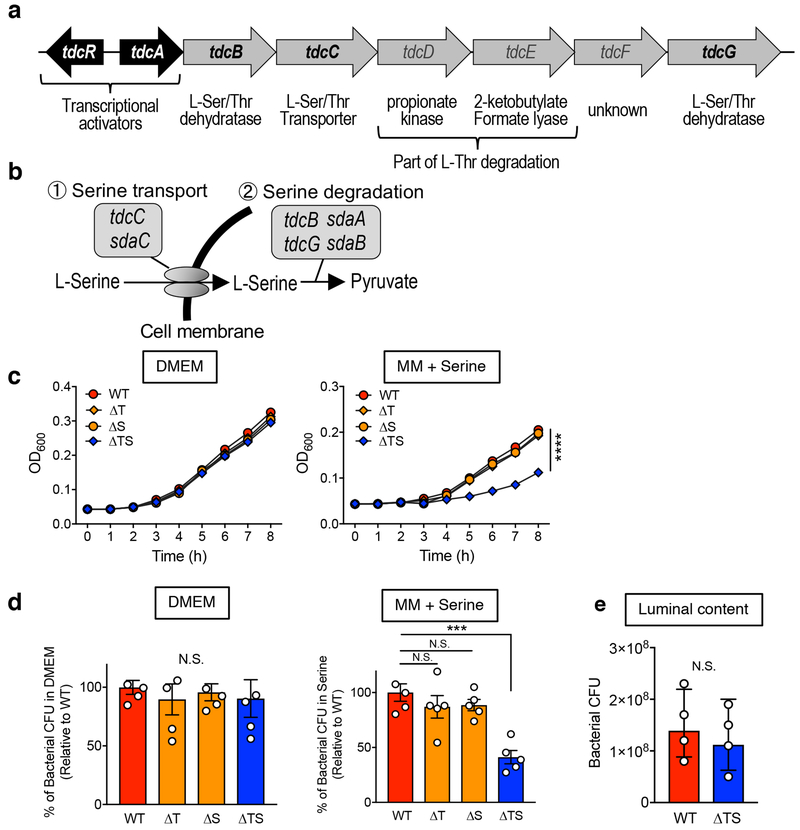
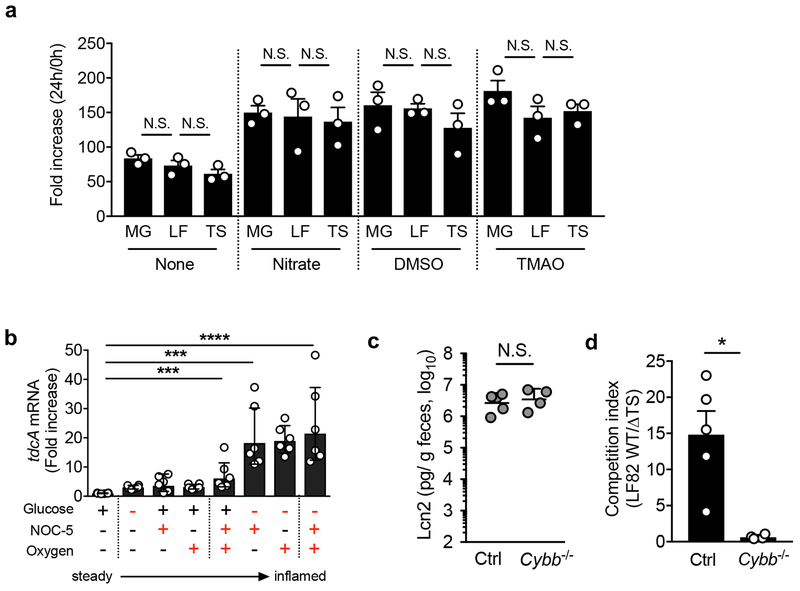
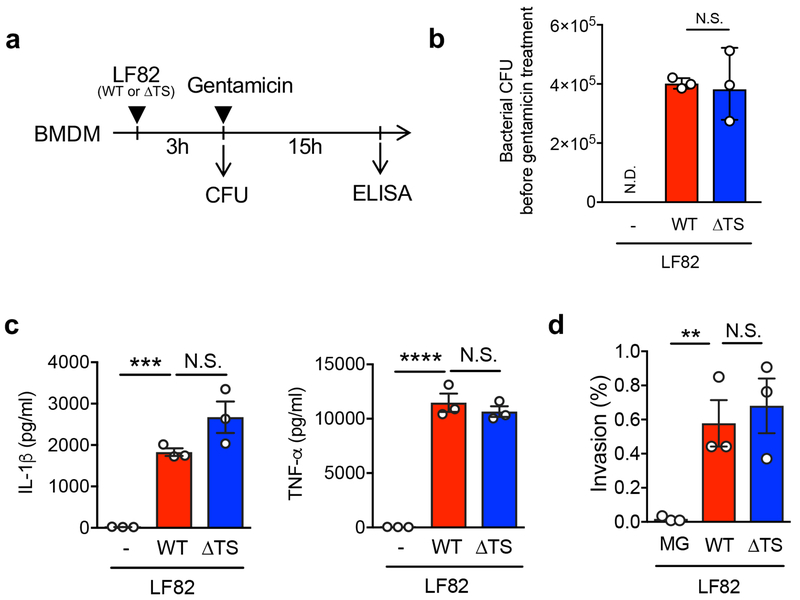
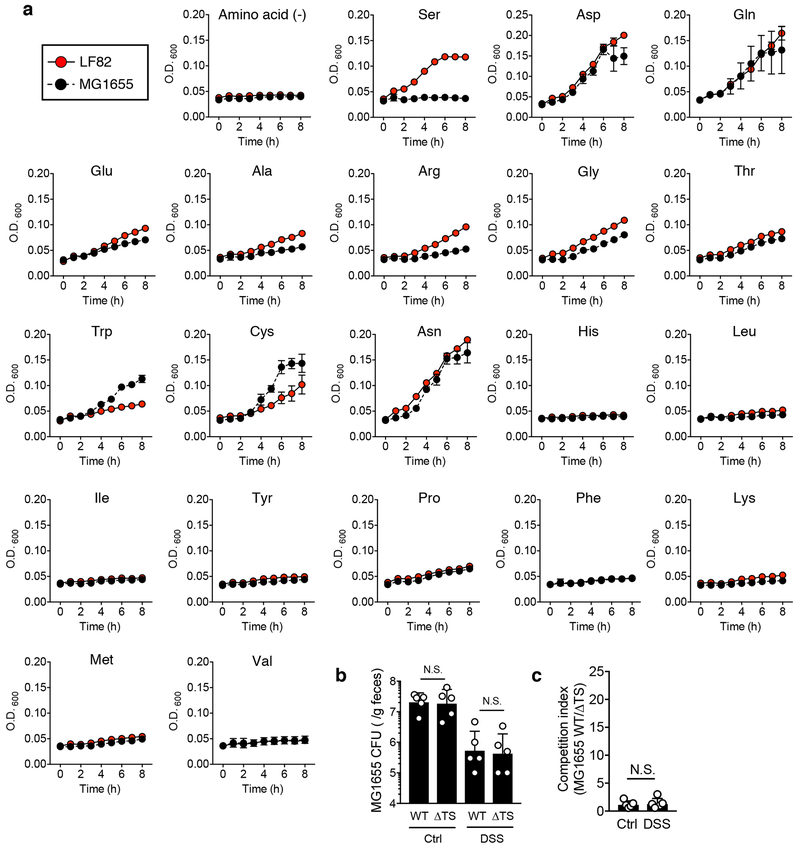
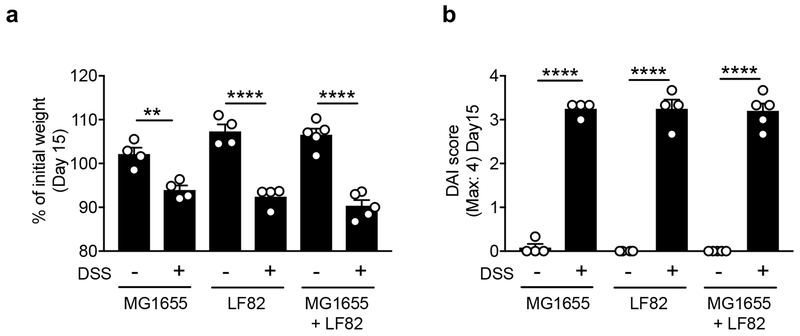
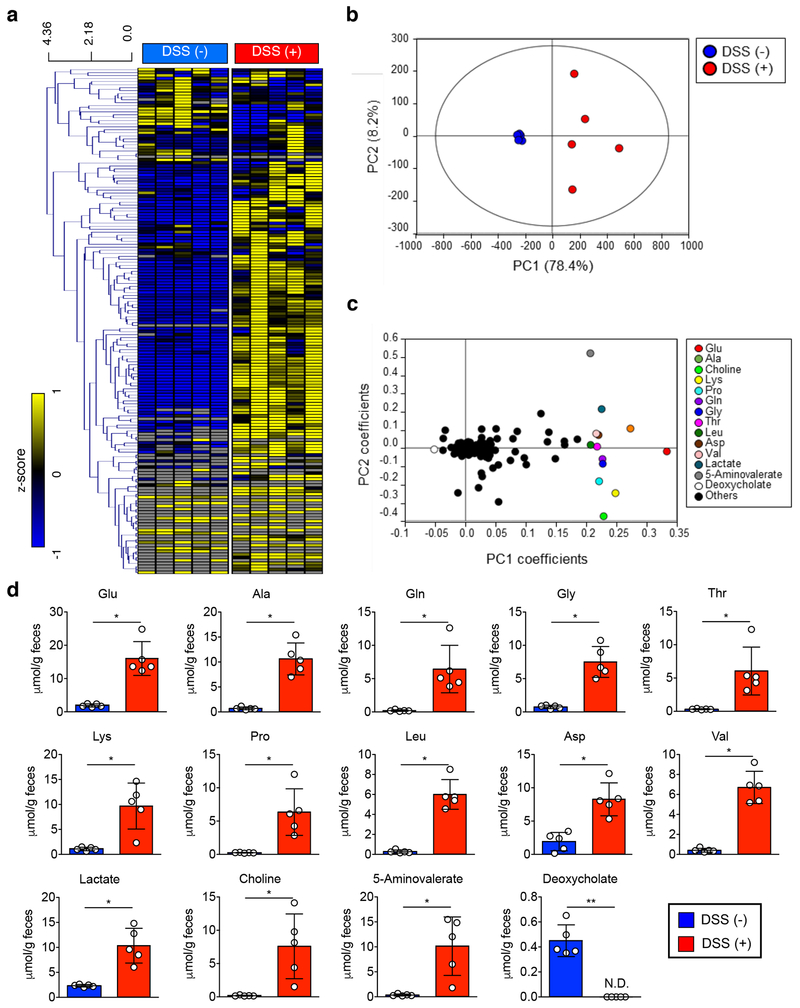
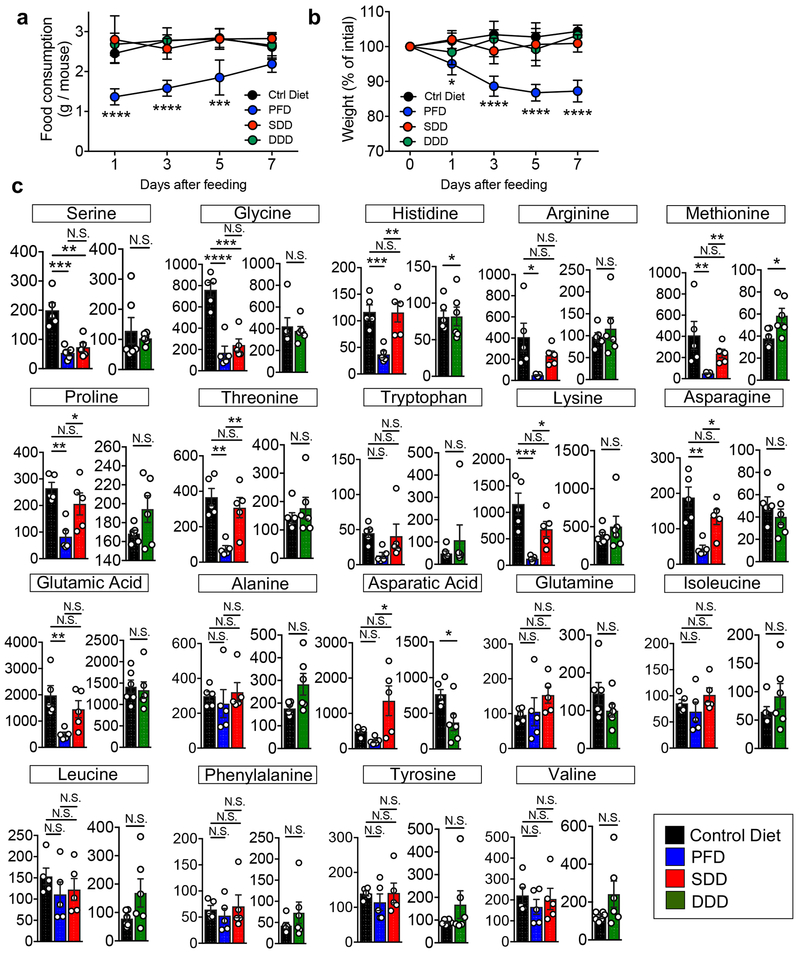
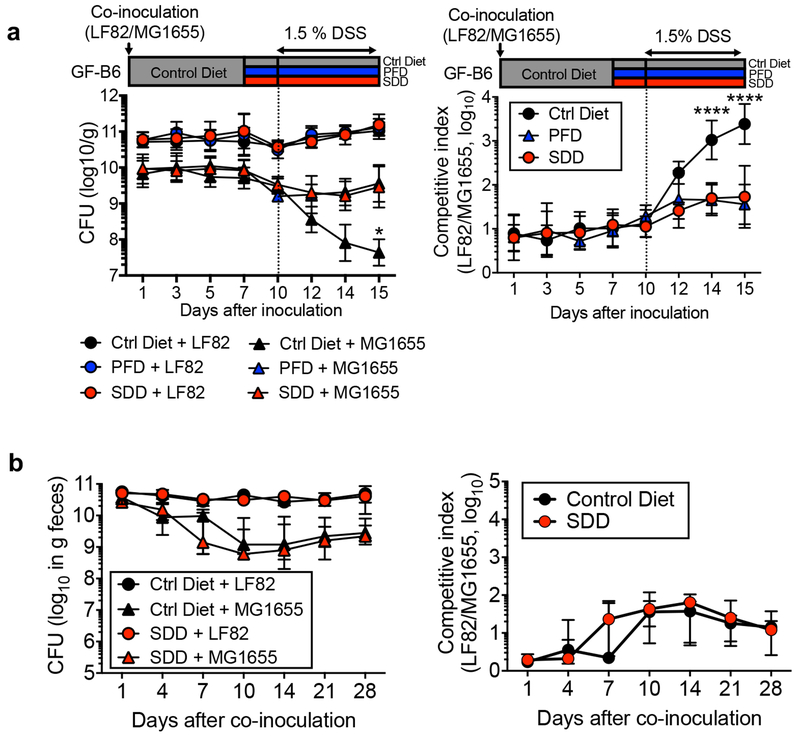
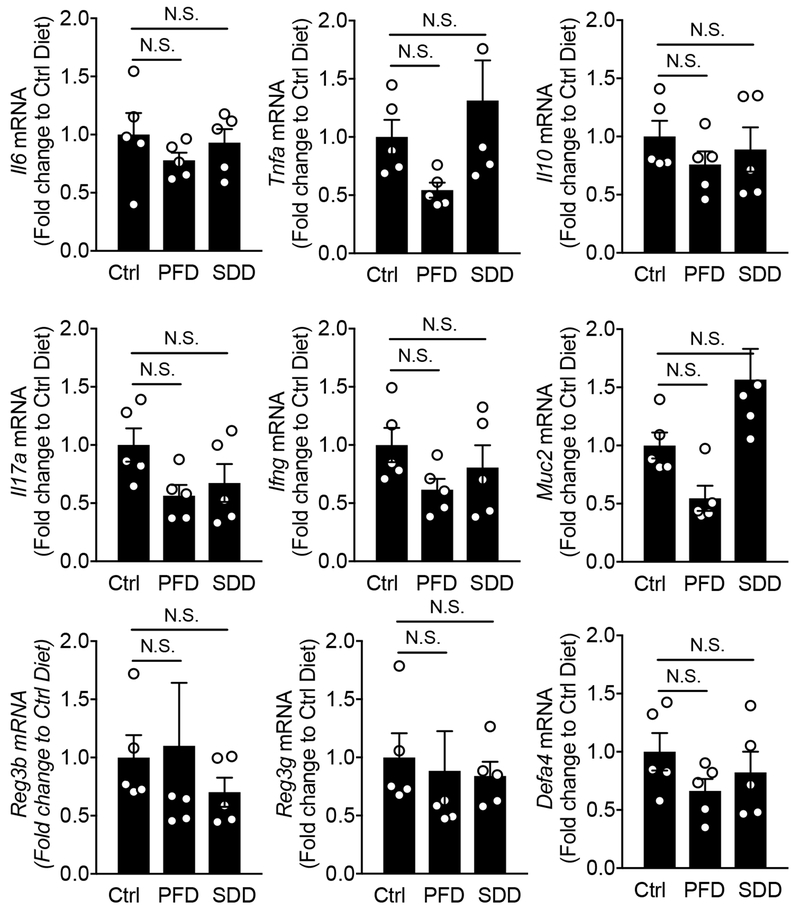
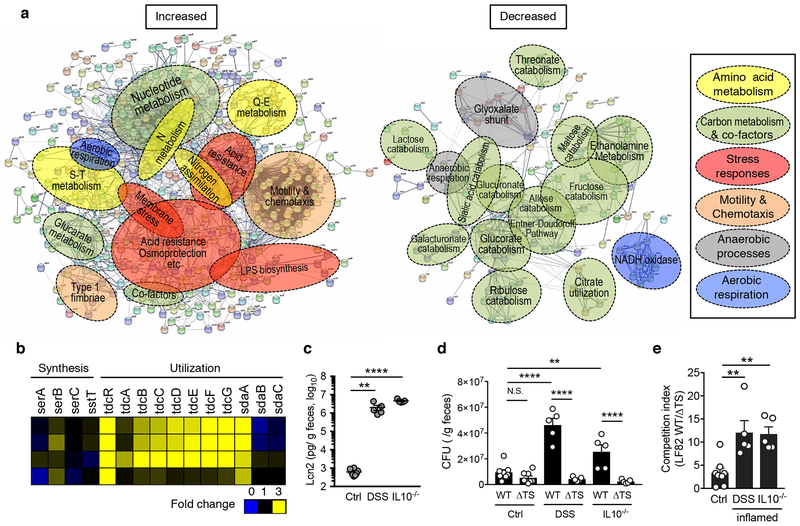
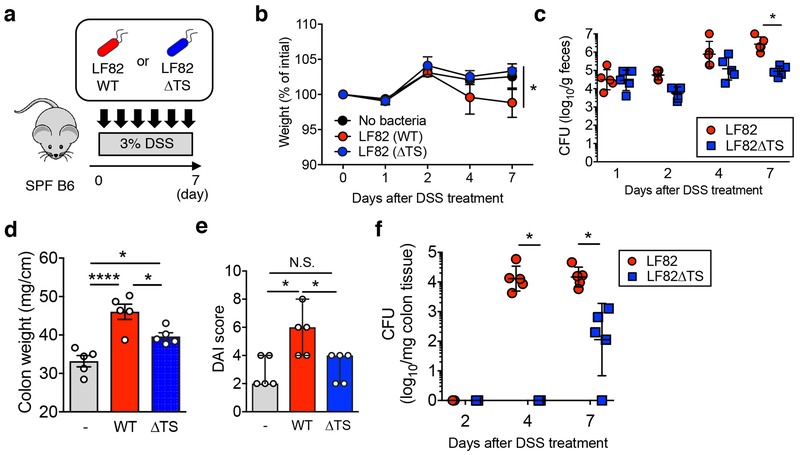
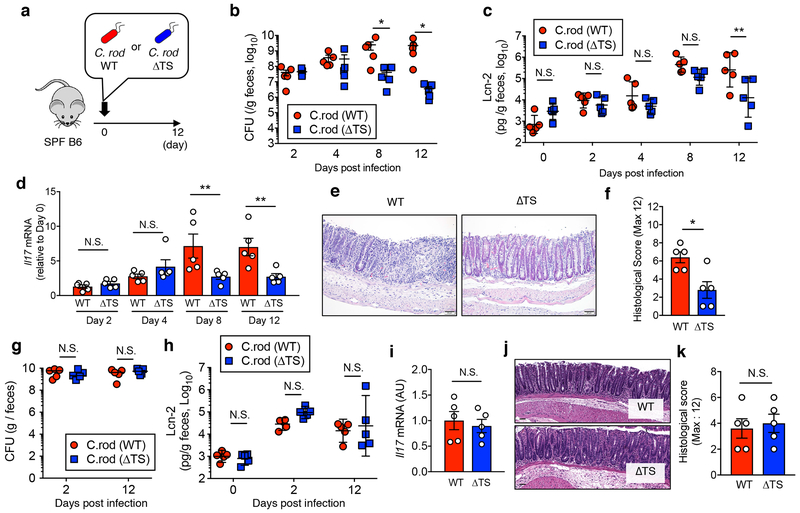
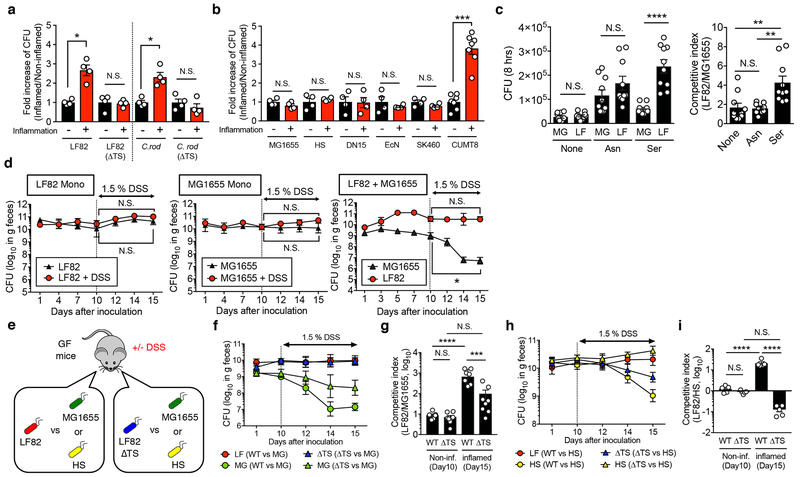
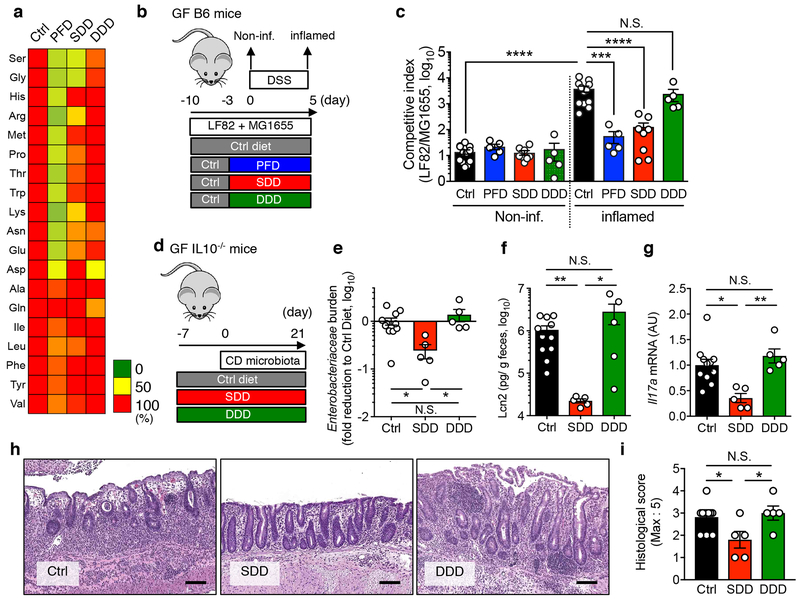
Metabolic reprogramming is associated with the adaptation of host cells to the disease environment, such as inflammation and cancer. However, little is known about microbial metabolic reprogramming or the role it plays in regulating the fitness of commensal and pathogenic bacteria in the gut. Here, we report that intestinal inflammation reprograms the metabolic pathways of Enterobacteriaceae, such as Escherichia coli LF82, in the gut to adapt to the inflammatory environment. We found that E. coli LF82 shifts its metabolism to catabolize L-serine in the inflamed gut in order to maximize its growth potential. However, L-serine catabolism has a minimal effect on its fitness in the healthy gut. In fact, the absence of genes involved in L-serine utilization reduces the competitive fitness of E. coli LF82 and Citrobacter rodentium only during inflammation. The concentration of luminal L-serine is largely dependent on dietary intake. Accordingly, withholding amino acids from the diet markedly reduces their availability in the gut lumen. Hence, inflammation-induced blooms of E. coli LF82 are significantly blunted when amino acids-particularly L-serine-are removed from the diet. Thus, the ability to catabolize L-serine increases bacterial fitness and provides Enterobacteriaceae with a growth advantage against competitors in the inflamed gut.


Conflict of interest statement

Disclosures: The authors declare no competing interests.

Figures

Extended Data Fig. 1.
Extended Data Fig. 1.. L-serine catabolism mutant LF82 ΔtdcΔsda has serine-dependent growth defect.
Diagram of tdc gene operon (a) and L-serine catabolism pathway in E. coli (b). (c, d) AIEC LF82 WT, Δtdc (ΔT), Δsda (ΔS), and ΔtdcΔsda (ΔTS) mutant strains were cultured in DMEM (0.45% glucose) or a minimal medium (0.1% glucose) supplemented with 1 mM serine for 8 hours at 37°C with 20% O2 and 5% CO2. Growth kinetics (O.D600) are shown. Data represent mean ± s.d. (N=5, technical replicates). Results are representative of 2 biologically independent experiments. ****; P < 0.0001 by 2-Way ANOVA (ΔTS vs WT, ΔT or ΔS). (d) Bacterial CFUs at 8 h were measured by plating on LB agar. Each number inside the bar indicates percent growth to WT LF82. (e) Luminal contents from ceca were collected from SPF C57BL/6 WT mice. The debris and bacteria were removed by centrifugation followed by filtration (0.2 μm). AIEC LF82 WT or ΔTS mutant were cultured in 20% sterilized luminal content for 8 h at 37°C with 20% O2 and 5% CO2. Bacterial CFUs were measured by plating on LB agar. (d, e) Data represent geometric mean ± s.d. (N=4-5, biological replicates). N.S.; not significant, ***; P <0.001 by Mann–Whitney U test (two-sided) (e) or 1-Way ANOVA followed by Bonferroni post-hoc test (d).
Extended Data Fig. 2.
Extended Data Fig. 2.. Inflammation-associated milieu may regulate the expression of tdcA in E. coli.
(a) Mucin broth was prepared by dissolving 0.5 % mucin in None-Carbon E medium (NCE) supplemented with trace elements. Sodium nitrate, dimethyl sulfoxide (DMSO), and trimethylamine N-oxide (TMAO) were added to a final concentration of 40 mM. Mucin broth without any supplementation (None) was used as a control. Each E. coli strain (MG1655 (MG), LF82 (LF), and LF82ΔtdcΔsda double mutant (TS)) was inoculated (1 x 10⁴ CFU/ml) in the medium and incubated anaerobically for 24 h at 37°C. Bacterial numbers were determined by spreading dilutions on selective LB agar plates. The fold increase was calculated by normalizing the CFU at 24 hrs to the respective CFU at 0 hrs. Data represent geometric mean ± s.d. (N=3, biologically independent samples). N.S.; not significant by 1-Way ANOVA followed by Bonferroni post-hoc test. (b) AIEC LF82 was cultured in vitro for 8 hrs at 37°C. The expression of tdcA mRNA was assessed by qPCR. Fold expression of tdcA in steady state-like conditions (DMEM supplemented with 0.1% glucose, cultured in 0% oxygen) is shown. Different concentrations of glucose (0.1% glucose or 0% glucose) and oxygen (0% oxygen or 2% oxygen) were tested. 3-[2-hydroxy-1-(1-methylethyl)-2-nitrosohydrazino]-1-propanamine (NOC-5) (10 mM) was added to mimic the presence of nitric oxide (NO). Data are represented as mean ± s.d.. Dots indicate individual biological replicates. ***; P < 0.001, ****; P < 0.0001 by Dunnett test. (c) SPF C57BL/6 mice WT (Ctrl) and Cybb−/− mice were treated with 3% DSS for 5 days. At day 5 post DSS treatment, mice were co-inoculated with LF82 WT and ΔtdcΔsda (ΔTS) mutant (1 x 10⁹ CFU each/mouse). Fecal samples were collected 24 hrs post E. coli inoculation. Fecal lipocalin-2 (Lcn2) levels (a) and the competitive index (LF82 WT/LF82 ΔTS) (d) are shown. Bars represent geometric mean ± s.d. Dots indicate individual mice. (N=4-5, biologically independent animals). N.S.; not significant, * P < 0.05 by Man-Whitney U test (two-sided).
Extended Data Fig. 3.
Extended Data Fig. 3.. L-serine metabolism pathways are not required for AIEC virulence.
(a) Experimental procedure: BMDMs (2 x 10⁵ cells/well/48 well plate in 200 μl) were stimulated with MG1655, AIEC LF82 WT or LF82 ΔtdcDsda double mutant (ΔTS) strains at a MOI=5 for 3 hrs, followed by 15 hrs of additional culture in the presence of gentamycin (100 μg/ml) to prevent bacterial overgrowth. (b) Bacterial CFU was measured before gentamicin treatment (3hrs). Data represents geometric mean ± s.d. Dots indicate individual biological replicate (N=3). N.S.; not significant. (c) Culture supernatants were harvested, and cytokines were measured by ELISA. Data represents mean ± s.d. Dots indicate individual biological replicate (N=3). N.S.; not significant, ***; P <0.001, ****; P < 0.0001 by 1-Way ANOVA followed by Bonferroni post-hoc test. (d) T84 intestinal epithelial cells (2 x 10⁵ cells/well/24 well plate in 500 μl) were grown for 3 weeks and infected with each E. coli strain (2 x 10⁶ cells/well). After 3 hrs, cells were washed, and extracellular bacteria were killed by gentamycin (100 μg/ml). Intracellular bacteria were then quantified by culture on LB agar plates. The percentage of intracellular bacteria was calculated. Data represents mean ± s.d. Dots indicate individual biological replicate (N=3). N.S.; not significant, **; P < 0.01 by 1-Way ANOVA followed by Bonferroni post-hoc test.
Extended Data Fig. 4.
Extended Data Fig. 4.. LF82 but not MG1655 employs L-serine for its growth.
(a) AIEC LF82 and commensal E. coli MG1655 were cultured in DMEM (0.45% glucose) or in a minimal medium (0.1% glucose) supplemented with a single L-amino acid (final concentration was 1mM) for 8 h at 37°C in 20% O2 and 5% CO2. Bacterial proliferation (O.D600) is shown. Data represent mean ± s.d. (N=2, technical replicates). Results are representative of 2 biologically independent experiments. SPF C57BL/6 mice were pretreated with streptomycin (800mg/kg, p.o.) 1 day prior to the treatment with 3.0% DSS. Control (Ctrl) and DSS-treated mice (day 5 post 3.0% treatment) were then co-inoculated with MG1655 WT and MG1655 ΔtdcΔsda (ΔTS) mutant (1 x 10⁹ CFU each/mouse). Fecal samples were collected 24 hrs post E. coli inoculation. Bacterial CFUs in feces (b) and the competitive index (WT/ΔTS) (c) are shown. Bars represent geometric mean ± s.d. Dots indicate individual mice (N=5, biologically independent animals). N.S.; not significant by Man-Whitney U test (two-sided) or 1-Way ANOVA followed by Bonferroni post-hoc test.
Extended Data Fig. 5.
Extended Data Fig. 5.. Severity of DSS colitis in gnotobiotic mice.
Germ-free (GF) C57BL/6 mice (N=4, biologically independent animals) were mono-colonized either with MG1655 or LF82, or co-colonized with those two strains (1 x 10⁹ CFU each/mouse) for 10 days. On day 10, colitis was induced by 1.5% DSS (for 5 days). Body weight change at day 15 (% of initial (day 10)) (a) and disease activity index (DAI) (day 10 and day 15) (b) are shown. Data represent mean ± s.e.m. Dots indicate individual mice. **; P < 0.01, **** P < 0.0001 by Man-Whitney U test (two-sided).
Extended Data Fig. 6.
Extended Data Fig. 6.. Intestinal inflammation alters the luminal metabolome.
SPF C57BL/6 mice (N=5, biologically independent animals) were treated with 1.5% DSS for 5 days. Cecal samples were harvested and luminal metabolic profiles were analyzed by capillary electrophoresis time-of-flight mass spectrometry (CETOF/MS). (a) A heatmap of the quantified luminal metabolites. The concentrations of metabolites were transformed into Z-scores and clustered according to their Euclidean distance. Gray areas in the heatmap indicate that respective metabolites were not detected. (b) Principal component analysis (PCA) of the luminal metabolome data. The ellipse denotes the 95% significance limit of the model, as defined by Hotelling’s t-test. (c) A loading scatter plot of the PCA. (d) The bar graphs showing the selected metabolites whose concentrations were altered significantly during DSS colitis. Data are presented as mean ± s.d. Dots represents individual mice (N=5, biologically independent animals). N.D.; not detected, *; P < 0.05, **; P < 0.01 by Mann–Whitney U test (two-sided).
Extended Data Fig. 7.
Extended Data Fig. 7.. Effect of dietary amino acid modification on mice.
(a, b) SPF C57BL/6 mice were fed a control amino acid defined diet (Ctrl), protein-free diet (PFD), L-serine-L-glycine-deficient diet (SDD), or Laspartic acid-deficient diet (DDD) for 7 days. Food consumption (a) and body weight change (b) were monitored at indicated time points. Four individual cages were used for each diet. Each cage contains 2-5 biologically independent mice. Food consumption amount per mouse in each cage was calculated. Data represent mean ± s.e.m. (N=4, biologically independent experiments). N.S.; not significant, *; P < 0.05, *** P < 0.001, **** P < 0.0001 by two-way ANOVA followed by Bonferroni post-hoc test (Ctrl vs PFD). (c) SPF C57BL/6 mice were fed the Ctrl, PFD, SDD, or DDD for 3 days. On day 3, fecal samples were collected from each mouse. Capillary electrophoresis time-of-flight mass spectrometry (CETOF/MS) was used to measure the concentration of luminal L-amino acids. Data represent mean ± s.e.m. Dots indicate individual mice (N=5-6, biologically independent animals). N.S.; not significant, *; P < 0.05, **; P < 0.01, ***; P < 0.001, **** P < 0.0001 by one-way ANOVA followed by Bonferroni post-hoc test or Man-Whitney U test (two-sided).
Extended Data Fig. 8.
Extended Data Fig. 8.. Dietary L-serine regulates intraspecific competition between E. coli in the inflamed gut.
(a) Germ-free (GF) C57BL/6 mice were co-inoculated with LF82 and MG1655 for 7 days. All mice were fed the control amino acid-defined (Ctrl) diet during this period. On day 7, the diet was switched to protein-free diet (PFD) or L-serinedeficient diet (SDD). The control group stayed on the ctrl diet. Three days after switching diets, colitis was induced by 1.5% DSS (5-day treatment). (Left) Bacterial CFUs and the (Right) competitive index of LF82/MG1655 were analyzed at indicated time points. Data are represented as geometric mean ± s.d. (N=5-8, biologically independent animals). *; P<0.05, ****; P< 0.0001: 2-Way ANOVA followed by Bonferroni post-hoc test (Left: Ctrl diet + MG1655 vs. SDD + MG1655, Right: Ctrl Diet vs SDD). (b) GF C57BL/6 mice were fed Ctrl diet or SDD. After three days, the mice were co-inoculated with LF82 and MG1655. Bacterial CFUs and the competitive index of LF82/MG1655 were analyzed at indicated time points. Data are represented as geometric mean ± s.d. (N=5, biologically independent animals).
Extended Data Fig. 9.
Extended Data Fig. 9.. Deprivation of dietary L-serine does not influence host anti-microbial immunity.
SPF C57BL/6 mice (N=5, biologically independent animals) were fed a control amino acid-defined diet (Ctrl), protein-free diet (PFD), or L-serine and L-glycine-deficient diet (SDD) for 14 days. Colonic mucosa was isolated at day 14 and the expression of host anti-microbial genes was analyzed by qPCR. Data are represented as mean ± s.d. Dots indicate individual mice. N.S.; not significant, by 1-Way ANOVA followed by Bonferroni post-hoc test.
Figure 1.
Figure 1.. E. coli reprograms its metabolism and utilizes serine in the inflamed gut.
(a) Germ-free (GF) mice were mono-colonized with E. coli LF82 for 1 week. E. coli mono-colonized mice were then treated with 1.5% DSS for 5 days. Cecal contents were harvested and microbial gene expression was analyzed by RNA-seq (N=4, biologically independent animals). A network analysis of bacterial genes up- (Left) and down-regulated (Right) in the inflamed gut (≥ 2.0-fold change) using the STRING protein–protein interaction database. The functional gene annotation was obtained from DAVID. Networks were exported with confidence view settings in which line thickness indicates the strength of data support. Each node (small circle) represents a gene up- or down-regulated in this analysis. The formed gene clusters were differentially colored with functional definitions as described in the box and shown as overlaid circles. (b) Fold increase (DSS/no DSS) of serine metabolism pathway genes. (c, d) Naïve SPF C57BL/6 mice (Control), DSS treated mice (day 5 post 3.0% DSS treatment), and colitis-developed Il10−/− mice were co-inoculated with LF82 WT and ΔtdcΔsda (ΔTS) mutant (1 x 10⁹ CFU each/mouse, N=5-8, biologically independent animals). Fecal samples were collected 24 hrs post inoculation. (c) Presence of active inflammation was verified by measuring fecal Lcn2 levels. Dots indicate individual mice with mean ± s.e.m. (d) Bacterial CFUs for each strain were measured by plating. Dots indicate individual mice with geometric mean ± s.d. (e) The competitive index of WT/ΔTS mutant is shown. Dots indicate individual mice with geometric mean ± s.d. N.S.; not significant, **; P < 0.01, ***; P< 0.001, **** P < 0.0001 by 1-Way ANOVA followed by Bonferroni post-hoc test.
Figure 2.
Figure 2.. L-serine catabolism promotes the fitness of AIEC in the inflamed gut.
(a) SPF C57BL/6 mice were treated with 3.0% DSS for 7 days (N=5, biologically independent animals).Mice were inoculated with LF82 WT or ΔtdcΔsda (ΔTS) double mutant (1 x 10⁹ CFU each/mouse) every day. (b) Body weight changes. Data represent individual mice with mean ± s.e.m.. (c) Fecal bacterial CFUs. CFUs of Individual mice are shown as dots with geometric mean ± s.d.. (b, c) The statistical comparison between LF82 WT and ΔTS group has been made and considered significant only at Day 7. *; P < 0.05 by 2-Way ANOVA followed by Bonferroni post-hoc test. (d, e) On day 7 post DSS, all mice are sacrificed and colonic weight (d) and disease activity index (DAI, e) were examined. Dots indicate individual mice with mean ± s.e.m. N.S.; not significant, *; P < 0.05, ****; P < 0.0001 by or 1-Way ANOVA followed by Bonferroni post-hoc test. (f) The colonic tissues were harvested on indicated days following DSS treatment. Colonic mucosa-associated bacterial CFUs were assessed. CFUs from individual mice are shown as dots with geometric mean ± s.d.. *; P < 0.05 by 2-Way ANOVA followed by Bonferroni post-hoc test.
Figure 3.
Figure 3.. L-serine catabolism promotes the fitness of C. rodentium in the inflamed gut.
(a) SPF C57BL/6 mice were infected orally with 1 x 10⁹ CFU of WT or ΔtdcΔsda (ΔTS) double mutant C. rodentium (N=5, biologically independent animals). (b, c, d) Pathogen burden in feces, fecal Lcn2 levels, and Il17a mRNA expression in the colonic mucosa were monitored over the indicated time. Dots indicate individual mice with geometric mean ± s.d. (b) or mean ± s.e.m. (c, d). (e, f) Mice were sacrificed on day 12 and inflammation was assessed by histological evaluation. Representative H&E images (scale bar = 100 μm) (e) and histological score (f) are shown. Dots indicate individual mice with mean ± s.e.m.. (g) Germ-free (GF) C57BL/6 mice were mono-colonized with C. rodentium WT or C. rodentium ΔTS (1 x 10⁹ CFU each/mouse) for 12 days. Fecal CFUs and Lcn2 level at indicated time points were analyzed. Dots indicate individual mice with geometric mean ± s.d. (g) or mean ± s.e.m. (h). (i, j, k) Mice were sacrificed on day 12. The expression of Il17a mRNA in the colonic mucosa (i), representative images of colon tissues (j) and histological score (k) were assessed. Dots indicate individual mice with mean ± s.e.m. N.S.; not significant, *; P < 0.05, **; P < 0.01 by 2-Way ANOVA followed by Bonferroni post-hoc test (b, c, d, g, h) or Man-Whitney U test (two-sided) (f, i, k).
Figure 4.
Figure 4.. L-serine catabolism regulates intraspecific competition of E. coli in the inflamed gut.
(a) E. coli LF82 WT, LF82 ΔtdcΔsda (ΔTS) mutant, C. rodentium DBS100 WT, and C. rodentium ΔtdcΔsda (ΔTS) mutant strains (1 x 10³ CFU) were inoculated into sterilized cecal content isolated from healthy and colitic (Salmonella-induced colitis) and cultured for 8 hrs at 37°C with 20% O2 and 5% CO2. After 8hrs, culture media were plated onto LB agar and bacterial CFUs were measured. Fold increase of bacterial strains in the inflammation (+) luminal content to the inflammation (−) control condition is shown. Dots indicate individual replicates with mean ± s.e.m (N=4, biologically independent samples). N.S.; not significant, *; P < 0.05 by Mann–Whitney U test (two-sided). (b) Each indicated E. coli strain (MG1655, HS, dn15.6244.1 (dn), Nissle 1917 (EcN), SK460, and CUMT8) was cultured in cecal content isolated from control and colitic mice as described in (a). Fold increase of bacterial strains in the inflammation (+) luminal content to the inflammation (−) control condition is shown. Dots indicate individual replicates with mean ± s.e.m (N=4-7, biologically independent samples). N.S.; not significant, ***; P < 0.001 by Mann–Whitney U test (two-sided). (c) Competitive growth assay of LF82 (AmpR) (LF) and MG1655 (StrR) (MG) in a minimal medium supplemented with L-asparagine (Asn) or L-serine (Ser). Bacterial CFUs were quantified by culture on LB plates supplemented with ampicillin or streptomycin. Dots indicate individual replicates with mean ± s.e.m (N=10, biologically independent samples). N.S.; not significant, **; P < 0.01, ****; P < 0.0001 by 1-Way ANOVA followed by Bonferroni post-hoc test. (d) Germ-free (GF) C57BL/6 mice were mono-colonized either with LF82 or MG1655, or co-colonized both strains (1 x 10⁹/mouse each). On day 10, mice were treated with 1.5% DSS for 5 days. Bacterial CFUs in each mouse was quantified by culturing fecal matter at indicated time points. Data are given as geometric mean ± s.d. (N=3-4, biologically independent animals). Results are representative of 3 independent experiments. N.S.; not significant, *; P < 0.05 by Mann–Whitney U test (day 10 (non-inflamed) vs day 15 (inflamed)). (e) GF C57BL/6 mice were co-colonized with LF82 WT or LF82 ΔtdcΔsda double mutant (ΔTS) and a commensal E. coli strain (MG1655 or HS) (1 x 10⁹ CFU each/mouse) for 10 days. On day 10, colitis was induced by 1.5% DSS (for 5 days). Colonization of LF82 WT (LF), LF82ΔTS (ΔTS), and MG1655 (MG) (f) or HS (h) was assessed at indicated time points. Data are presented as a geometric mean ± s.d. The competitive index of LF82 WT/MG1655 (WT) and LF82ΔTS/MG1655 (ΔTS) (g) and LF82 WT/HS (WT) and LF82ΔTS/HS (ΔTS) (i) in the non-inflamed (Non-inf) gut (day 10) and the inflamed gut (day 15) are shown. Dots indicate individual mice with as geometric mean ± s.d (N=5-8, biologically independent animals). (g, i) N.S.; not significant, ***; P < 0.001, ****; P < 0.0001 by 1-Way ANOVA followed by Bonferroni post-hoc test.
Figure 5.
Figure 5.. Dietary L-serine fosters the bloom of E. coli in the inflamed gut.
(a) SPF C57BL/6 mice were fed a control amino acid-defined diet (Ctrl), protein-free diet (PFD), L-serine and L-glycine-deficient diet (SDD), or L-aspartic acid-deficient diet (DDD) for 14 days. On day 3, fecal samples were collected from all mice. Capillary electrophoresis time-of-flight mass spectrometry (CE-TOF/MS) was used to measure the concentration of luminal L-amino acids. Mean values relative to ctrl diet-fed mice are shown as a heatmap. (b, c) Germ-free (GF) C57BL/6 mice were co-inoculated with AIEC LF82 and commensal E. coli MG1655 for 7days (from day −10 to day −3). All mice were fed the Ctrl diet during this period. After 7 days (on day −3), the diet was switched to PDF, SDD, or DDD. The control group stayed on the Ctrl diet. Three days after switching diets (on day 0), colitis was induced by 1.5% DSS (for 5 days). The competitive index of LF82/MG1655 was analyzed at steady-state (day 0, Non-inf) and during inflammation (day 5, inflamed). Dots indicate individual mice with geometric mean ± s.d. (N=5-12, biologically independent animals). N.S.; not significant, ***; P < 0.001, ****; P < 0.0001 by 1-Way ANOVA followed by Bonferroni post-hoc test. (d-i) GF Il10−/− mice (N=5-12) were fed either the Ctrl Diet or the amino acid-deficient diet (SDD or DDD) from 7 days prior to microbiota reconstitution. After 7days, a Crohn’s disease patient-derived fecal microbiota was orally inoculated. On day 21 post microbiota transplantation, mice were sacrificed, and intestinal inflammation was evaluated. (e) Fecal Enterobacteriaceae load on day 21 was measured by qPCR. Fecal Lcn2 levels (f), Il17a Mrna expression in the colonic mucosa (f), representative H&E images (scale bar = 100 μm) and histological scores (h, i) on day 21. (e-i) Dots indicate individual mice with geometric mean (e) or mean (f, g, i) ± s.d. N.S.; not significant, *; P < 0.05, **; P < 0.01 by 1-Way ANOVA followed by Bonferroni post-hoc test.

Comment in

  • How to thrive in the inflamed gut.
    Yoo W, Byndloss MX. Yoo W, et al. Nat Microbiol. 2020 Jan;5(1):10-11. doi: 10.1038/s41564-019-0642-z. Nat Microbiol. 2020. PMID: 31857729 No abstract available.

References

    1. Kamada N et al. Regulated virulence controls the ability of a pathogen to compete with the gut microbiota. Science 336, 1325–1329 (2012). - PMC - PubMed
    1. Conway T & Cohen PS Commensal and Pathogenic Escherichia coli Metabolism in the Gut. Microbiology spectrum 3 (2015) - PMC - PubMed
    1. Winter SE et al. Host-derived nitrate boosts growth of E. coli in the inflamed gut. Science 339, 10708–711 (2013). - PMC - PubMed
    1. Zhu W et al. Precision editing of the gut microbiota ameliorates colitis. Nature 553, 208–211 (2018). - PMC - PubMed
    1. Morgan XC et al. Dysfunction of the intestinal microbiome in inflammatory bowel disease and treatment. Genome Biol 13, R79 (2012). - PMC - PubMed

Publication types

MeSH terms