. 2020 Jan;5(1):108-115.
doi: 10.1038/s41564-019-0593-4. Epub 2019 Nov 4.

Home chemical and microbial transitions across urbanization

Affiliations

Home chemical and microbial transitions across urbanization

Laura-Isobel McCall et al. Nat Microbiol. 2020 Jan.

Abstract

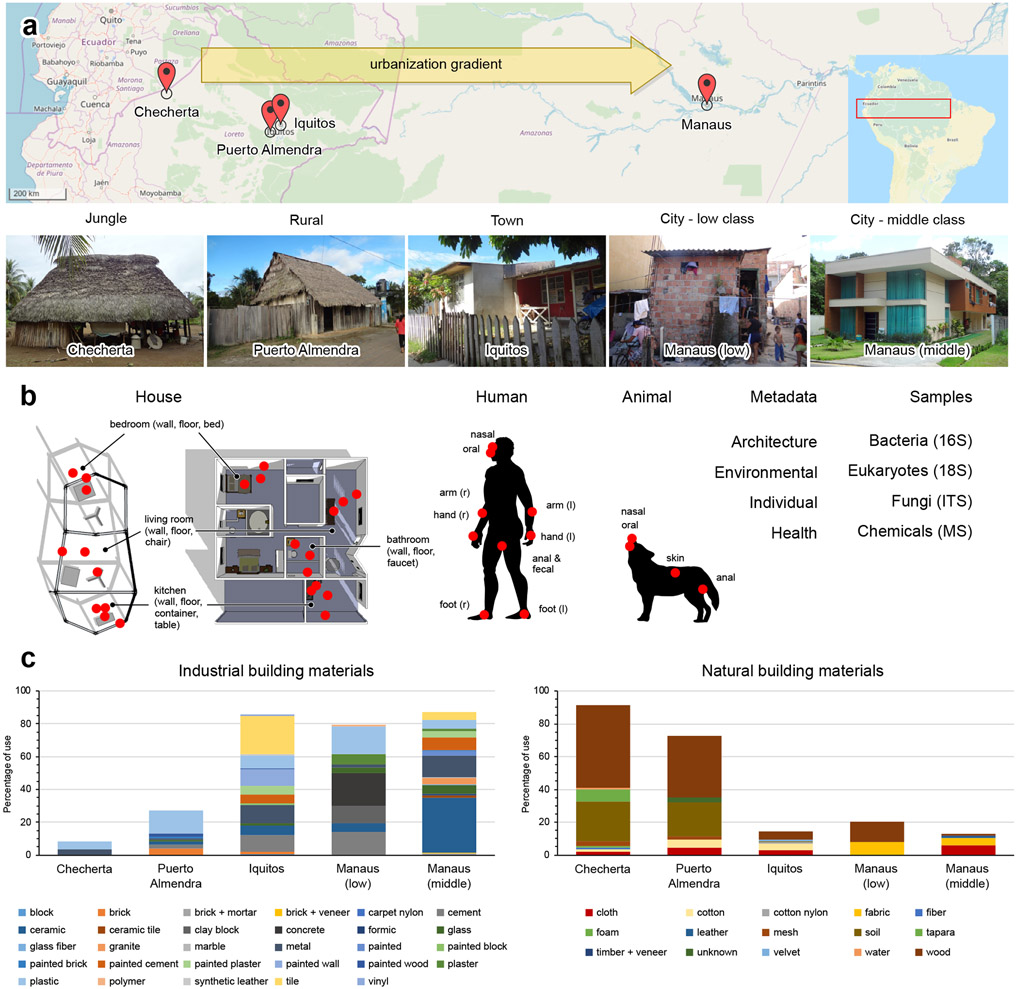
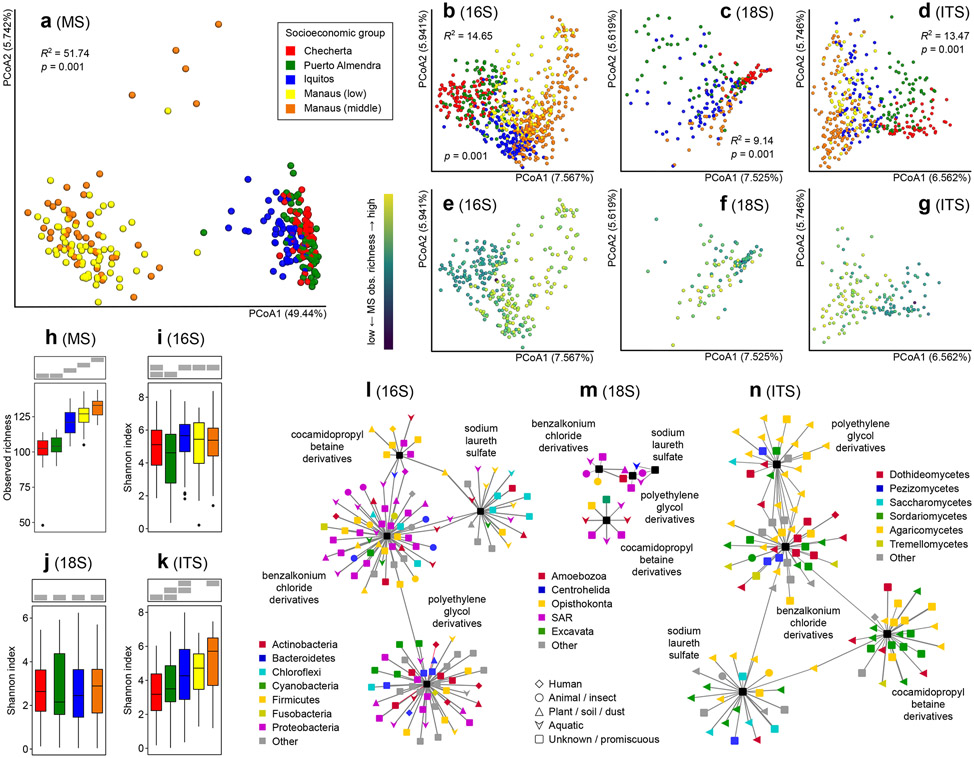
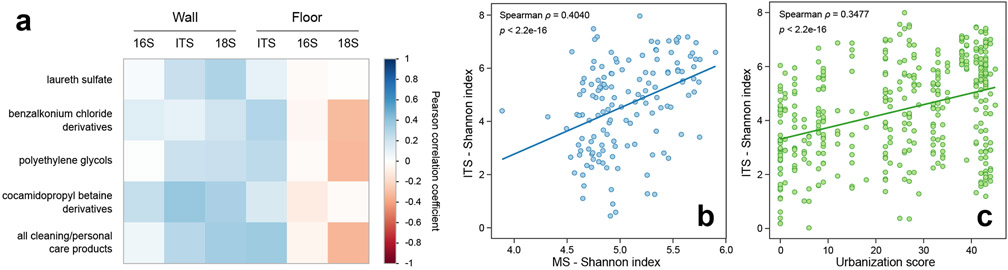
Urbanization represents a profound shift in human behaviour, and has considerable cultural and health-associated consequences1,2. Here, we investigate chemical and microbial characteristics of houses and their human occupants across an urbanization gradient in the Amazon rainforest, from a remote Peruvian Amerindian village to the Brazilian city of Manaus. Urbanization was found to be associated with reduced microbial outdoor exposure, increased contact with housing materials, antimicrobials and cleaning products, and increased exposure to chemical diversity. The degree of urbanization correlated with changes in the composition of house bacterial and microeukaryotic communities, increased house and skin fungal diversity, and an increase in the relative abundance of human skin-associated fungi and bacteria in houses. Overall, our results indicate that urbanization has large-scale effects on chemical and microbial exposures and on the human microbiota.


Figures

Figure 1.
Figure 1.. Study design.
a. Samples were collected in four different locations in South America along the Amazon river across an urbanization gradient: Checherta: remote jungle village, Puerto Almendra: rural village, Iquitos: large town, Manaus: metropolis (OpenStreetMap). In Manaus two different socio-economic classes were studied: lower income and middle-class. b. At each location 10 different houses and their inhabitants (humans and pets) were sampled. Sampling locations are illustrated by red dots. Microbial samples were collected for bacterial, fungal and eukaryotic analysis, with replicate samples for LC-MS/MS-based chemical profiling. Architectural and environmental parameters were monitored. Samples from the houses included wall, floor, bed (hammock), chair handle, table, faucet (water container), countertop, cup and fireplace. Human samples included skin (arm, hand, foot); oral, nasal and anal/fecal samples. Pet samples included oral/nasal, skin and anal samples. c. Use of building materials across the five locations (right, natural building materials; left, industrial building materials; determined by visual inspection).
Figure 2.
Figure 2.. House chemical and microbial diversity is altered by urbanization.
a. Principal coordinate analysis (PCoA) of chemical compounds (n=270), showing strong clustering by community, but not by socioeconomic group within one community (Bray-Curtis distance metric; PERMANOVA R2 and p-values are displayed). b-d. PCoA of bacterial (n=681), eukaryotic (n=215) and fungal (n=401) composition showing significant segregation among locations in the urbanization gradient (Jaccard distance metric; PERMANOVA R2 and p-values are displayed within each panel). e-g. Correlation between chemical richness and diversity of bacteria (e), eukaryotes (f) and fungi (g). h-k. Diversity of chemicals (h, observed richness, n=270) and microbes (i-k, Shannon diversity) (i, n=681, j, n=215, k, n=401) across the urbanization gradient. Boxplots display median and interquartile range, with boxplot whiskers extending to the most extreme data point within 1.5 times the interquartile range of the first (lower whisker) or third (upper whisker) quartile. Grey boxes on top of each panel indicate sample groupings (one group per row) by the M-W test. Samples sharing a grey bar at the same position are not significantly different (two-sided M-W p>0.05). Chemical and fungal diversity increased with urbanization. No significant differences were observed in 16S or 18S alpha diversity across the urbanization gradient. Chemical diversity analyses were based on all detected small molecule features in our dataset. l-n. Correlation analysis of cleaning and personal care product abundance and house bacteria (l, n=256), microeukaryotes (m, n=82) or fungi (n, n=140). Only correlations with an FDR-corrected Pearson correlation p-value greater than 0.05 are displayed. Outer nodes represent microorganisms (colored by phylum for bacteria, clade for eukaryotes and class for fungi; shaped by source) and central rectangles represent cleaning/personal care products. Names indicate the cleaning/personal care product at the center of each correlation cluster. Edge length is proportional to Pearson correlation p-value (FDR-corrected); edge thickness is proportional to Pearson correlation coefficient (independent scale for each panel). Negative correlations are indicated by red edges.
Figure 3.
Figure 3.. House fungal diversity is correlated to cleaning/personal care product abundance and overall chemical diversity.
a. Correlation plot of house microbial diversity (16S, ITS and 18S) with cleaning/personal care product derivatives (MS) (n=270). Colored according to Pearson correlation coefficient (blue, positive correlation; red, negative correlation; scale displayed right). b. Correlation of fungal diversity (ITS) with chemical diversity (MS) (n=141) (p<2.2e-16, Spearman test). c. Correlation of fungal diversity (ITS) in houses with urbanization score (n=671) (p<2.2e-16, Spearman test).

References

    1. United Nations Publications. World Population Prospects, the 2015 Revision. (World Population Prospects, 2016).
    1. Oyebode O et al. Rural, urban and migrant differences in non-communicable disease risk-factors in middle income countries: a cross-sectional study of WHO-SAGE data. PLoS One 10, e0122747 (2015). - PMC - PubMed
    1. Ege MJ et al. Exposure to environmental microorganisms and childhood asthma. N. Engl. J. Med 364, 701–709 (2011). - PubMed
    1. Yatsunenko T et al. Human gut microbiome viewed across age and geography. Nature 486, 222–227 (2012). - PMC - PubMed
    1. De Filippo C et al. Impact of diet in shaping gut microbiota revealed by a comparative study in children from Europe and rural Africa. Proc. Natl. Acad. Sci. U. S. A 107, 14691–14696 (2010). - PMC - PubMed

Publication types