. 2019 Dec;16(12):1306-1314.
doi: 10.1038/s41592-019-0616-3. Epub 2019 Nov 4.

Learning representations of microbe-metabolite interactions

Affiliations

Learning representations of microbe-metabolite interactions

James T Morton et al. Nat Methods. 2019 Dec.

Abstract

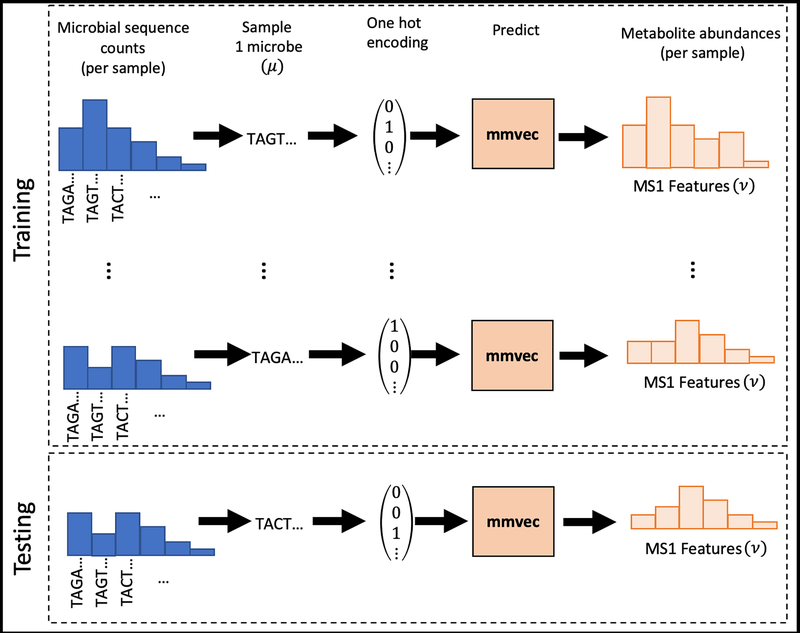
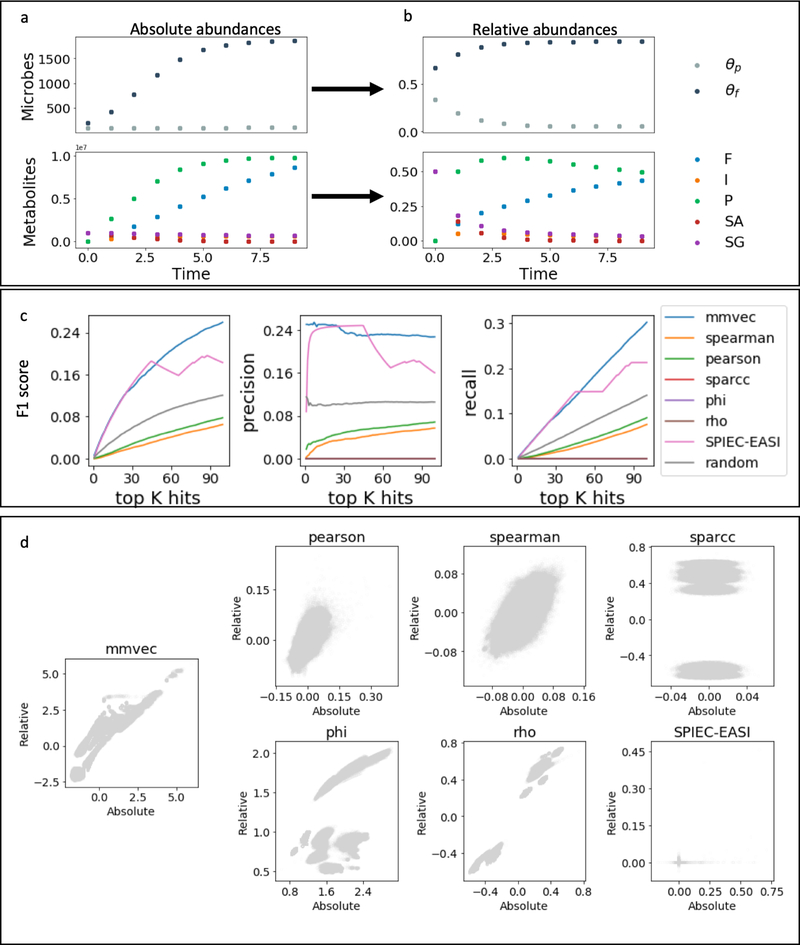
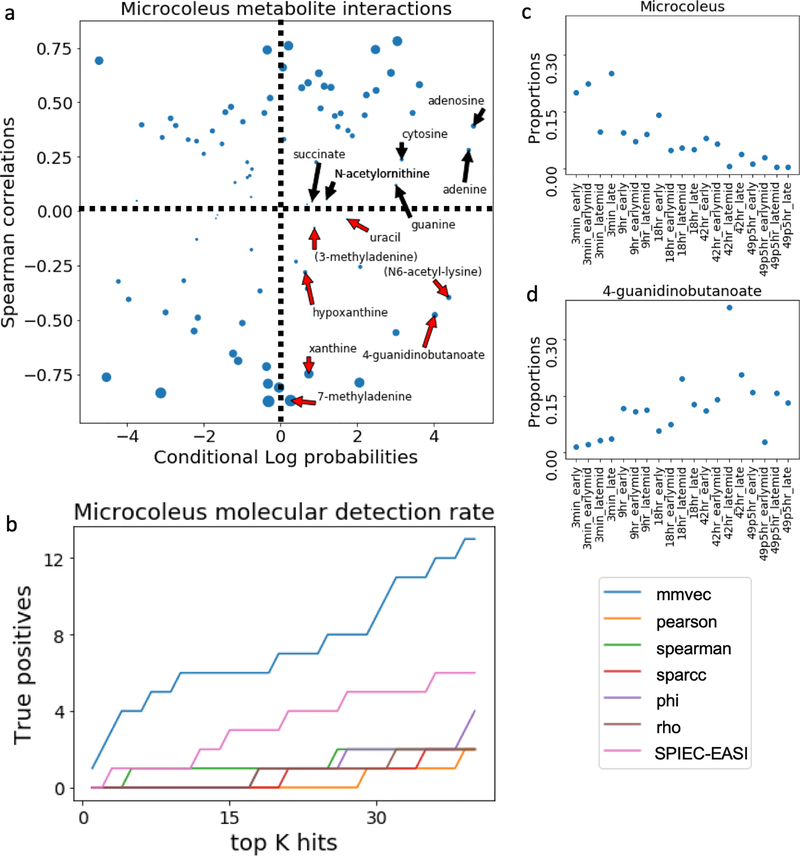
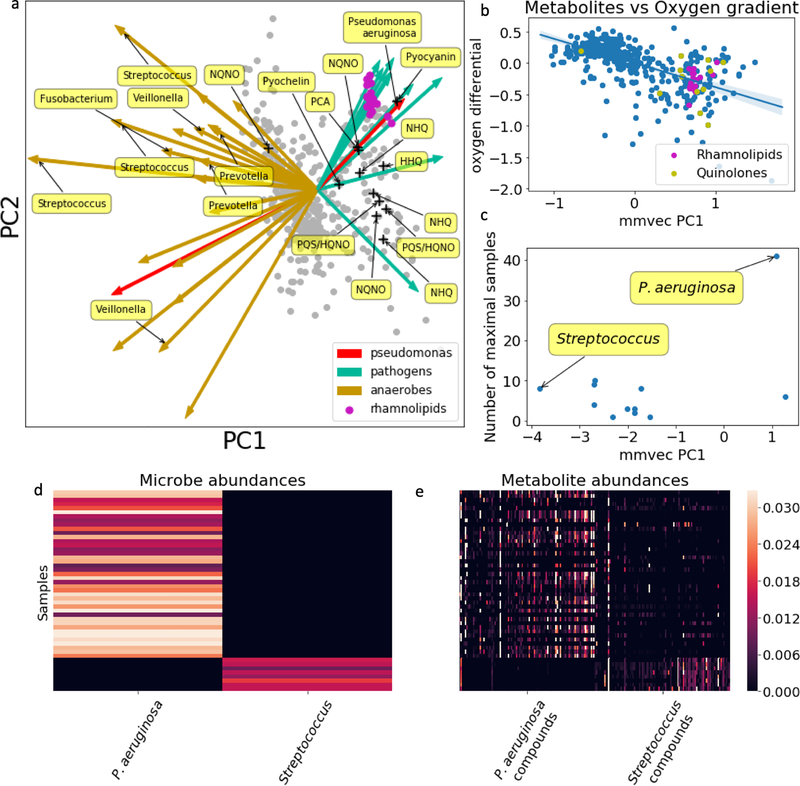
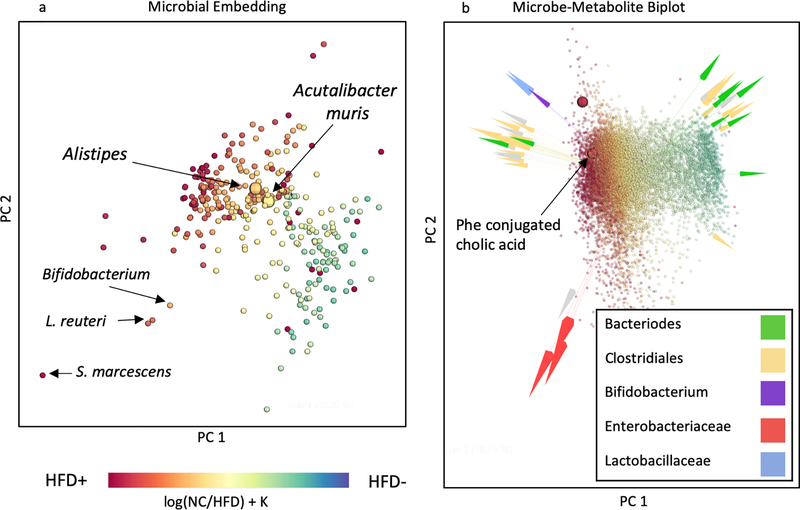
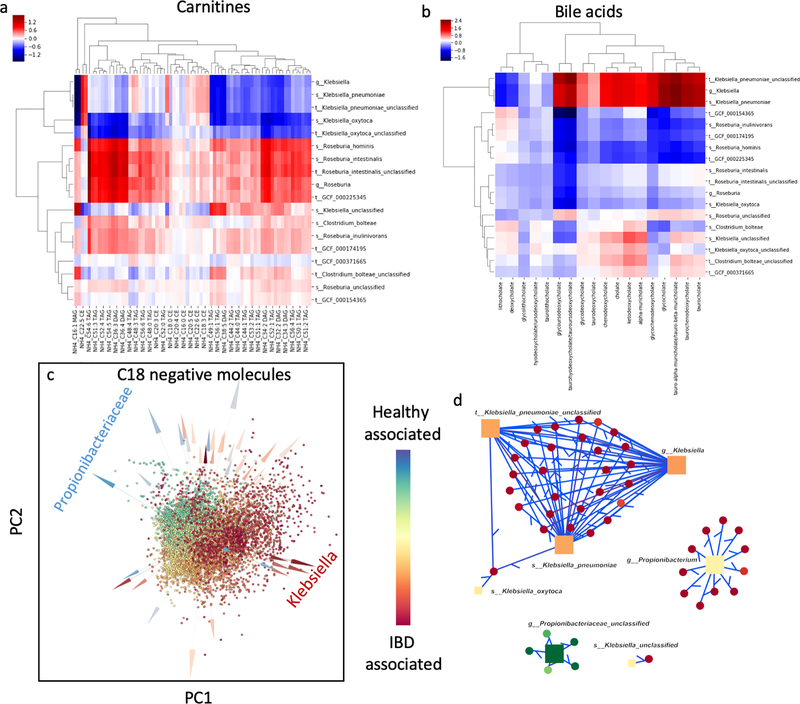
Integrating multiomics datasets is critical for microbiome research; however, inferring interactions across omics datasets has multiple statistical challenges. We solve this problem by using neural networks (https://github.com/biocore/mmvec) to estimate the conditional probability that each molecule is present given the presence of a specific microorganism. We show with known environmental (desert soil biocrust wetting) and clinical (cystic fibrosis lung) examples, our ability to recover microbe-metabolite relationships, and demonstrate how the method can discover relationships between microbially produced metabolites and inflammatory bowel disease.


Conflict of interest statement

Competing interests

Mingxun Wang is the founder of Ometa Labs LLC. None of the remaining authors have any competing interests.

Figures

Figure 1:
Figure 1:
Input data types and mmvec neural network architecture. (a) The neural network architecture where the input layer represents one-hot encodings of N microbes and the output layer represents the proportions of M metabolites. U corresponds to microbial vectors and V corresponds to metabolite vectors. (b) The pipeline for training mmvec. The objective behind mmvec is to predict metabolite abundances (y) given a single input microbe sequence (x), also known as a one-hot encoding. This training procedure will estimate conditional probabilities of observing a metabolite given the input microbe sequence. Cross-validation can be performed on hold-out samples to access overfitting.
Figure 2:
Figure 2:
Simulation benchmarks. (a) Absolute abundances of microbes and metabolites simulated from differential equations derived in [27] for a specific spatial point. (b) Proportions of the abundances shown in (a). (c) F1 score, precision and recall curves comparing mmvec to Pearson, Spearman, SparCC, SPIEC-EASI, and proportionality metrics phi and rho across the top 100 metabolites for each microbe. (d) comparisons of coefficients learned from absolute abundances and relative abundances all of the benchmarked methods.
Figure 3:
Figure 3:
M. vaginatus released metabolites after the biocrust wetting event. (a) Comparison of M. vaginatus metabolite interactions estimated from Spearman and mmvec from (n=19 samples). All of the experimentally validated M. vaginatus released metabolites are labeled. All metabolites with contradicting findings between the wetting experiment and the in vitro experimental results are highlighted in red. Points are resized according to the −10 log(p-value) obtained from Spearman correlation. Dashlines mark the cutoff for a Spearman correlation of zero, and the conditional log probabilities of zero. Here a zero log conditional probability represents the conditional probability of the average metabolite because all probabilities here are mean centered. (b) Benchmarks comparing the detection rate of the experimentally validated molecules across different statistical methodologies. (c) M. vaginatus proportions and (d) 4-guanidinobutanoate proportions following a wetting event.
Figure 4:
Figure 4:
Investigation of P.aeruginosa-associated molecules. (a) Biplot drawn from the mmvec conditional probabilities estimated for the cystic fibrosis dataset [27]. Arrows represent microbes and dots represent metabolites. The x and y axes represent principal components from the SVD of the microbe-metabolite conditional probabilities estimated from mmvec (n=138 samples). Distances between points quantify co-occurrence strength between metabolites, with small distances indicating metabolites that have a high probability of co-occurring with high probability. Distances between arrow tips quantify co-occurrence strength between microbes. The directionality of the arrows can be used to pinpoint which microbes can explain the metabolite co-occurrence patterns. Arrows highlighted in green correspond to putative cystic fibrosis pathogens and yellow arrows highlight known anaerobes. Only known molecules produced by P. aeruginosa are labeled. (b) Scatter plot of molecules with respect to the oxygen gradient differential and the first principal component learned from mmvec (n=442 molecules) with linear regression model and 95% confidence interval for regression estimate. (c) The first principal component vs the number of samples where the taxa was the most abundant taxa in that sample. (d) Heatmap of P. aeruginosa and Streptococcus abundances in samples where they are the most abundant species. (e) Heatmap of the top 100 molecules that co-occur with P. aeruginosa and Streptococcus.
Figure 5:
Figure 5:
Microbe/metabolite co-occurrences across study of HCC progression in the context of innate immunity in a mouse model [28]. (a) Visualization of microbial co-occurrence patterns, where distances between points approximates the Aitchison distance between microbes, which quantities microbial occurrences. Small distances are indicative of microbes with high probability of co-occurring together. Microbes are colored according to their association with HFD, which was estimated using differential abundance analysis via multinomial regression. (b) Emperor [59] biplot of microbe-metabolite interactions, with metabolites colored according to their association with HFD. HFD association was estimated through differential abundance analysis via multinomial regression. Distances between points approximate Aitchison distances between metabolites and distances between arrow tips approximate Aitchison distances between microbes. Several Clostridium spp. appear to co-occur with the new bile acid molecule cholate phenylalanine amidate, also referred to as Phe conjugated cholic acid.
Figure 6:
Figure 6:
Microbe-metabolite interactions of the human microbiome in association with IBD samples [29]. (a) Heatmap visualization of the inferred conditional probabilities for various bile acids given the presence of Klebsiella, Roseburia and Clostridium bolteae. (b) Heatmap visualization of the inferred conditional probabilities for the carnitines given the presence of Klebsiella, Roseburia, and Clostridium bolteae. (c) Multiomics biplot of the microbe-metabolite interactions learned from metagenomics profiles and C18 negative ion mode LC-MS. Microbes (arrows) and metabolites (spheres) are colored according to their differentials estimated from multinomial regression. Klebsiella spp. appears to be strongly associated with IBD, while Propionibacterium spp. has strong negative association. (d) Network of the top 300 edges where only the edges that contain Klebsiella and Propionibacteriaceae are visualized.

Comment in

  • Examining microbe-metabolite correlations by linear methods.
    Quinn TP, Erb I. Quinn TP, et al. Nat Methods. 2021 Jan;18(1):37-39. doi: 10.1038/s41592-020-01006-1. Epub 2021 Jan 4. Nat Methods. 2021. PMID: 33398187 No abstract available.
  • Reply to: Examining microbe-metabolite correlations by linear methods.
    Morton JT, McDonald D, Aksenov AA, Nothias LF, Foulds JR, Quinn RA, Badri MH, Swenson TL, Van Goethem MW, Northen TR, Vazquez-Baeza Y, Wang M, Bokulich NA, Watters A, Song SJ, Bonneau R, Dorrestein PC, Knight R. Morton JT, et al. Nat Methods. 2021 Jan;18(1):40-41. doi: 10.1038/s41592-020-01007-0. Epub 2021 Jan 4. Nat Methods. 2021. PMID: 33398188 No abstract available.

References

    1. Jansson Janet K and Baker Erin S. A multi-omic future for microbiome studies. Nat Microbiol, 1(16049):645, 2016. - PubMed
    1. Noecker Cecilia, Eng Alexander, Srinivasan Sujatha, Theriot Casey M, Young Vincent B, Jansson Janet K, Fredricks David N, and Borenstein Elhanan. Metabolic model-based integration of microbiome taxonomic and metabolomic profiles elucidates mechanistic links between ecological and metabolic variation. MSystems, 1(1):e00013–15, 2016. - PMC - PubMed
    1. Mallick Himel, Franzosa Eric A, Mclver Lauren J, Banerjee Soumya, Sirota-Madi Alexandra, Kostic Aleksandar D, Clish Clary B, Vlamakis Hera, Xavier Ramnik J, and Huttenhower Curtis. Predictive metabolomic profiling of microbial communities using amplicon or metagenomic sequences. Nature communications, 10(1):3136, 2019. - PMC - PubMed
    1. Knight Rob, Vrbanac Alison, Taylor Bryn C, Aksenov Alexander, Callewaert Chris, Debelius Justine, Gonzalez Antonio, Kosciolek Tomasz, McCall Laura-Isobel, McDonald Daniel, et al. Best practices for analysing microbiomes. Nature Reviews Microbiology, page 1, 2018. - PubMed
    1. Meng Chen, Zeleznik Oana A, Thallinger Gerhard G, Kuster Bernhard, Gholami Amin M, and Culhane Aedín C. Dimension reduction techniques for the integrative analysis of multi-omics data. Brief. Bioinform, 17(4):628–641, July 2016. - PMC - PubMed

Methods only references

    1. Nasrabadi Nasser M. Pattern recognition and machine learning. Journal of electronic imaging, 16(4):049901, 2007.
    1. Pawlowsky-Glahn Vera, Egozcue Juan José, and Tolosana-Delgado Raimon. Modeling and Analysis of Compositional Data. John Wiley & Sons, February 2015.
    1. Mikolov Tomas and Sutskever Ilya and Chen Kai and Corrado Greg S and Dean Jeff. Distributed representations of words and phrases and their compositionality. In Advances in neural information processing systems, pages 3111–3119, 2013.
    1. Koren Yehuda, Bell Robert, and Volinsky Chris. Matrix factorization techniques for recommender systems. Computer, (8):30–37, 2009.
    1. Kingma Diederik P and Ba Jimmy. Adam: A method for stochastic optimization. arXiv preprint arXiv:1412.6980, 2014.

Publication types

Supplementary concepts