. 2020 Jan;17(1):107-113.
doi: 10.1038/s41592-019-0625-2. Epub 2019 Nov 4.

Simultaneous mesoscopic and two-photon imaging of neuronal activity in cortical circuits

Affiliations

Simultaneous mesoscopic and two-photon imaging of neuronal activity in cortical circuits

Daniel Barson et al. Nat Methods. 2020 Jan.

Abstract

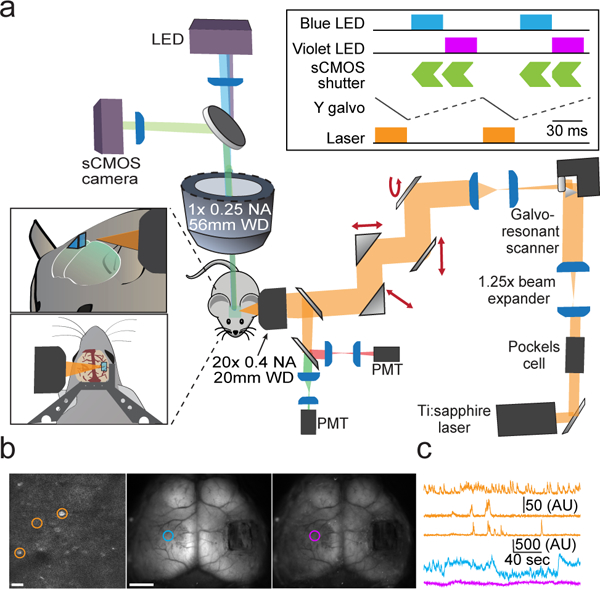
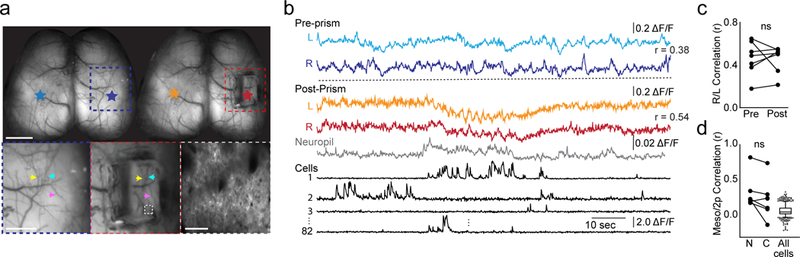
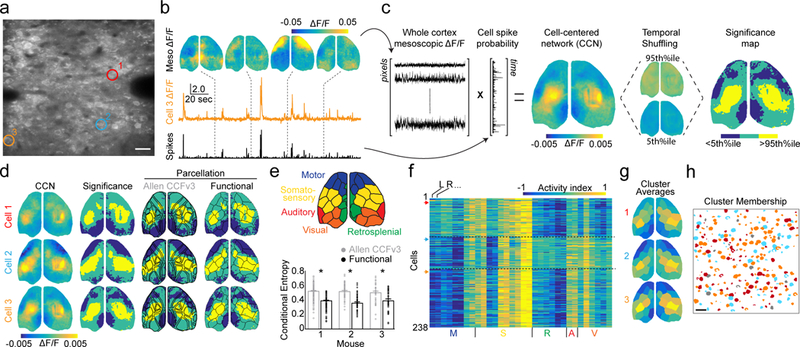
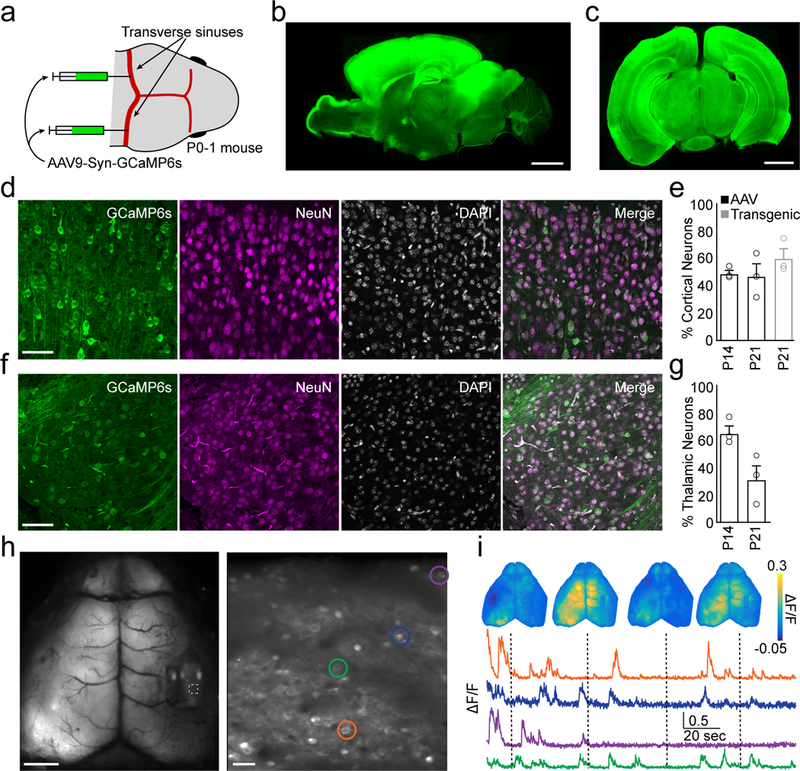
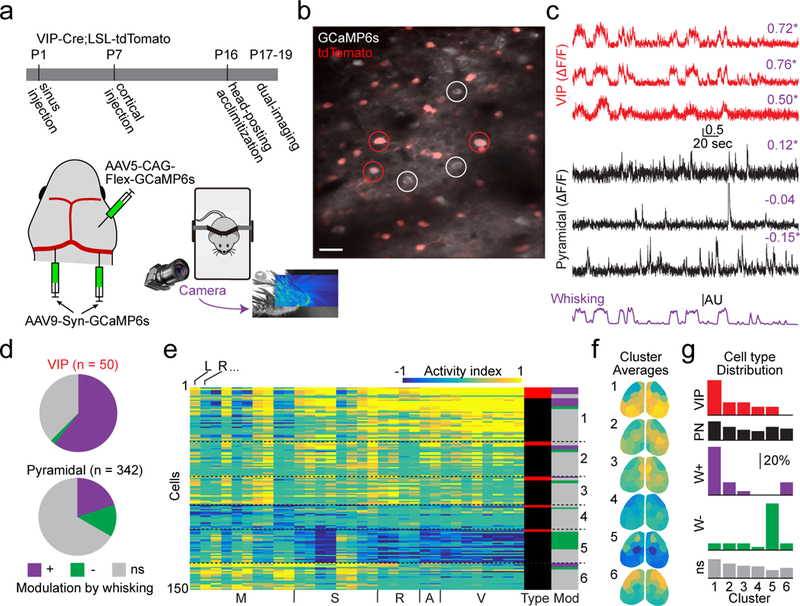
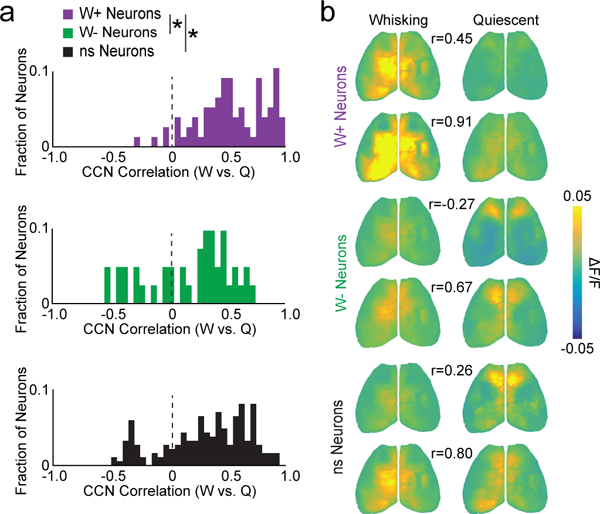
Spontaneous and sensory-evoked activity propagates across varying spatial scales in the mammalian cortex, but technical challenges have limited conceptual links between the function of local neuronal circuits and brain-wide network dynamics. We present a method for simultaneous cellular-resolution two-photon calcium imaging of a local microcircuit and mesoscopic widefield calcium imaging of the entire cortical mantle in awake mice. Our multi-scale approach involves a microscope with an orthogonal axis design where the mesoscopic objective is oriented above the brain and the two-photon objective is oriented horizontally, with imaging performed through a microprism. We also introduce a viral transduction method for robust and widespread gene delivery in the mouse brain. These approaches allow us to identify the behavioral state-dependent functional connectivity of pyramidal neurons and vasoactive intestinal peptide-expressing interneurons with long-range cortical networks. Our imaging system provides a powerful strategy for investigating cortical architecture across a wide range of spatial scales.


Conflict of interest statement

Conflicts of Interest

The authors declare no conflicts of interest exist.

Figures

Fig. 1.
Fig. 1.. Design of a dual-axis microscope for simultaneous mesoscopic and two-photon imaging.
a, Schematic overview of the dual-axis microscope. Left insets show the position of the two-photon objective relative to an implanted glass microprism and titanium headpost. Upper right inset shows timing of the widefield LED illumination, widefield sCMOS detector, two-photon excitation laser, and two-photon galvanometric Y-scan mirror. b, Example frames showing two-photon imaging (left) and mesoscopic imaging under blue (middle) and violet (right) illumination. Scale bar is 20 μm (left) and 2 mm (middle). c, Example cellular (orange) and mesoscopic (blue, violet) activity traces from the color-coded regions/cells shown in (b).
Fig. 2.
Fig. 2.. Analysis of simultaneously acquired micro- and meso-scale calcium imaging data.
a, Top: Mesoscopic images of the same animal acquired before and after microprism implantation over right S1. Colored stars correspond to regions-of-interest for traces in (b). Scale bar is 2 mm. Bottom left, middle: Expanded images corresponding to colored boxes in top images. Colored arrowheads highlight matching blood vessels on the surface of the brain before and after microprism implantation. Scale bar is 1 mm. Bottom right: two-photon field-of-view corresponding to dashed box in middle image. Scale bar is 50 μm. b, Mesoscopic calcium imaging traces (ΔF/F) corresponding to regions-of-interest indicated in (a). Neuropil and cellular data are for two-photon calcium imaging. Prism, neuropil, and cell traces were acquired simultaneously, whereas pre-prism traces were acquired during a previous imaging session. R values between mesoscopic traces are Pearson’s correlations. c, Pearson’s correlations between bilateral S1 mesoscopic pixels pre- and post-prism implantation. p = 0.87, n = 6 sessions across 6 animals, paired two-tailed t test. d, Pearson’s correlations between mean fluorescence of mesoscopic pixels corresponding to the two-photon field-of-view and mean fluorescence of all neuropil pixels (N), all cell pixels (C), or individual cell pixels in the two-photon field-of-view. P = 0.05, n = 7 trials across 6 animals, paired two-tailed t test. Box-and-whisker plots of cell correlations show median, interquartile, and 5th-95th percentile values.
Fig. 3.
Fig. 3.. Simultaneous imaging reveals functional connectivity of single neurons with large-scale cortical networks.
a, Example average two-photon field-of-view showing pyramidal neurons in a P17 mouse during simultaneous imaging. Colored circles highlight cells for panels (b-f). Scale bar is 20 μm. b, Example mesoscopic ΔF/F images with simultaneous ΔF/F trace and deconvolved spike probability for cell 3 from (a). c, Schematized procedure for calculating cell-centered networks (CCNs) and significance maps. d, Left: example CCNs for the three cells indicated in (a). Middle left: corresponding significance maps. Middle right: significance maps overlaid with an anatomical parcellation based on the Allen CCFv3. Right: significance maps overlaid with a functional parcellation calculated for that mouse. e, Illustration of the functional parcellation with regions labelled based on correspondence with the anatomical parcellation. Plot below shows the conditional entropy of significance maps given the anatomical or functional parcellation for three mice. Lower values indicate better fit. Mean±SEM: Allen CCFv3: H=0.54±0.01, 0.56±0.01, 0.53±0.02; functional: H=0.41±0.01, 0.39±0.01, 0.42±0.02; p < 0.001, paired two-tailed t-test for each mouse, n = 238, 64, 41 significance maps. f, Activity index calculated from all significance maps for a single animal using the functional parcellation. Higher values indicate a large number of pixels that are significantly co-active with each cell. Cells are clustered into three groups (see Methods). Arrows on the left indicate rows corresponding to the cells in (a). g, Averages of the three clusters in (f) with parcels colored by their activity index. h, Schematized two-photon field-of-view, same as in (a), with pixels colored to indicate membership of individual cells in the three clusters shown in (g). Scale bar is 20 μm.
Fig. 4.
Fig. 4.. Systemic AAV9 produces robust GCaMP expression in the brain.
a, Schematic showing sites of viral injection in a neonatal mouse. b, Example sagittal section of a P21 mouse brain showing widespread expression of GCaMP6s across the cortex and other brain regions. Scale bar is 2 mm. c, Example coronal section. Scale bar is 2 mm. d, Confocal images showing GCaMP6s expression in mouse cortex at P14. Left: GCaMP6s, middle left: NeuN, middle right: DAPI, right: merge. Scale bar is 40 μm. Images are representative across 6 mice. e, Quantification of cortical neuron labeling at either P14 or P21 following AAV injection (black) or transgenic (Slc17a7-cre;CaMK2a-tTA;TITL-GCaMP6f) expression (gray). Mean±SEM: P14 AAV: 48.3±2.4, P21 AAV: 46.4±9.1, P21 transgenic: 59.3±7.0; n = 3 mice per group. f, As in (d), but for thalamus. Images are representative across 6 mice. g, As in (e), but for thalamus. Mean±SEM: P14 AAV: 65.3±5.5, P21 AAV: 31.5±10.3; n = 3 mice per group. h, Mean fluorescence images from simultaneously acquired mesoscopic (left, scale bar is 2 mm) and two-photon (right, scale bar is 20 μm) imaging following AAV9 sinus injection. i, Example simultaneously acquired mesoscopic ΔF/F images and cellular ΔF/F traces from cells indicated in (h).
Fig. 5.
Fig. 5.. Cell-centered networks vary by neuronal class and sensitivity to arousal.
a, Schematic of experimental timeline and setup, including whisker tracking videography. Image shows example facial videography frame overlaid with whisker motion energy heat map. Warmer colors indicate higher mean pixel motion energy. b, Mean two-photon image from data acquired during dual-imaging showing GCaMP6s expression in tdTomato-positive (VIP-INs, examples circled in red) and -negative (presumptive pyramidal neurons, examples circled in white) cells. Scale bar is 20 μm. Image is representative of 15 fields-of-view across 4 mice. c, ΔF/F traces from VIP cells (red) and putative pyramidal cells (black) aligned with whisker motion energy (purple). Pearson’s correlation of ΔF/F with whisking is listed above each trace, with asterisks indicating significant values (p < 0.01, shuffle test, 1000 shuffles). d, Relative numbers of VIP-INs and pyramidal cells that are positively-, negatively-, or not significantly (ns) correlated with whisking (p < 0.01, shuffle test). e, Activity index calculated from all significance maps for all cells recorded in a single animal. Cells are clustered into six groups. Columns to the right indicate cell type (red indicates VIP-IN, black indicates pyramidal cell) and whether cells are correlated with whisking (colors as in d). f, Averages of the six clusters in (e) with parcels colored by their activity index. g, Fractional distribution of cells into each cluster, separated by type or modulation by whisking.
Fig. 6.
Fig. 6.. Behavioral state is linked to CCN reorganization for a subset of neurons.
a, Distribution of Pearson’s correlation coefficients for CCNs derived during whisking versus quiescence, for whisking-positive, whisking-negative, and non-modulated neurons. P < 0.001 for indicated comparisons, Kolmogorov-Smirnov test, n = 97, 48, and 247 neurons for each group, respectively. b, Example CCNs for two neurons from each group showing either weak (upper images) or strong (lower images) correlation across whisking versus quiescent states. Pearson’s correlation coefficients are indicated.

References

    1. Jiang X., et al. Principles of connectivity among morphologically defined cell types in adult neocortex. Science 350, aac9462 (2015). - PMC - PubMed
    1. Wall NR, et al. Brain-Wide Maps of Synaptic Input to Cortical Interneurons. J Neurosci 36, 4000–4009 (2016). - PMC - PubMed
    1. Wertz A., et al. PRESYNAPTIC NETWORKS. Single-cell-initiated monosynaptic tracing reveals layer-specific cortical network modules. Science 349, 70–74 (2015). - PubMed
    1. Crochet S., Lee SH & Petersen CCH Neural Circuits for Goal-Directed Sensorimotor Transformations. Trends Neurosci (2018). - PubMed
    1. Kim EJ, Juavinett AL, Kyubwa EM, Jacobs MW & Callaway EM Three Types of Cortical Layer 5 Neurons That Differ in Brain-wide Connectivity and Function. Neuron 88, 1253–1267 (2015). - PMC - PubMed

Publication types