

Prebiotic UG1601 mitigates constipation-related events in association with gut microbiota: A randomized placebo-controlled intervention study
- PMID: 31686768
- PMCID: PMC6824284
- DOI: 10.3748/wjg.v25.i40.6129
Prebiotic UG1601 mitigates constipation-related events in association with gut microbiota: A randomized placebo-controlled intervention study
Abstract
Background: Constipation is a common functional gastrointestinal disorder and its etiology is multifactorial. Growing evidence suggests that intestinal dysbiosis is associated with the development of constipation. Prebiotics are subjected to bacterial fermentation in the gut to produce short-chain fatty acids (SCFAs), which can help relieve constipation symptoms. The prebiotic UG1601 consists of inulin, lactitol, and aloe vera gel, which are known laxatives, but randomized, controlled clinical trials that examine the effects of this supplement on gut microbiota composition are lacking.
Aim: To assess the efficacy of the prebiotic UG1601 in suppressing constipation-related adverse events in subjects with mild constipation.
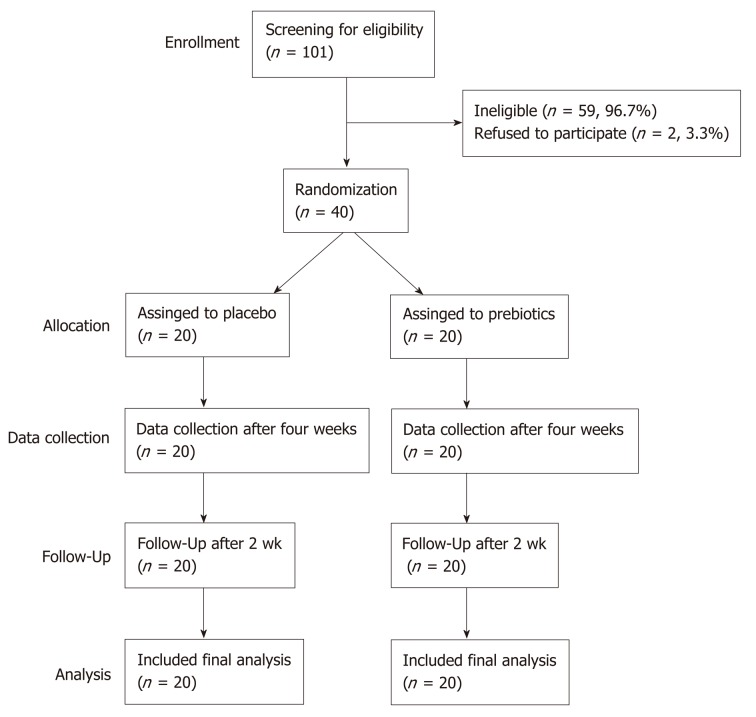
Methods: Adults with a stool frequency of less than thrice a week were randomized to receive either prebiotics or a placebo supplement for 4 wk. All participants provided their fecal and blood samples at baseline and at the end of intervention. Gastrointestinal symptoms and stool frequency were evaluated. The concentrations of serum endotoxemia markers and fecal SCFAs were determined. The relative abundance of SCFA-producing bacteria and the gut microbial community in the responders and non-responders in the prebiotics supplementation group were evaluated.
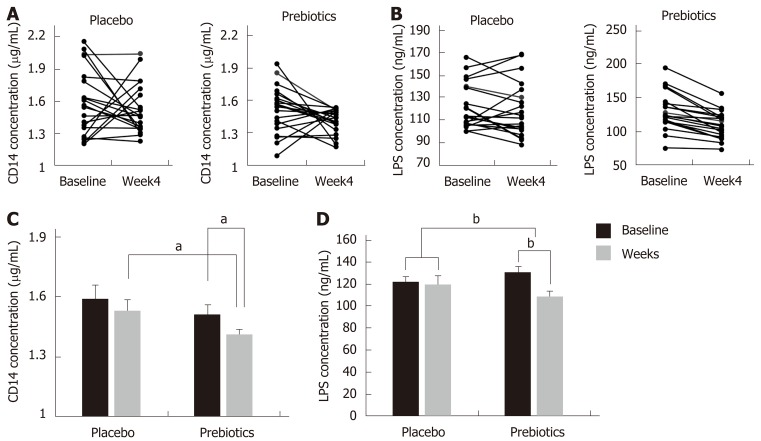
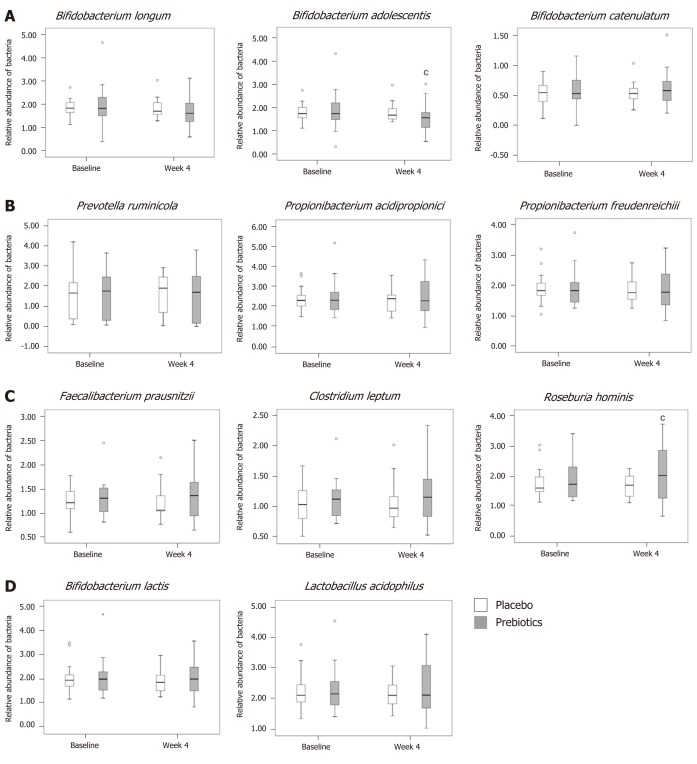
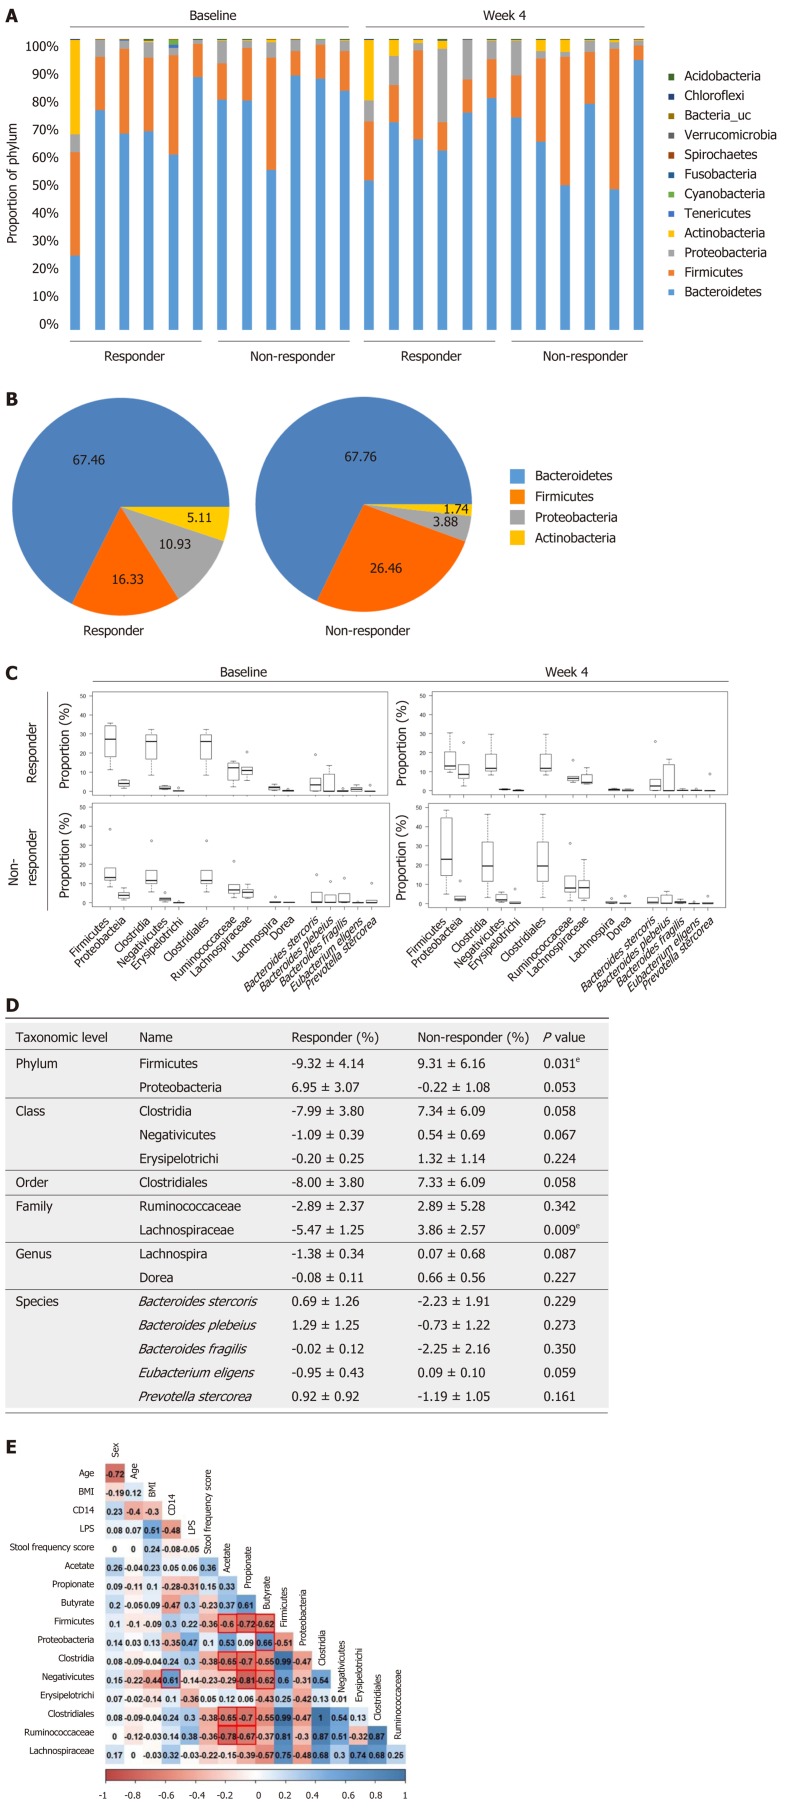
Results: There were no significant differences in gastrointestinal symptoms between groups, although the prebiotic group showed greater symptom improvement. However, after prebiotic usage, serum cluster of differentiation (CD) 14 and lipopolysaccharide (LPS) concentrations were significantly decreased (CD14, P = 0.012; LPS, P < 0.001). The change in LPS concentration was significantly larger in the prebiotic group than in the placebo group (P < 0.001). Fecal SCFAs concentrations did not differ between groups, while the relative abundance of Roseburia hominis, a major butyrate producer, was significantly increased in the prebiotic group (P = 0.045). The abundances of the phylum Firmicutes and the family Lachnospiraceae (phylum Firmicutes, class Clostridia) (P = 0.009) were decreased in the responders within the prebiotic group. In addition, the proportions of the phylum Firmicutes, the class Clostridia, and the order Clostridiales were inversely correlated with several fecal SCFAs (P < 0.05).
Conclusion: Alterations in gut microbiota composition, including a decrease in the phylum Firmicutes and an increase in butyrate-producing bacteria, following prebiotic UG1601 supplementation might help alleviate symptom scores and endotoxemia.
Keywords: Constipation; Endotoxemia; Gut microbiota; Prebiotics; Short-chain fatty acids.
©The Author(s) 2019. Published by Baishideng Publishing Group Inc. All rights reserved.
Conflict of interest statement
Conflict-of-interest statement: Lee YC is an employee of Unigen, Inc. and provided materials for this intervention study. The other authors have no conflicts of interest or financial arrangements that could potentially influence this research. The terms of this arrangement have been reviewed and approved by the Sookmyung Women’s University in accordance with its policy on objectivity in research.
Figures
Similar articles
-
Habitual dietary fibre intake influences gut microbiota response to an inulin-type fructan prebiotic: a randomised, double-blind, placebo-controlled, cross-over, human intervention study.Br J Nutr. 2018 Jan;119(2):176-189. doi: 10.1017/S0007114517003440. Epub 2018 Jan 8. Br J Nutr. 2018. PMID: 29307330 Clinical Trial.
-
A randomized trial to determine the impact of a digestion resistant starch composition on the gut microbiome in older and mid-age adults.Clin Nutr. 2018 Jun;37(3):797-807. doi: 10.1016/j.clnu.2017.03.025. Epub 2017 Mar 31. Clin Nutr. 2018. PMID: 28410921 Clinical Trial.
-
Inulin-type fructans improve active ulcerative colitis associated with microbiota changes and increased short-chain fatty acids levels.Gut Microbes. 2019;10(3):334-357. doi: 10.1080/19490976.2018.1526583. Epub 2018 Nov 5. Gut Microbes. 2019. PMID: 30395776 Free PMC article.
-
Impact of Prebiotics on Enteric Diseases and Oxidative Stress.Curr Pharm Des. 2020;26(22):2630-2641. doi: 10.2174/1381612826666200211121916. Curr Pharm Des. 2020. PMID: 32066357 Review.
-
The effects of inulin on gut microbial composition: a systematic review of evidence from human studies.Eur J Clin Microbiol Infect Dis. 2020 Mar;39(3):403-413. doi: 10.1007/s10096-019-03721-w. Epub 2019 Nov 9. Eur J Clin Microbiol Infect Dis. 2020. PMID: 31707507
Cited by
-
Probiotics, prebiotics, and synbiotics in chronic constipation: Outstanding aspects to be considered for the current evidence.Front Nutr. 2022 Dec 8;9:935830. doi: 10.3389/fnut.2022.935830. eCollection 2022. Front Nutr. 2022. PMID: 36570175 Free PMC article. Review.
-
Role of gut microbiota in functional constipation.Gastroenterol Rep (Oxf). 2021 Aug 6;9(5):392-401. doi: 10.1093/gastro/goab035. eCollection 2021 Oct. Gastroenterol Rep (Oxf). 2021. PMID: 34733524 Free PMC article. Review.
-
Association between dietary phosphorus intake and chronic constipation in adults: evidence from the National Health and Nutrition Examination Survey.BMC Gastroenterol. 2023 Jan 24;23(1):24. doi: 10.1186/s12876-022-02629-8. BMC Gastroenterol. 2023. PMID: 36694113 Free PMC article.
-
Food Additives Associated with Gut Microbiota Alterations in Inflammatory Bowel Disease: Friends or Enemies?Nutrients. 2022 Jul 25;14(15):3049. doi: 10.3390/nu14153049. Nutrients. 2022. PMID: 35893902 Free PMC article. Review.
-
Bifidobacterium Lactobacillus Triple Viable Alleviates Slow Transit Constipation by Regulating Gut Microbiota and Metabolism.J Gastroenterol Hepatol. 2025 Jun;40(6):1561-1573. doi: 10.1111/jgh.16960. Epub 2025 Apr 4. J Gastroenterol Hepatol. 2025. PMID: 40183209 Free PMC article.
References
-
- Higgins PD, Johanson JF. Epidemiology of constipation in North America: a systematic review. Am J Gastroenterol. 2004;99:750–759. - PubMed
-
- Jun DW, Park HY, Lee OY, Lee HL, Yoon BC, Choi HS, Hahm JS, Lee MH, Lee DH, Kee CS. A population-based study on bowel habits in a Korean community: prevalence of functional constipation and self-reported constipation. Dig Dis Sci. 2006;51:1471–1477. - PubMed
-
- Cheng C, Chan AO, Hui WM, Lam SK. Coping strategies, illness perception, anxiety and depression of patients with idiopathic constipation: a population-based study. Aliment Pharmacol Ther. 2003;18:319–326. - PubMed
Publication types
MeSH terms
Substances
Supplementary concepts
LinkOut - more resources
Full Text Sources
Medical
Research Materials
