. 2019 Oct 14:12:8339-8353.
doi: 10.2147/OTT.S220823. eCollection 2019.

miR-92b-3p Functions As A Key Gene In Esophageal Squamous Cell Cancer As Determined By Co-Expression Analysis

Affiliations

miR-92b-3p Functions As A Key Gene In Esophageal Squamous Cell Cancer As Determined By Co-Expression Analysis

Wanpeng Wang et al. Onco Targets Ther. .

Abstract

Background: Esophageal squamous cell carcinoma (ESCC) is a highly aggressive malignancy. The aims of the present study were to screen the critical miRNA and corresponding target genes that related to development of ESCC by weighted gene correlation network analysis (WGCNA) and investigate the functions by experimental validation.

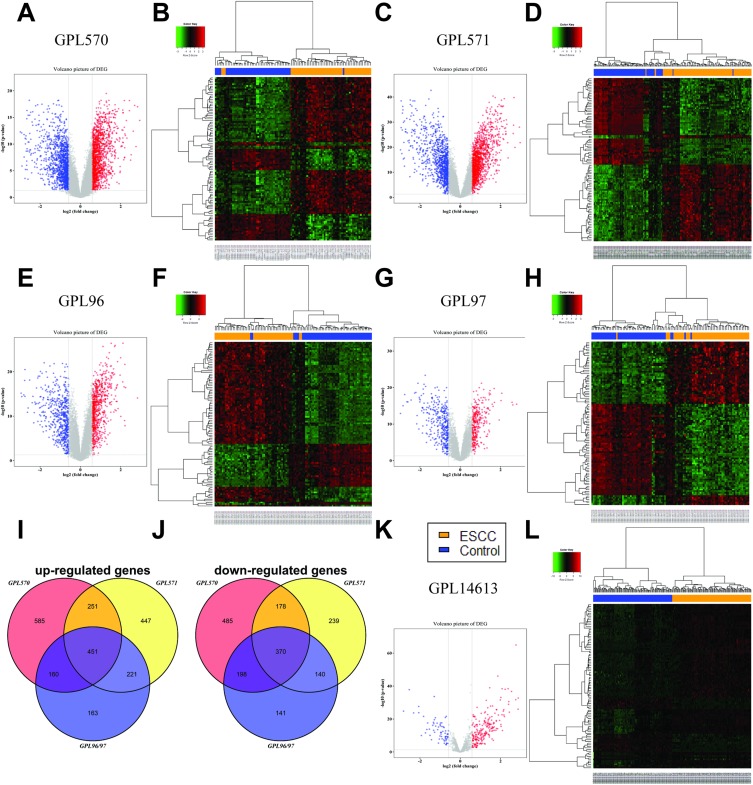
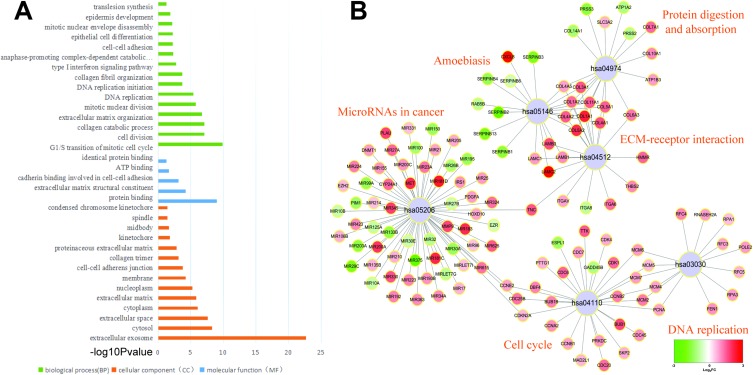
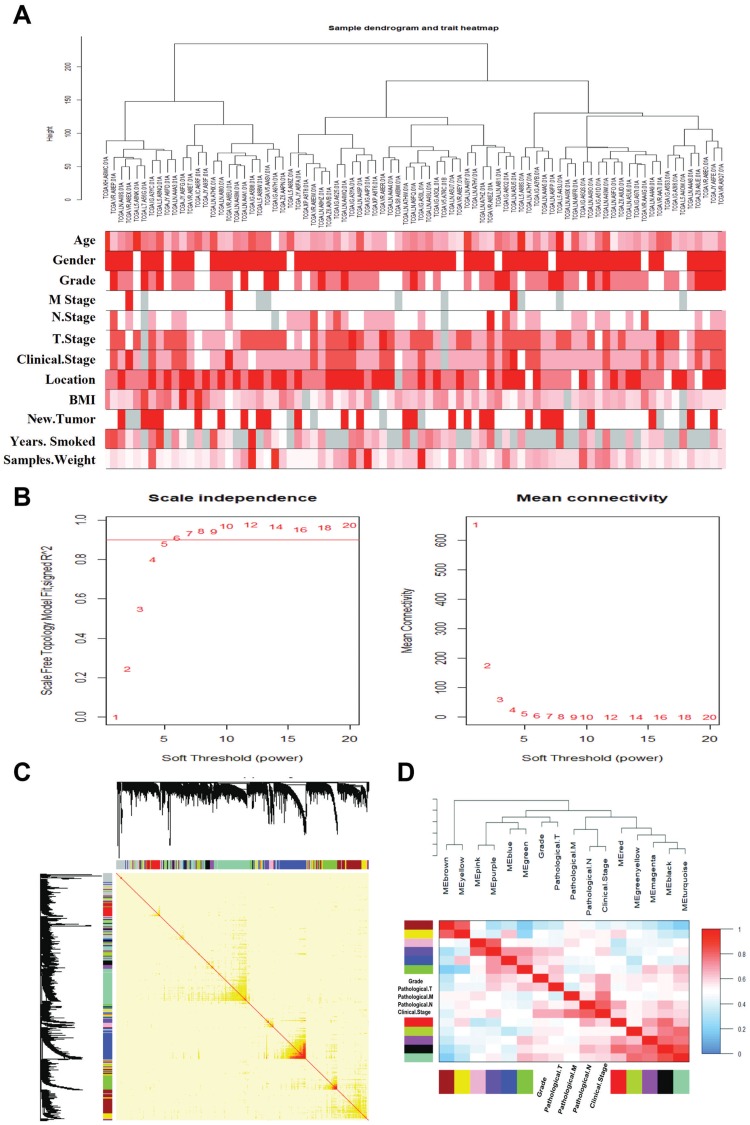
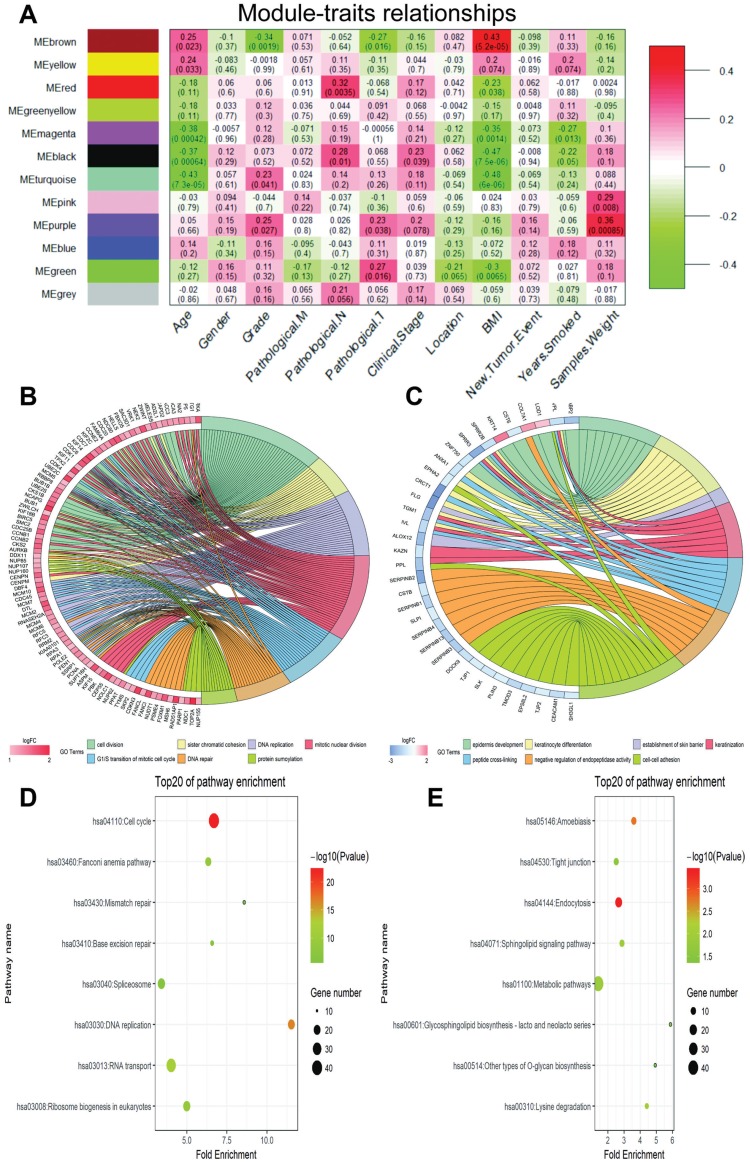
Methods: Datasets of mRNA and miRNA expression data were downloaded from GEO. The R software was used for data preprocessing and differential expression gene analysis. The differentially expressed protein-coding genes (DEGs) and miRNAs (DEMs) were selected (FDR <0.05 or |Fold Change (FC)| >1.5). Meanwhile, 81 expression data of ESCC patients in TCGA combined with clinic information were applied by WGCNA to create networks. The correlational analyses between each module and clinical parameters were conducted, and enrichment analyses of GO and KEGG were subsequently performed. Then, a series of experiments were conducted in ESCC cells by use of miRNA mimics.

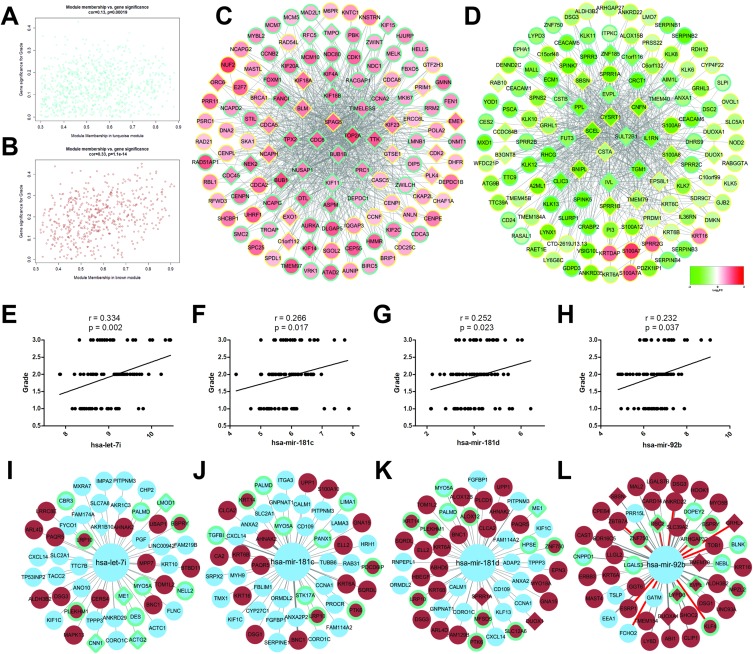
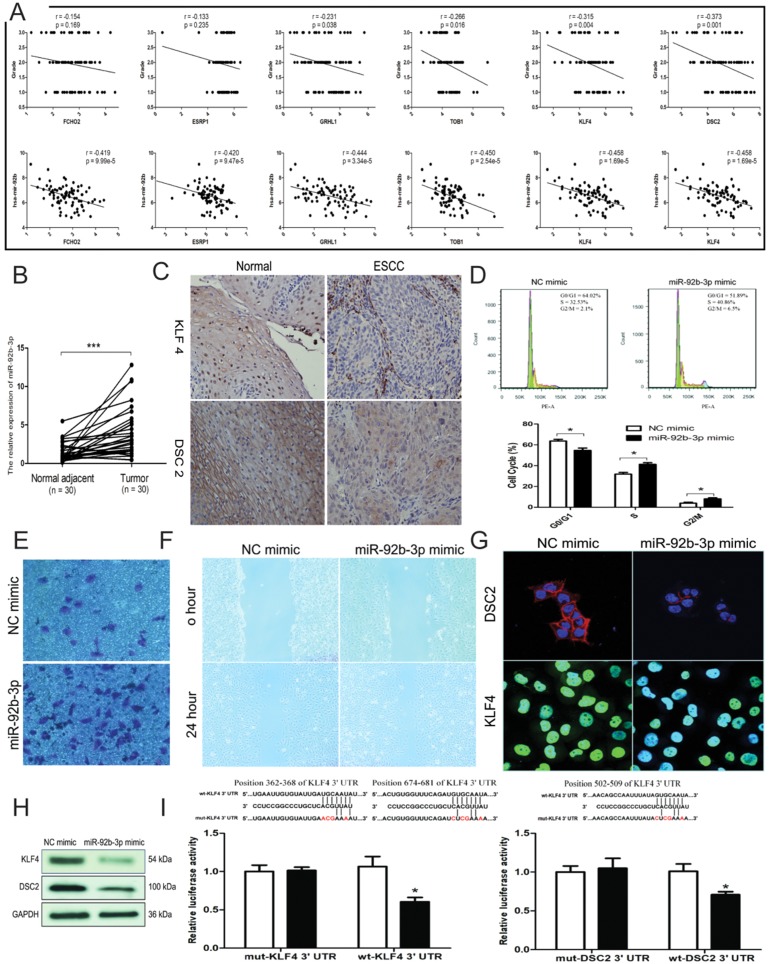
Results: In total, 4,023 DEGs and 328 DEMs were screened. After checking good genes and samples, 3,841 genes (3,696 DEGs and 145 DEMs) were used for WGCNA. As a consequence, altogether 11 gene modules were found. Among them, the brown modules were found to be strongly inversely associated with pathological grade. Meanwhile, has-mir-92b, the only miRNA in brown module, had a positive correlation with grade and negatively correlated with potential target gene (KFL4 and DCS2) in the same module. Furthermore, an increased expression of miR-92b-3p and down-regulated KLF4 and DSC2 protein was detected in the ESCC clinical samples. Up-regulated miR-92b-3p shortened G0/G1 phase and promote ESCC cells invasion and migration. Furthermore, we verified that DSC2 and KFL4 was target genes of miR-92b-3p by luciferase report assay.

Conclusion: WGCNA is an efficient approach to system biology. By this procedure, miR-92b-3p was identified as an ESCC-promoting gene by target KLF4 and DCS2.

Keywords: DSC2; ESCC; KLF4; WGCNA; bioinformatics; esophageal squamous cell carcinoma; mir-92b; weighted gene co-expression network analysis.


Conflict of interest statement

The authors report no conflicts of interest in this work.

Figures

Figure 1
Figure 1
Identification of differently expressed genes (DEGs) and microRNA (miRNA) in ESCC. Volcano map of differently expressed genes or miRNA between ESCC and normal tissues based on GPL570 (A), GPL571 (C), GPL96 (E), GPL97 (G), and GPL14613 (K). Heatmap of the top 50 up-regulated and 50 down-regulated genes or miRNA based on GPL570 (B), GPL571 (D), GPL96 (F), GPL97 (H), and GPL14613 (L). The Venn plot of up-regulated expressed protein-coding genes (I) and down-regulated expressed protein-coding genes (J).
Figure 2
Figure 2
GO and KEGG enrichment analysis of co.DEGs and DEMs. (A) The GO terms in the enrichment analysis of the co.DEGs and DEMs. (B) The KEGG pathways in the enrichment analysis of the co.DEGs and DEMs.
Figure 3
Figure 3
WGCNA of esophageal squamous cell carcinoma. (A) Cluster result and clinic information of data samples. (B) Determination of soft threshold β of the adjacency function in the WGCNA algorithm. The left panel shows the scale-free topology fitting index (R2, y-axis) as a function of the soft-thresholding power (x-axis). The right panel displays the mean connectivity (degree, y-axis) as a function of the soft-thresholding power (x-axis). Red Arabic numerals in the panels denote different soft-thresholds. The red line in left panel means R2=0.9. There is a trade-off between maximizing scale-free topology model fit (R2) and maintaining a high mean number of connections. Thus, we set β=6. (C) Construction of the gene co-expression network. Each color represents a certain gene module. (D) Clustering tree based on the module eigengenes of modules.
Figure 4
Figure 4
WGCNA identified critical modules correlating with pathological parameters. (A) Correlation between modules and traits. The upper number in each cell refers to the correlation efficient of each module in the trait, and the lower number is the corresponding p-value. The top seven Gene Ontology (GO) biological process (BP) terms in the enrichment analysis of genes in the turquoise (B) and brown modules (C), the gene symbol listed in the figures were co.DEGs included in specific BP term; the top eight Kyoto Encyclopedia of Genes and Genomes (KEGG) pathways in the enrichment analysis of genes in the turquoise (D) and brown modules (E).
Figure 5
Figure 5
Hub-based analysis. (A, B) scatter plots of gene significance (GS) for pathological grade versus the module membership (MM) in the turquoise (A) and brown (B) modules. (C, D) The cytoscape network visualization of genes in turquoise (C) and brown (D) modules, in which only edges with weight (W) above a threshold of 0.1 are displayed, respectively. The diamond nodes denote the hub genes which were the 10% of genes with the highest connectivity. The nodes with turquoise border denote the differentially expressed genes based all platforms (co.DEG), the color of nodes represent the log2 Fold Change (FC) value. (EH) The correlation between pathology grade and has-let-7i (E), has-mir-181c (F), has-mir-181d (G), or has-mir-92b (H); (IL) top 50 significantly inverse correlated genes with has-let-7i (I), has-mir-181c (J), has-mir-181d (K), and has-mir-92b (L). Brown nodes denote the genes included in brown module, the blue nodes denote the genes classified to the other modules.
Figure 6
Figure 6
Expression and role of oncogenic miRNA-92b-3p in esophageal squamous cell carcinoma. (A) Upper panel: The correlation between pathological grade and the expression of potential target genes. Down panel: The correlation between expression of has-mir-92b and the expression of potential target genes. (B) The expression level of miR-92b-3p is significantly up-regulated in ECSS tumor tissue compared to normal adjacent tissue; ***p<0.001; (C) Representative images of positive staining of DSC2 and KLF4 in normal tissues (left) and negative staining of DSC2 and KLF4 in cancer tissues (right). (D) Cell cycle progression was assayed by flow cytometry after transfection with miR-92b mimic for 48h, *p<0.05. (E) The invasive ability of cell lines was performed by transwell assay. (F) Cell migratory ability as determined using wound healing assay. (G, H) immunofluorescence (G) and Western blot (H) analysis was performed for DSC2 and KLF4 expression in ECA-109 cells after transfection with miR-92b-3p mimic or negative control mimic. (I) relative luciferase activity of ECA-109 cells after co-transfection with wild type (wt) or mutant (mut) KLF4(left) and DSC2(right) 3′-UTR reporter genes and miR-92b-3p mimics, *p<0.05.

References

    1. Ferlay J, Soerjomataram I, Dikshit R, et al. Cancer incidence and mortality worldwide: sources, methods and major patterns in GLOBOCAN 2012. Int J Cancer. 2015;136(5):E359–E386. doi:10.1002/ijc.29210 - DOI - PubMed
    1. Kim KH, Chang JS, Cha JH, et al. Optimal adjuvant treatment for curatively resected thoracic esophageal squamous cell carcinoma: a radiotherapy perspective. Cancer Res Treat. 2017;49(1):168–177. doi:10.4143/crt.2016.142 - DOI - PMC - PubMed
    1. Umar SB, Fleischer DE. Esophageal cancer: epidemiology, pathogenesis and prevention. Nat Clin Pract Gastroenterol Hepatol. 2008;5(9):517–526. doi:10.1038/ncpgasthep1223 - DOI - PubMed
    1. Siegel R, Ma J, Zou Z, Jemal A. Cancer statistics, 2014. CA Cancer J Clin. 2014;64(1):9–29. doi:10.3322/caac.21208 - DOI - PubMed
    1. Butter R, Lagarde SM, van Oijen MGH, et al. Treatment strategies in recurrent esophageal or junctional cancer. Dis Esophagus. 2017;30(9):1–9. doi:10.1093/dote/dox082 - DOI - PubMed