

dGEMRIC and CECT Comparison of Cationic and Anionic Contrast Agents in Cadaveric Human Metacarpal Cartilage
- PMID: 31687789
- PMCID: PMC7071952
- DOI: 10.1002/jor.24511
dGEMRIC and CECT Comparison of Cationic and Anionic Contrast Agents in Cadaveric Human Metacarpal Cartilage
Abstract
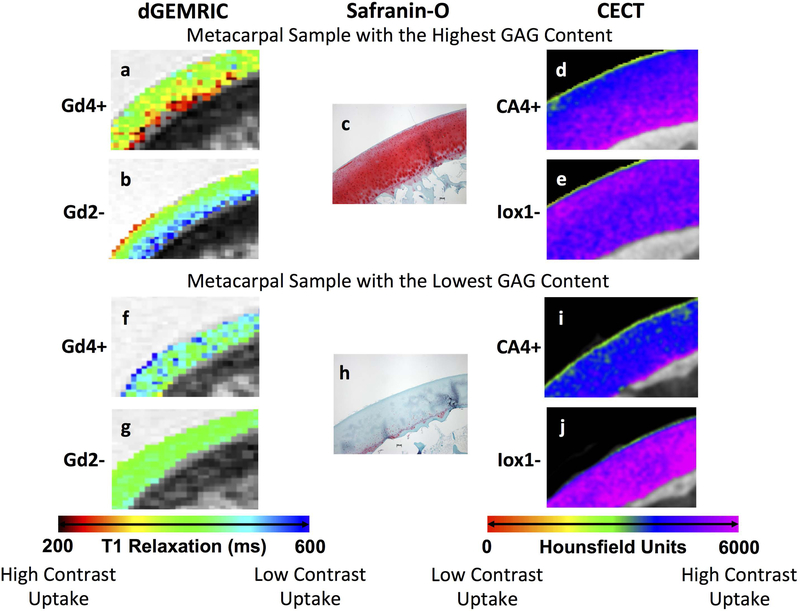
Magnetic resonance imaging (MRI) and computed tomography (CT) are widely used to image cartilage and their diagnostic capability is enhanced in the presence of contrast agents. The aim of the study is to directly compare the performance between commercial anionic MRI (Gd(DTPA), Gd2-) and CT (Ioxaglate, Iox1-) contrast agents with novel cationic MRI (Gd(DTPA)Lys2 , Gd4+) and CT (CA4+) contrast agents for assessment of cartilage mechanical and biochemical properties using the ex vivo human osteoarthritis metacarpal cartilage model. First, indentation testing was conducted to obtain the compressive modulus of the human fifth metacarpals. The samples were then immersed in the anionic and cationic contrast agents prior to delayed gadolinium-enhanced MRI of cartilage and CT scanning, respectively. The cartilage glycosaminoglycan (GAG) content and distribution were determined using the 1,9-dimethylmethylene blue assay and Safranin-O histology. Cationic agents significantly accumulate in cartilage compared with anionic agents. Significant positive correlations (p < 0.05) exist between imaging results of cationic agents and GAG content (Gd4+: R2 = 0.43; CA4+: R2 = 0.67) and indentation equilibrium modulus (Gd4+: R2 = 0.48; CA4+: R2 = 0.77). Significant negative correlations are observed between anionic MRI relaxation times, but not contrast-enhanced computed tomography attenuation and cartilage GAG content (Gd2-: R2 = 0.56, p < 0.05; Iox1-: R2 = 0.31, p > 0.05) and indentation equilibrium modulus (Gd2-: R2 = 0.38, p < 0.05; Iox1-: R2 = 0.17, p > 0.05). MRI or CT with cationic contrast agents provides greater sensitivity than their anionic analogs at assessing the biochemical and biomechanical properties of ex vivo human metacarpal cartilage. © 2019 Orthopaedic Research Society. Published by Wiley Periodicals, Inc. J Orthop Res 38:719-725, 2020.
Keywords: computed tomography arthrography (CTa); equilibrium partitioning of an iodinated contrast agent (EPIC); glycosaminoglycan; magnetic resonance imaging; osteoarthritis.
© 2019 Orthopaedic Research Society. Published by Wiley Periodicals, Inc.
Conflict of interest statement
COMPETING INTERESTS
The authors have no competing interests.
Figures


References
-
- Felson DT; Lawrence RC; Dieppe PA; Hirsch R; Helmick CG; Jordan JM; Kington RS; Lane NE; Nevitt MC; Zhang Y; Sowers M; McAlindon T; Spector TD; Poole AR; Yanovski SZ; Ateshian G; Sharma L; Buckwalter JA; Brandt KD; Fries JF Osteoarthritis: new insights. Part 1: the disease and its risk factors Annals of Internal Medicine 2000, 133, 635. - PubMed
-
- Mow VC; Ratcliffe Anthony; Poole AR Cartilage and diarthrodial joints as paradigms for hierarchical materials and structures Biomaterials 1992, 13, 67. - PubMed
-
- M H; S T; F L. Anatomy, biochemistry, and physiology of articular cartilage. Invest. Radiol 2000, 35, 573. - PubMed
Publication types
MeSH terms
Substances
Grants and funding
LinkOut - more resources
Full Text Sources
