. 2019 Dec 19;4(24):e131273.
doi: 10.1172/jci.insight.131273.

Exosomes from mesenchymal stromal cells reduce murine colonic inflammation via a macrophage-dependent mechanism

Affiliations

Exosomes from mesenchymal stromal cells reduce murine colonic inflammation via a macrophage-dependent mechanism

Huashan Liu et al. JCI Insight. .

Abstract

Conventional treatments for inflammatory bowel disease (IBD) have multiple potential side effects. Therefore, alternative treatments are desperately needed. This work demonstrated that systemic administration of exosomes from human bone marrow-derived mesenchymal stromal cells (MSC-Exos) substantially mitigated colitis in various models of IBD. MSC-Exos treatment downregulated inflammatory responses, maintained intestinal barrier integrity, and polarized M2b macrophages but did not favor intestinal fibrosis. Mechanistically, infused MSC-Exos acted mainly on colonic macrophages, and macrophages from colitic colons acquired obvious resistance to inflammatory restimulation when prepared from mice treated with MSC-Exos versus untreated mice. The beneficial effect of MSC-Exos was blocked by macrophage depletion. Also, the induction of IL-10 production from macrophages was partially involved in the beneficial effect of MSC-Exos. MSC-Exos were enriched in proteins involved in regulating multiple biological processes associated with the anticolitic benefit of MSC-Exos. Particularly, metallothionein-2 in MSC-Exos was required for the suppression of inflammatory responses. Taken together, MSC-Exos are critical regulators of inflammatory responses and may be promising candidates for IBD treatment.

Keywords: Inflammatory bowel disease; Stem cell transplantation; Stem cells; Therapeutics.


Conflict of interest statement

Conflict of interest: The authors have declared that no conflict of interest exists.

Figures

Figure 1
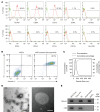
Figure 1. Characterization of MSC-Exos.
Three independent experiments were performed and yielded similar results. (A) Flow cytometry analysis showing the phenotypic markers of passage 5 MSCs cultured in medium supplemented with 10% exosome-depleted fetal bovine serum (FBS). Numerical values denote the percentage of positive cells. (B) Flow cytometry analysis for PI and Annexin V of MSCs cultured in exosome-depleted FBS medium. The apoptosis of MSCs was induced by 10 μM etoposide as a positive control. Numerical values denote the percentage of apoptotic cells (Annexin V+). (C) Size profile of MSC-Exos by PMX. (D) TEM analysis of MSC-Exos. TEM using negative staining with uranyl acetate (left) and tungstophosphoric acid (right). Scale bars: 200 nm (left), 50 nm (right). (E) Western blot analysis of TSG101 and CD9. Extracts of MSC-Exos were exposed to Triton X-100 plus proteinase K (PK) or PK alone. MW, molecular weight.
Figure 2
Figure 2. MSC-Exos protect against DSS-induced colitis.
Male C57BL/6 mice at 6–8 weeks of age (n = 12–20 mice per group from 2 independent but reproducible experiments) were subjected to 5% DSS in the drinking water for 7 days, and MSC-Exos (200 μg/mouse) were infused intravenously on day 2 (arrow in A). DAI scores from body weight loss, stool consistency and blood (A) and body weight (B) were recorded daily. (C) Measurements of colon length from mice on day 7. (D) Histopathological changes in colon tissues analyzed by hematoxylin and eosin (HE) staining on day 7. Original magnification, ×100 (upper), ×200 (lower). (E) Semiquantitative scoring of histopathology performed as described in the Supplemental Methods (supplemental material available online with this article; https://doi.org/10.1172/jci.insight.131273DS1). (F) Neutrophil infiltration determined by measuring colonic MPO activity on day 7. The number of animals studied is shown in each figure. ***P ≤ 0.001, by Mann-Whitney U test (A and E) or 1-way ANOVA (B, C, and F).
Figure 3
Figure 3. Anticolitic benefit of MSC-Exos in DSS-induced chronic and recurrent colitis.
Male C57BL/6 mice at 6–8 weeks of age (n = 20 mice per group) were subjected to 3% DSS in the drinking water in a cyclic manner. Each cycle consisted of 7 days of DSS followed by a 7-day phase without DSS supplementation. MSC-Exos (200 μg/mouse) were infused intravenously on day 7 or on days 7 and 16 (arrows in A). DAI (A) and mortality (B) were recorded. (C) Measurements of colon lengths. (D) Histopathological changes. Original magnification, ×100 (left), ×200 (right). (E) Semiquantitative scoring of histopathology. (F) Neutrophil infiltration determined by measuring colonic MPO activity on day 28. The number of animals studied is shown in each figure. *P ≤ 0.05, **P ≤ 0.01, and ***P ≤ 0.001, by Kruskal-Wallis test (A, E, and F), log-rank test (B), or 1-way ANOVA (C).
Figure 4
Figure 4. MSC-Exos reduce mucosal inflammatory responses and contribute to the maintenance of intestinal barrier integrity.
(AE) ELISAs for IFN-γ, IL-1β, IL-6, TNF-α, and IL-10 in colonic tissues (n = 5 mice per group). For FH, 5% DSS-colitic mice were killed on day 7 for next detections. (F) FITC-dextran levels in serum 4 hours after oral gavage with FITC-dextran (50 mg/100 g body weight) (n = 6 mice per group). (G) Bacterial counts in colons from mice with or without MSC-Exos treatment (n = 6 mice per group). (H) Quantitative real-time PCR showing expression of antimicrobial peptides in colon samples, including Lyz1, Defa20, Defa29, and Ang4, with Actb as a housekeeping gene (n = 6 mice per group). *P ≤ 0.05, **P ≤ 0.01, *and **P ≤ 0.001, by 2-tailed Student’s t test (AE) or 1-way ANOVA (FH).
Figure 5
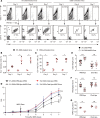
Figure 5. The anticolitic benefit of MSC-Exos in DSS-colitic mice is macrophage dependent.
PKH26-labeled MSC-Exos (200 μg per mouse) were intravenously administrated to mice on day 2 during the 7-day 5% DSS administration. Mice were sacrificed on days 3, 5, and 7 for tracking analysis. (A) Upper: The frequency of PKH26+ intestinal cells dissociated from DSS-treated or untreated mice (1 million cells were detected in each colon). Numerical values denote the mean percentage of exosome-positive (PKH26+) intestinal cells. Lower: Flow cytometric profiles of F4/80 and CD11b expression in PKH26+ cells. Numerical values denote the mean percentage of PKH26+ cells expressing CD11b and F4/80. (B) The quantification of PKH26+ cells. (C) The quantification of PKH26+ cells expressing F4/80 and CD11b. n = 3–4 mice per group for AC. For DG, mice received Clod-lipos or PBS-lipos according to the schematic flowchart (see Supplemental Figure 3A), and MSC-Exos (200 μg per mouse) were infused intravenously on day 2 (arrow in D). Colitis was assessed by DAI (D) daily. On day 7, mice were sacrificed, and colon lengths (E), histopathological scores (F), and colonic MPO activity (G) were determined. n = 12–15 mice per group for DF and n = 5 for G. *P ≤ 0.05, **P ≤ 0.01, ***P ≤ 0.001, and ns indicates P > 0.05, by 2-tailed Student’s t test (B, C, E, and G) or Mann-Whitney U test (D and F).
Figure 6
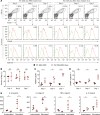
Figure 6. MSC-Exos reduce mucosal inflammation by polarizing M2b macrophages.
(A) Upper: Percentage of cells expressing F4/80+CD11b+ in lamina propria of colons at the indicated time. Numerical values denote the mean percentage of F4/80+CD11b+ macrophages (Mφ) in lamina propria of colons. Middle and lower: Expression of CD206 and arginase-1 in macrophages. Numerical values denote the relative mean fluorescence intensity (RelMFI) normalized to fluorescence minus 1 control. Quantification of macrophages (B) and of macrophages expressing CD206 (C) and arginase-1 (D) in the lamina propria of colons. n = 3 mice/group in AD. (E) The cytokine contents in culture supernatants of F4/80+ macrophages isolated at day 7 from 5% DSS-colitic mice with or without MSC-Exos treatment on ex vivo 24-hour culture with or without 100 ng/mL LPS restimulation (n = 4 mice/group). *P ≤ 0.05, **P ≤ 0.01, and ns indicates P > 0.05, by 2-tailed Student’s t test (BE).
Figure 7
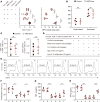
Figure 7. The anticolitic benefit of MSC-Exos is partially dependent on macrophage-derived IL-10.
(A) Intermediate DAI and colonic MPO activity in mice receiving MSC-Exos plus an antibody against IL-10 compared to DSS- and MSC-Exos plus DSS–treated mice (n = 8 mice per group). (B) CD4+ T cells isolated from MLNs of 5% DSS-colitic mice at day 7 were ex vivo cultured with or without MSC-Exos (30 μg/mL) for 2 days. After restimulation with or without 5 μg/mL PHA for 24 hours, the cytokine IL-10 was determined in culture supernatants (n = 4 mice per group). (C) CD4+ T cells isolated from human peripheral blood mononuclear cells were treated with or without MSC-Exos (30 μg/mL) for 2 days, and Th1 and Th2 flow cytometric profiles were determined (n = 4 independent experiments). (DH) Human peripheral blood monocyte–derived macrophages were cultured with MSC-Exos (30 μg/mL) or IL-4 (20 ng/mL) for 2 days. Cells were harvested and cocultured with human peripheral blood–derived CD4+ T cells at a ratio of 1:10 stimulated with PHA (5 μg/mL) using a transwell system in the presence or absence of anti–IL-10 antibodies (10 μg/mL) or an isotype-matched IgG control. (D) The study design for the coculture experiments shown in EH. (E) Proliferation of 5,6-carboxyfluorescein diacetatesuccinimidyl ester–labeled (CFSE-labeled) CD4+ T cells assessed after 3-day coculture by flow cytometry. Numbers denote the percentage of cells undergoing at least 1 cellular division (mean ± SD, n = 4 independent experiments). (F) Quantification of proliferation of CFSE-labeled CD4+ T cells in E. (G and H) After 3-day coculture, CD4+ T cells were harvested and restimulated with PHA (5 μg/mL) for 24 hours, and then TNF-α and IFN-γ contents were measured in supernatants by ELISA (n = 5 independent experiments). *P ≤ 0.05, **P ≤ 0.01, ***P ≤ 0.001, and ns indicates P > 0.05, by Kruskal-Wallis test (A), 2-tailed Student’s t test (B and C), or 1-way ANOVA (F, G, and H).
Figure 8
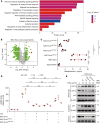
Figure 8. MSC-Exos reduce inflammatory responses in macrophages by transporting metallothionein-2.
(A) Biological processes (Gene Ontology terms) related to anticolitic benefit. (B) Volcano plot showing the differential abundance of protein expression in MSC-Exos compared with the corresponding supernatants of exosome depletion. The vertical dotted lines correspond to 2-fold increase and decrease, respectively, and the horizontal dotted line represents a P value of 0.05. Metallothionein-2 is annotated on the volcano plot by the red point. n = 3 in A and B. (C) The levels of metallothionein-2. Supernatants of MSCs were depleted of exosomes by ultracentrifugation, and all samples were adjusted to have an equal total protein concentration; then ELISAs were performed. n = 4 independent experiments. (D) mRNA levels of TNF, IL6, and IL1B in macrophages derived from human peripheral blood monocytes treated with 30 μg/mL MSC-Exos or MSC-ExossiMOCK or MSC-ExossiMT2A#2 for 2 days, then stimulated with LPS (100 ng/mL) during the last 4 hours, with 18S rRNA as a housekeeping gene. n = 3 independent experiments. (E) Representative immunoblot for phosphorylated IκBα (p-IκBα), total IκBα (t-IκBα), and p65 subunit from whole-cell, nuclear, and cytoplasmic extracts in macrophages that were treated for 2 days, with the indicated dose of MSC-Exos from MSCs that were untransfected (Un), mock transfected (Mock-si), or transfected with MT2A-siRNAs (MT2A-si). Three independent experiments were performed and yielded similar results. β-actin and Lamin A served as loading controls. **P ≤ 0.01; ***P ≤ 0.001; ns indicates P > 0.05, by Kruskal-Wallis test (C and D).

References

    1. Ng SC, et al. Worldwide incidence and prevalence of inflammatory bowel disease in the 21st century: a systematic review of population-based studies. Lancet. 2018;390(10114):2769–2778. - PubMed
    1. Zheng XB, et al. Engulfment and cell motility protein 1 protects against DSS-induced colonic injury in mice via Rac1 activation. J Crohns Colitis. 2019;13(1):100–114. doi: 10.1093/ecco-jcc/jjy133. - DOI - PubMed
    1. West NR, et al. Oncostatin M drives intestinal inflammation and predicts response to tumor necrosis factor-neutralizing therapy in patients with inflammatory bowel disease. Nat Med. 2017;23(5):579–589. doi: 10.1038/nm.4307. - DOI - PMC - PubMed
    1. Renna S, Cottone M, Orlando A. Optimization of the treatment with immunosuppressants and biologics in inflammatory bowel disease. World J Gastroenterol. 2014;20(29):9675–9690. doi: 10.3748/wjg.v20.i29.9675. - DOI - PMC - PubMed
    1. Forbes GM, et al. A phase 2 study of allogeneic mesenchymal stromal cells for luminal Crohn’s disease refractory to biologic therapy. Clin Gastroenterol Hepatol. 2014;12(1):64–71. doi: 10.1016/j.cgh.2013.06.021. - DOI - PubMed

Publication types

MeSH terms