Observational Study
. 2019 Dec 19;4(24):e125884.
doi: 10.1172/jci.insight.125884.

NKp46-expressing human gut-resident intraepithelial Vδ1 T cell subpopulation exhibits high antitumor activity against colorectal cancer

Affiliations
Observational Study

NKp46-expressing human gut-resident intraepithelial Vδ1 T cell subpopulation exhibits high antitumor activity against colorectal cancer

Joanna Mikulak et al. JCI Insight. .

Abstract

γδ T cells account for a large fraction of human intestinal intraepithelial lymphocytes (IELs) endowed with potent antitumor activities. However, little is known about their origin, phenotype, and clinical relevance in colorectal cancer (CRC). To determine γδ IEL gut specificity, homing, and functions, γδ T cells were purified from human healthy blood, lymph nodes, liver, skin, and intestine, either disease-free, affected by CRC, or generated from thymic precursors. The constitutive expression of NKp46 specifically identifies a subset of cytotoxic Vδ1 T cells representing the largest fraction of gut-resident IELs. The ontogeny and gut-tropism of NKp46+/Vδ1 IELs depends both on distinctive features of Vδ1 thymic precursors and gut-environmental factors. Either the constitutive presence of NKp46 on tissue-resident Vδ1 intestinal IELs or its induced expression on IL-2/IL-15-activated Vδ1 thymocytes are associated with antitumor functions. Higher frequencies of NKp46+/Vδ1 IELs in tumor-free specimens from CRC patients correlate with a lower risk of developing metastatic III/IV disease stages. Additionally, our in vitro settings reproducing CRC tumor microenvironment inhibited the expansion of NKp46+/Vδ1 cells from activated thymic precursors. These results parallel the very low frequencies of NKp46+/Vδ1 IELs able to infiltrate CRC, thus providing insights to either follow-up cancer progression or to develop adoptive cellular therapies.

Keywords: Colorectal cancer; Gastroenterology; Immunology; Innate immunity; T cells.


Conflict of interest statement

Conflict of interest: BSS is a cofounder and shareholder of Lymphact – Lymphocyte Activation Technologies S.A.

Figures

Figure 1
Figure 1. Identification of a subset of NKp46+ intraepithelial Vδ1 T lymphocytes highly enriched in human healthy intestine.
(A) Representative example of flow cytometry dot plots showing the gating strategy used to identify viable CD45+/CD3+ γδ T lymphocyte both in intraepithelial (IEL) and lamina propria (LPL) compartments from specimens of human healthy colon. (B) Summary statistical graph showing within the CD45+/CD3+ lymphocytes the percentages of γδ IELs (n = 54 in white circles), γδ LPLs (n = 20 in gray circles) from human healthy colon specimens, and γδ peripheral blood mononuclear cells (PBMCs) (n = 26 in black circles) of healthy donors. (C) Summary statistical graph showing the expression percentage of CD69 and CD103 on γδ IELs (n = 20 in white circles), γδ LPLs (n = 15 in grey circles) from specimens of human healthy colon, and on γδ T cell from PBMCs (n = 20 in black circles) of healthy donors. (D) Summary statistical graph showing the expression percent of CD4, CD8, CD16, CD56, NKG2A, NKG2C, NKG2D, and killer immunoglobulin-like receptors (KIRs) on γδ IELs (n ≥ 13, white circles), γδ LPLs (n ≥ 10 in gray circles) from specimens of human healthy colon, and on γδ T cells from PBMCs of healthy donors (n ≥ 13, black circles). (E) Summary statistical graph showing the expression percent of NKp46, NKp30, and NKp44 on γδ IELs (n ≥ 25 in white circles), γδ LPLs (n ≥16 in gray circles) from specimens of human healthy colon, and on γδ T cells from PBMCs from healthy donors (n ≥25 in black circles). (F) Summary statistical analysis (upper graph) showing the expression of CD8α (white circles) and CD8β (black circles) chains within the CD8 receptor of matched CD8+ γδ IELs and CD8+/NKp46+ γδ IELs from specimens of human healthy colon (n = 15). White arrows indicate representative flow cytometry dot plots showing coexpression of CD8α and CD8β chains in CD8+ total γδ T (left) or NKp46+/γδ T IELs (right), respectively. (G) t-SNE graphs from a representative specimen of human healthy colon showing the clustering of NKp46 (C1 in blue) and NKp46+ (C2 in orange) γδ IELs within CD45+/CD3+ lymphocytes (gray; left panel) or in γδ T IELs (right panel). (H) Heatmap graph showing the degree of expression of several surface markers on matched NKp46 and NKp46+ γδ IEL clusters defined as C1 and C2 in panel G (n = 7). *P ≤ 0.05; **P ≤ 0.01; ***P ≤ 0.001; ****P ≤ 0.0001.
Figure 2
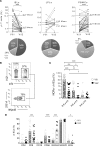
Figure 2. NKp46+ γδ IELs are Vδ1 restricted and express a cytotoxic phenotype.
(A) Summary statistical graphs (upper line) showing, within the entire CD45+/CD3+ lymphocyte population, the percentages of Vδ1 or Vδ2 IEL (n = 37) and LPL (n ≥ 22) subsets from specimens of human healthy colon and from PBMCs (n = 49) of healthy donors. Data are represented as scattered plots of paired observations. Pie charts showing the percentages of Vδ1+, Vδ2+, and Vδ1/Vδ2 subsets within total γδ T cells of matched samples (n = 10) of IELs and LPLs from specimens of human healthy colon and PBMCs of healthy donors. (B) Representative examples (out of 38) of contour plots showing the percentages of Vδ1+ and Vδ2+ T cell subset (upper panel) and of NKp46+/Vδ1 T cells (lower panel) within total purified γδ IELs from a specimen of human healthy colon. (C) Summary statistical graph showing the frequencies of Vδ1 (white circles) and Vδ2 (black circles) IELs (n ≥ 20) from specimens of human healthy colon expressing NKp46, NKp44, and NKp30. (D) Summary statistical graph showing the frequencies of Vδ1 (white circles) and Vδ2 (black circles) IELs (n ≥ 16) from specimens of human healthy colon expressing CD4, CD8, CD16, CD56, NKG2A, NKG2D, and KIRs. *P ≤ 0.05; **P ≤ 0.01; ***P ≤ 0.001; ****P ≤ 0.0001.
Figure 3
Figure 3. TCR repertoires of NKp46+ and NKp46 γδ IELs.
(A) Treemap graphs showing the distribution of TRG clones within NKp46+ and NKp46 γδ IELs from 2 representative patients (out of 4). Squares represent individual clones and are proportional to the abundance of the given clone within the TCR repertoire. Color codes indicate V chain usage. CDR3 sequences of the most expanded clones are given. (B) Dot plot graph showing the quantification of V chains for TRG repertoires. Each dot represents 1 patient. (C) Treemap graphs showing the distribution of Vδ1+ TRD clones within NKp46+ and NKp46 IELs of 2 patients. Each square indicates 1 clone within the given TRD repertoires. J elements are color coded, and CDR3 sequences of the most expanded clones are indicated. (D) Dot plot graph showing the TRG and TRD diversity that is determined by the D50 score (number of clones within 50% of the given TCR repertoire). Each dot represents 1 patient. (E) Heatmap graph displaying the number of shared TRG (lower part, orange–yellow) and TRD (upper part, blue–yellow) clones between patient samples.
Figure 4
Figure 4. Effector functions of NKp46+ γδ IELs.
(A) Summary statistical graphs showing the transcript levels of NKp46, IL-10, IL-17, IL-22, TGF-β, and lymphotactin/XCL1 and in FACS-sorted NKp46+ and NKp46 γδ IELs from specimens of human healthy colon (n = 6) and in FACS-sorted γδ T cell from PBMCs of healthy donors (n = 6). Results are presented as fold changes (2–ΔΔCT) of target gene relative to PBMC samples and normalized to housekeeping genes GAPDH and S18. (BD) Summary statistical graphs showing the intracellular levels of IFN-γ (B), Granzyme B (GMZB) (C), and surface expression of CD107a (D) by NKp46+ and NKp46 γδ IELs from specimens of human healthy colon either in the absence (Ctrl) or in the presence of K562 cell lines. (E) Summary statistical graphs showing the surface expression of CD107a by NKp46+ γδ IELs from healthy colon either alone or in coculture with tumor target cells SKCO1 (left) and Caco2 (right). (F) Summary statistical graph showing the surface expression of CD107a by NKp46+ γδ IELs from healthy colon after coculture with K562 either in the absence or presence of a blocking anti–NKp46 IgM mAb (n = 7). *P ≤ 0.05; **P ≤ 0.01; ***P ≤ 0.001.
Figure 5
Figure 5. NKp46+/Vδ1 T cell expansion following activation of thymocyte precursors with IL-2 or IL-15.
(A) Summary statistical graphs showing the time course expression of NKp46 in γδ thymocyte precursors (n ≥ 5) cultured with IL-2 (200 U/mL) or IL-15 (10 ng/mL) or IL-7 (10 ng/mL). (B) Summary statistical graphs showing the frequencies of Vδ1 (left graph) and Vδ2 (right graph) thymocytes cultured either in absence (Ctrl) or presence of IL-2 for 6 days (n = 10). Data are represented as scattered plots of paired observations. (C) Summary statistical graphs showing the frequency of NKp46 expression on Vδ1 thymocytes cultured either in the absence (Ctrl) or in the presence of IL-2 for 6 days (n = 10). (D) Summary statistical graphs showing NCR expression in γδ and αβ thymocytes, as well as in γδ T cells from PBMCs of healthy donor, cultured either in absence (Ctrl) or in the presence of IL-2 for 6 days (n ≥ 5). *P ≤ 0.05; **P ≤ 0.01; ***P ≤ 0.001.
Figure 6
Figure 6. Phenotype and functions of human of NKp46+ γδ thymocyte precursors following activations with physiologic and pathologic stimuli.
(A) Summary statistical graphs showing the expression of CD4, CD8, CD56, NKG2A, NKG2D, CD16, and CCR9 on γδ thymocyte precursors (n ≥ 8) cultured either in the absence (Ctrl) or presence of IL-2. (B) Summary statistical graphs showing the CCL25 dose-dependent chemotaxis of FACS-sorted CCR9+/NKp46+ Vδ1 T cells generated from thymocyte precursors cultured with IL-2 for 6 days (n = 8). (C) Summary statistical graphs showing the transcripts levels of GZMB and NKp46 transcripts on freshly FACS-sorted thymocytes (Ctrl) and on NKp46+ and NKp46 Vδ1 T cells generated from thymocyte precursors cultured with IL-2 for 6 days (n = 6). Results are represented as the fold change (2–ΔΔCT) of target gene relative to a Ctrl samples and normalized to housekeeping genes GAPDH and S18. (D) Summary statistical graphs showing the expression of CD107a on NKp46+ and NKp46 Vδ1 T cells generated from thymocyte precursors cultured with IL-2 for 6 days either in the absence (Ctrl) or in the presence of K562 or Caco2 human tumor target cells (n ≥ 9). (E) Summary statistical graphs showing the NKp46 expression on freshly purified thymocytes (day 0) and on γδ thymocytes cultured with IL-2 for 6 days either in the absence (Ctrl) or in the presence of primary human colonic epithelial cells (HCoEpic) or IL-15, TGF-β, or Caco2 cell lines (n ≥ 8). *P ≤ 0.05; **P ≤ 0.01; ***P ≤ 0.001.
Figure 7
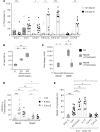
Figure 7. Clinical relevance of the NKp46+/Vδ1 subset in the pathogenesis of CRC.
(AD) Summary statistical graphs showing the frequencies of total γδ (A), Vδ1 and Vδ2 (B), NKp46+/Vδ1 (C), and NKp46+/Vδ2 (D) IEL subsets in healthy intestinal specimens from CRC patients in early (I–II) and late (III–IV) disease stages (n ≥ 17). (E and F) Summary statistical graphs showing the frequencies of total Vδ1 cells (E) and of the NKp46+/Vδ1 T cell subset (F) in both IEL and LPL compartments of healthy/disease-free intestine compared with those of infiltrating gut specimens of colon rectal cancer (CRC) (n ≥ 15). *P ≤ 0.05; ****P ≤ 0.0001.

References

    1. Mowat AM, Agace WW. Regional specialization within the intestinal immune system. Nat Rev Immunol. 2014;14(10):667–685. doi: 10.1038/nri3738. - DOI - PubMed
    1. Gopalakrishnan V, et al. Gut microbiome modulates response to anti-PD-1 immunotherapy in melanoma patients. Science. 2018;359(6371):97–103. doi: 10.1126/science.aan4236. - DOI - PMC - PubMed
    1. Deusch K, Lüling F, Reich K, Classen M, Wagner H, Pfeffer K. A major fraction of human intraepithelial lymphocytes simultaneously expresses the gamma/delta T cell receptor, the CD8 accessory molecule and preferentially uses the V delta 1 gene segment. Eur J Immunol. 1991;21(4):1053–1059. doi: 10.1002/eji.1830210429. - DOI - PubMed
    1. Chien YH, Meyer C, Bonneville M. γδ T cells: first line of defense and beyond. Annu Rev Immunol. 2014;32:121–155. doi: 10.1146/annurev-immunol-032713-120216. - DOI - PubMed
    1. Nielsen MM, Witherden DA, Havran WL. γδ T cells in homeostasis and host defence of epithelial barrier tissues. Nat Rev Immunol. 2017;17(12):733–745. doi: 10.1038/nri.2017.101. - DOI - PMC - PubMed

Publication types

MeSH terms

Substances