. 2019 Nov 5;14(11):e0224650.
doi: 10.1371/journal.pone.0224650. eCollection 2019.

The mutational landscape of quinolone resistance in Escherichia coli

Affiliations

The mutational landscape of quinolone resistance in Escherichia coli

Kamya Bhatnagar et al. PLoS One. .

Abstract

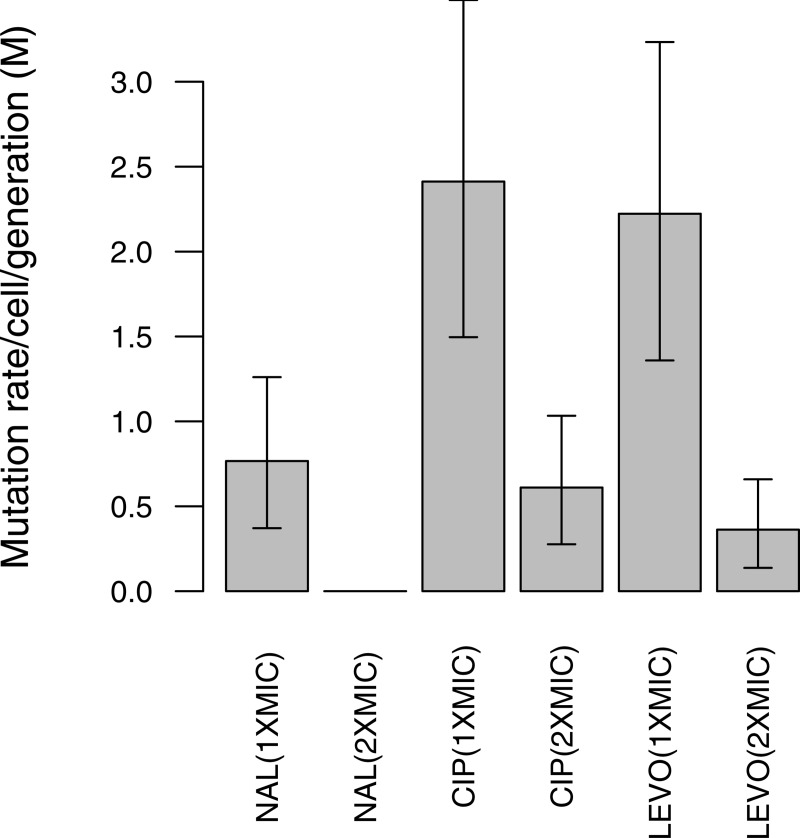
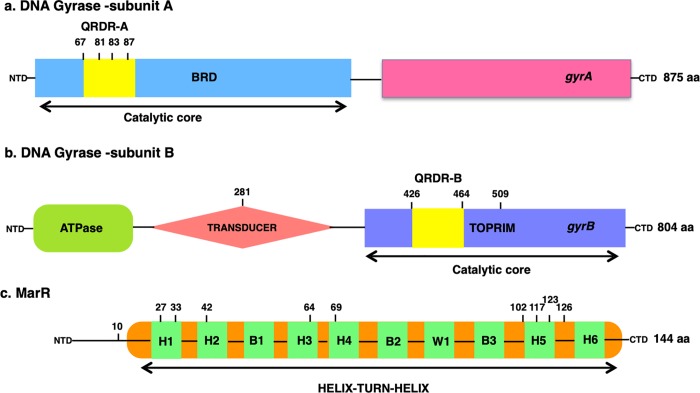
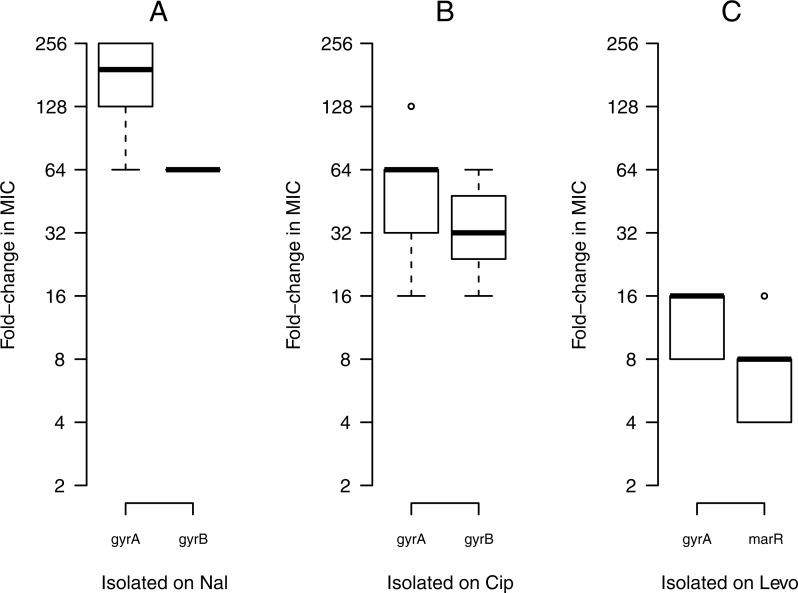
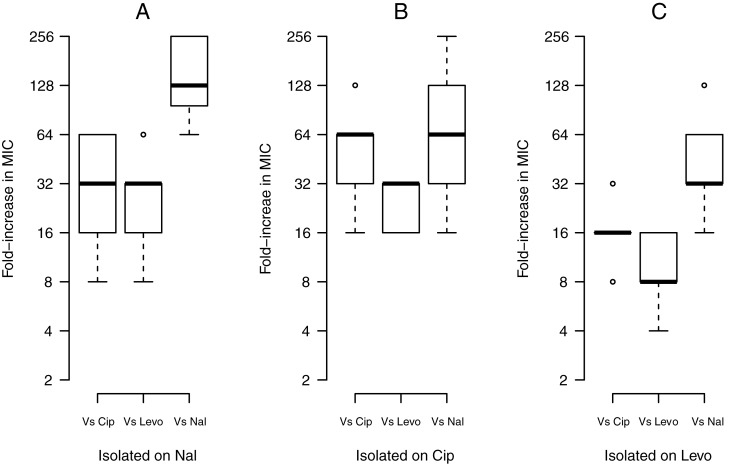
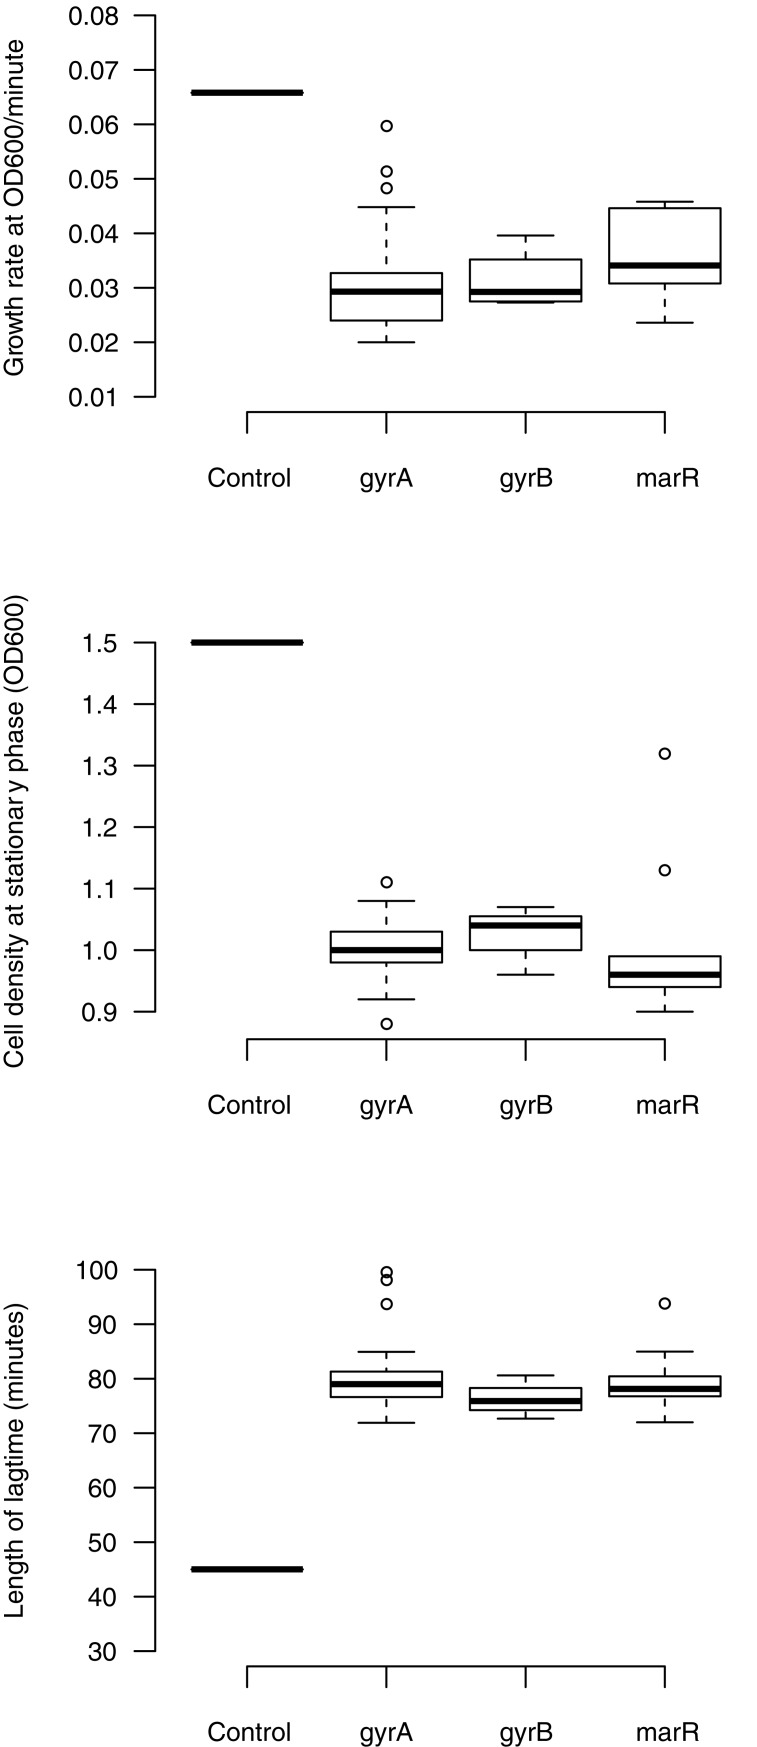
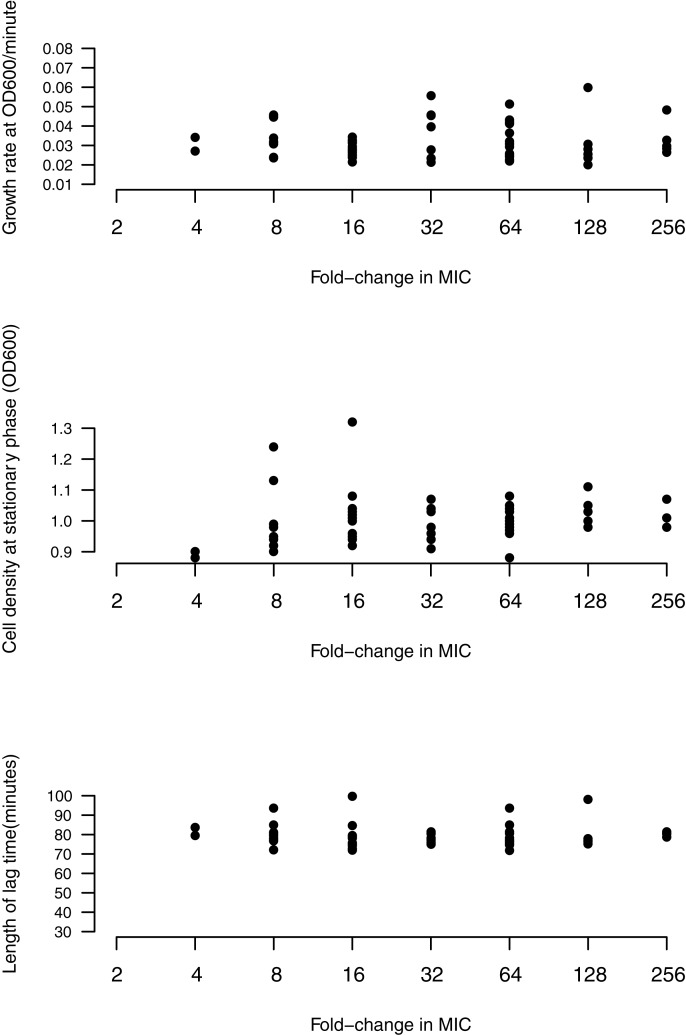
The evolution of antibiotic resistance is influenced by a variety of factors, including the availability of resistance mutations, and the pleiotropic effects of such mutations. Here, we isolate and characterize chromosomal quinolone resistance mutations in E. coli, in order to gain a systematic understanding of the rate and consequences of resistance to this important class of drugs. We isolated over fifty spontaneous resistance mutants on nalidixic acid, ciprofloxacin, and levofloxacin. This set of mutants includes known resistance mutations in gyrA, gyrB, and marR, as well as two novel gyrB mutations. We find that, for most mutations, resistance tends to be higher to nalidixic acid than relative to the other two drugs. Resistance mutations had deleterious impacts on one or more growth parameters, suggesting that quinolone resistance mutations are generally costly. Our findings suggest that the prevalence of specific gyrA alleles amongst clinical isolates are driven by high levels of resistance, at no more cost than other resistance alleles.


Conflict of interest statement

The authors have declared that no competing interests exist.

Figures

Fig 1
Fig 1. Spontaneous mutation rate per 108 cells to quinolone resistance among E. coli K-12 (MG1655).
Mutation rates were estimated from 30 independent cultures at 1x and 2x MIC. Error bars represent 95% confidence intervals. Note that no colonies were obtained at 2xMIC for Nal.
Fig 2
Fig 2. The domain structures of Gyrase A, B, and MarR.
Mutations obtained in this study are indicated in bold above. Panel A: Arrangement of GyrA. This subunit of DNA gyrase consists of the breakage-reunion (BRD) domain, and the quinolone resistance determining region (QRDR-A) site. Panel B: Arrangement of GyrB, with the ATPase, Transducer (221–392), and Toprim (418–533) regions. The QRDR-B is shown within the Toprim domain of GyrB [73]. Panel C. MarR domain structure, comprising four helices (H) and three ß-sheets (B). H3 and H4 (57–80) are the recognition and DNA binding motifs containing H-T-H motifs and the ß-sheet winged structure. H1, H5, and H6 are associated with dimerization [,–76].
Fig 3
Fig 3. Direct responses to selection.
Changes in MIC for resistant mutants towards the drug on which they were selected: nal (A), cip (B), and levo (C). The boxplot presents the median, first, and third quartiles, with whiskers showing either the maximum (minimum) value or 1.5 times the interquartile range of the data, whichever is smaller (larger).
Fig 4
Fig 4. Cross-resistance between antibiotics.
Fold-increase in MIC of resistant mutants isolated on nal (A), cip (B), and levo (C) against all three antibiotics. The boxplot presents the median, first, and third quartiles, with whiskers showing either the maximum (minimum) value or 1.5 times the interquartile range of the data, whichever is smaller (larger).
Fig 5
Fig 5. Costs of resistance of quinolone resistant mutants.
The fitness components measured are growth rate, cell density, and lag time between gyrA, gyrB, and marR resistance mutations. All the fitness components are compared to control E. coli K-12 (MG1655). The boxplot presents the median, first, and third quartiles, with whiskers showing either the maximum (minimum) value or 1.5 times the interquartile range of the data, whichever is smaller (larger).
Fig 6
Fig 6. No correlation between level of resistance (fold-increase in MIC) and growth rate, cell density or length of lag phase for all mutants.

References

    1. Public health agency of Canada (PHAC). (2015–2016). Available from: http://www.phac-aspc.gc.ca/rpp/index-eng.php.
    1. Canadian antimicrobial resistance alliance (CARA). CANWARD susceptibility report. 2015. Available from:www.can-r.com.
    1. Piddock LJ. The crisis of no new antibiotics—what is the way forward? Lancet Infect Dis. 2012;12(3):249–253. 10.1016/S1473-3099(11)70316-4 - DOI - PubMed
    1. Bartlett JG, Gilbert DN, Spellberg B. Seven ways to preserve the miracle of antibiotics. Clin Infect Dis. 2013;56(10):1445–1450. 10.1093/cid/cit070 - DOI - PubMed
    1. Gross M. Antibiotics in crisis. Curr Biol. 2013;23(24):1063–1065. - PubMed

Publication types

MeSH terms

Grants and funding