. 2019 Nov 4;51(3):399-413.e7.
doi: 10.1016/j.devcel.2019.10.005.

Single-Cell Profiling Reveals Sex, Lineage, and Regional Diversity in the Mouse Kidney

Affiliations

Single-Cell Profiling Reveals Sex, Lineage, and Regional Diversity in the Mouse Kidney

Andrew Ransick et al. Dev Cell. .

Abstract

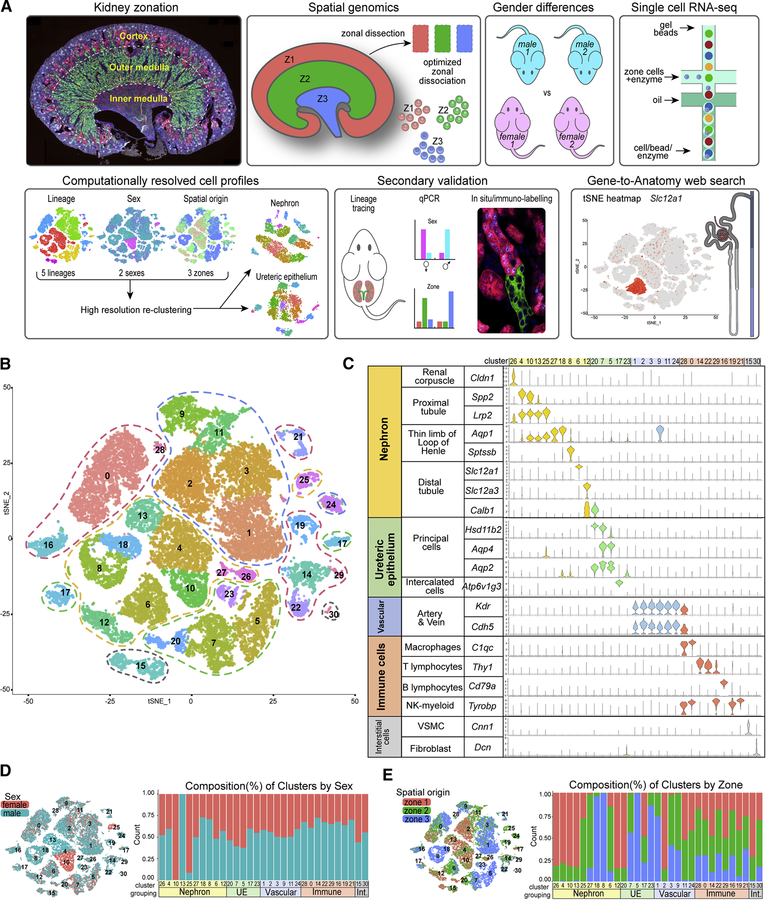
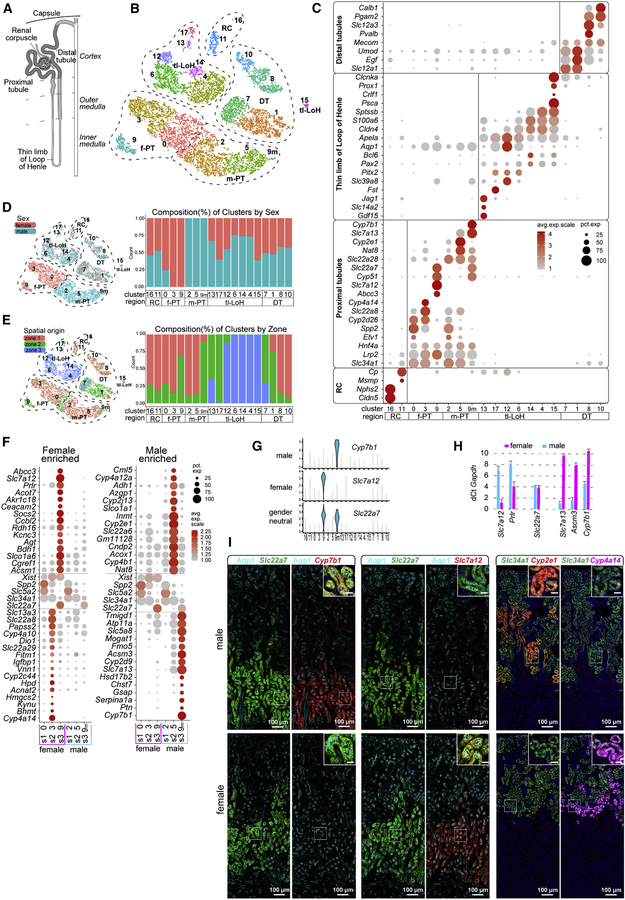
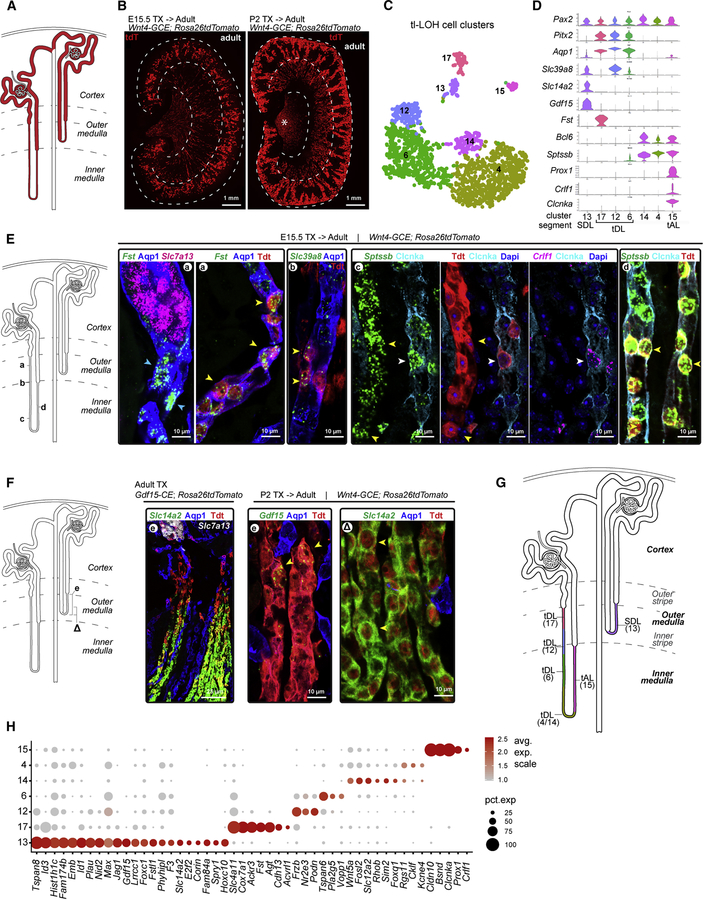
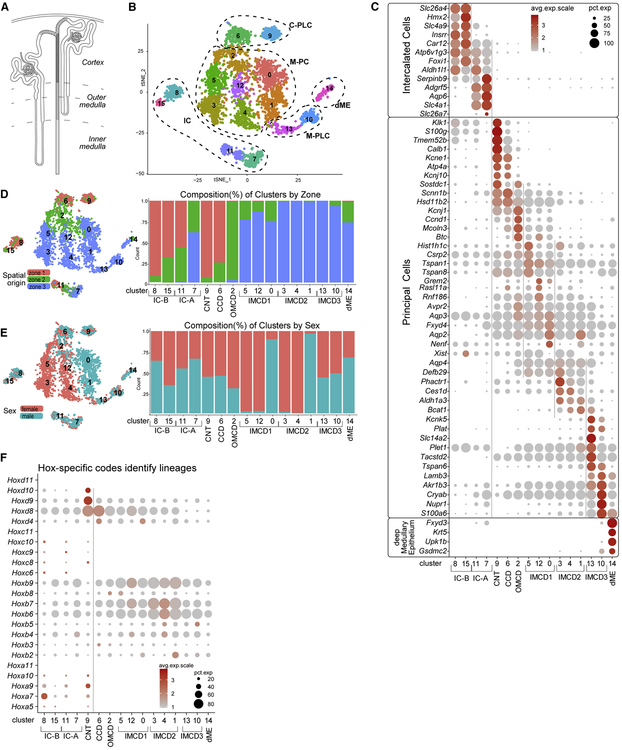
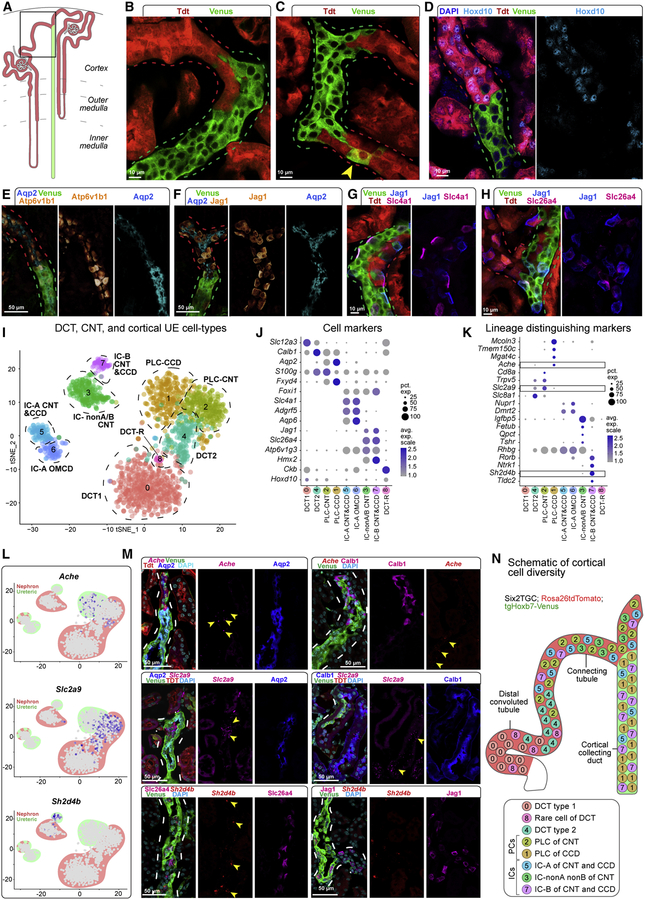
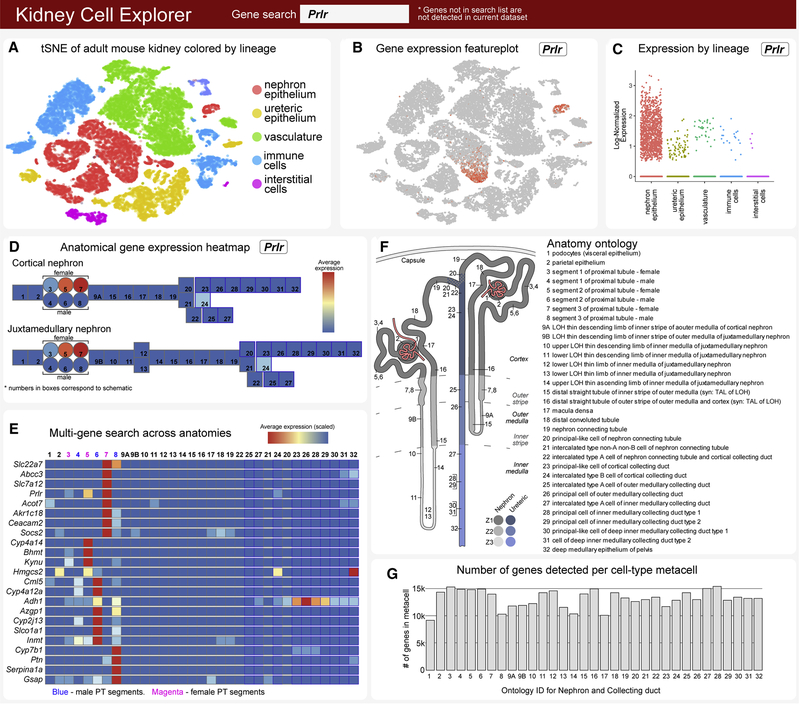
Chronic kidney disease affects 10% of the population with notable differences in ethnic and sex-related susceptibility to kidney injury and disease. Kidney dysfunction leads to significant morbidity and mortality and chronic disease in other organ systems. A mouse-organ-centered understanding underlies rapid progress in human disease modeling and cellular approaches to repair damaged systems. To enhance an understanding of the mammalian kidney, we combined anatomy-guided single-cell RNA sequencing of the adult male and female mouse kidney with in situ expression studies and cell lineage tracing. These studies reveal cell diversity and marked sex differences, distinct organization and cell composition of nephrons dependent on the time of nephron specification, and lineage convergence, in which contiguous functionally related cell types are specified from nephron and collecting system progenitor populations. A searchable database, Kidney Cell Explorer (https://cello.shinyapps.io/kidneycellexplorer/), enables gene-cell relationships to be viewed in the anatomical framework of the kidney.

Keywords: collecting system; kidney; lineage convergence; nephron; scRNA-Seq profiling; sex differences.


Conflict of interest statement

Declaration of competing interests:

The authors declare no conflict of interest.

Figures

Figure 1
Figure 1. An anatomy-directed map of cell diversity in the adult mouse kidney
A, Overview of methodology, data collection and analyses. B tSNE projection of adult mouse kidney scRNA-seq dataset annotated to five major cell-type groupings (dashed lines): nephron – yellow, ureteric – green, vascular – blue, immune – red, interstitial – gray. C, Violin plots of marker genes arranged by group and cell type, cluster numbers at top. D-E, tSNE and stacked barplots of adult mouse kidney dataset in (B), illustrating the distribution (left) and composition (right) of the clusters regarding sex (D) or zone (E). See also Figure S1
Figure 2
Figure 2. Sexual diversity within the nephron of the adult mouse kidney
A, Schematic showing a nephron (shaded) connecting (stippled) to the UE (un-shaded). B, tSNE projection of re-clustered N dataset using cells from primary annotation (yellow in Figure 1B). RC - renal corpuscle, tl-LoH - thin limbs- Loop of Henle, DT - distal tubules, PT - proximal tubules, male (m) or female (f). C, Dot plot of cluster enriched gene expression. D-E, tSNE and stacked barplots of N dataset illustrating the distribution (left) and composition (right) of clusters by sex (D) or zone (E). F, Dot plots of selected sex-biased gene expression in PT clusters. G, Violin plots of sex specific PT S3 genes. H, Quantitative PCR of sex-biased gene expression in the adult kidney. I, RNAscope in situs validate sex-biased gene expression in S3 and S2 segments of the proximal tubule. Inset scale bar = 20µm. See also Figure S2
Figure 3
Figure 3. Divergent cell fates and anatomies in the thin limbs of loop of Henle linked to developmental timing.
A, Schematic of juxtamedullary (left) and cortical nephrons (right); dashes demarcate boundaries of cortico-medullary zones. B, Views of adult kidneys showing nephron populations formed at ~E15.5 (left) or ~P2 (right) labelled using inducible lineage-tracing; see Methods for details; asterisk in (B) - non-nephron interstitium. C-D, Thin limbs of Loop of Henle (tl-LoH) cell clusters and violin plots of segment-identifying genes; cluster 15 repositioned here - compare with Fig 2B. SDL - short descending limb; tDL - thin descending limb; tAL - thin ascending limb; E-F, RNAscope validation of segmental markers for tl-LoH in juxtamedullary and cortical nephrons (E-F, respectively); Arrowheads: a, blue: Fst+/Apq1+; yellow: Fst+/Apq1+/tdT+; b, Slc39a8+/Apq1+/tdT+; c, yellow: Sptssb+/Crlf1/Clcnka/tdT; white: Sptssb+/Crlf1+/Clcnka+/tdT+; d, Sptssb+/Clcnka+/tdT+; E, Gdf15+/Aqp1/tdT+; ∆, Slc14a2+/Aqp1/tdT+. G, Schematic proposing anatomical organization and cell type identity of clusters shown in (C). H. Dot plot showing selected genes enriched in individual tl-LoH clusters. See also Figure S3
Figure 4
Figure 4. Anatomical, sex and cell diversity of ureteric epithelial groupings
A, Schematic showing nephron (unshaded) to UE (shaded) transition through connecting segment (stippled). B, tSNE projection of re-clustered UE dataset using cells from primary annotation (green in Figure 1B); C- and M-PLC, cortical and medullary principal-like cells; M-PC, medullary principal cells. C, Dot plots of cluster-enriched gene expression, annotating clusters as intercalated cells (IC) type A and B, connecting tubule (CNT), cortical collecting duct (CCD), outer and inner medullary collecting duct (OMCD, IMCD types1–3), and deep medullary epithelium (dME). D-E, tSNEs and barplots illustrating the distribution (left) and composition (right) of the cell clusters with respect to zonation (D) and sex (E). F, Dot plot summarizing Hox-gene expression across the UE dataset cell clusters. See also Figure S4
Figure 5
Figure 5. Dual origin for cortical principal and intercalated cell types
A, Schematic showing nephron (red) and ureteric (green) lineage labeling and region of focus (boxed). B-C, Lineage-tracing identifying nephron connections with the UE; arrowhead, co-labelled cell. D-H, Distribution of positional (Hoxd10), principal (Aqp2) and intercalated (Atp6v1b1, Jag1, Slc4a1 and Slc26a4) cell markers by immunostaining. I, tSNE projection of re-clustered cortical epithelial cell types from N and UE datasets. J, Dot plot of cluster enriched gene expression. K, Dot plot of lineage enriched gene sets; boxes show genes validated by RNAscope in situ. L-M, Feature plots and RNAscope validation of lineage distinguishing cell markers; yellow arrowheads, transcripts; dashed lines, tubule outlines. N, Schematic summary of cell types of the nephron and UE connection. See also Figure S5
Figure 6
Figure 6. Kidney Cell Explorer views - a searchable map of cell diversity in the adult mouse kidney
A, Field enabling selection of tSNE plot for whole kidney, nephron or ureteric epithelium dataset views. B, Field producing a feature plot of selected gene in active scRNASeq dataset. C, Field producing scatterplot of selected gene as expressed across sex, spatial origin or lineage in whole kidney dataset. D, Heatmap of gene expression for a single selected gene in metacells arranged as cortical and juxtamedullary nephron models. E, Heat map of gene expression for multi-gene searches in metacells of nephron and collecting duct. F, Schematic map indicating anatomic position and ontology terms for metacells in (D). G, Number of genes detected in each metacell in (D). See also Figure S8

Comment in

References

    1. Adam M, Potter AS and Potter SS (2017). Psychrophilic proteases dramatically reduce single-cell RNA-seq artifacts: A molecular atlas of kidney development. Development 144, 3625–3632. - PMC - PubMed
    1. Aufhauser DD Jr, Wang Z, Murken DR, Bhatti TR, Wang Y, Ge G, Redfield RR 3rd, Abt PL, Wang L, Svoronos N, et al. (2016). Improved renal ischemia tolerance in females influences kidney transplantation outcomes. J. Clin. Invest 126, 1968–77. - PMC - PubMed
    1. Bertram JF, Douglas-Denton RN, Diouf B, Hughson MD and Hoy WE (2011). Human nephron number: implications for health and disease. Pediatr. Nephrol 26, 1529–1533. - PubMed
    1. Bielesz B, Sirin Y, Si H, Niranjan T, Gruenwald A, Ahn S, Kato H, Pullman J, Gessler M, Haase VH et al. (2010). Epithelial Notch signaling regulates interstitial fibrosis development in the kidneys of mice and humans. J. Clin. Invest 120, 4040–4054. - PMC - PubMed
    1. Bonvalet J, Champion M, Courtalon A, Farman N, Vandewalle A and Wanstok F (1977). Number of glomeruli in normal and hypertrophied kidneys of mice and guinea-pigs. The Journal of Physiology, 269, 627–641. - PMC - PubMed

Publication types