. 2020;9(3):349-368.
doi: 10.1016/j.jcmgh.2019.10.010. Epub 2019 Nov 2.

A Functional Role of GAS6/TAM in Nonalcoholic Steatohepatitis Progression Implicates AXL as Therapeutic Target

Affiliations

A Functional Role of GAS6/TAM in Nonalcoholic Steatohepatitis Progression Implicates AXL as Therapeutic Target

Anna Tutusaus et al. Cell Mol Gastroenterol Hepatol. 2020.

Abstract

Background and aims: GAS6 signaling, through the TAM receptor tyrosine kinases AXL and MERTK, participates in chronic liver pathologies. Here, we addressed GAS6/TAM involvement in Non-Alcoholic SteatoHepatitis (NASH) development.

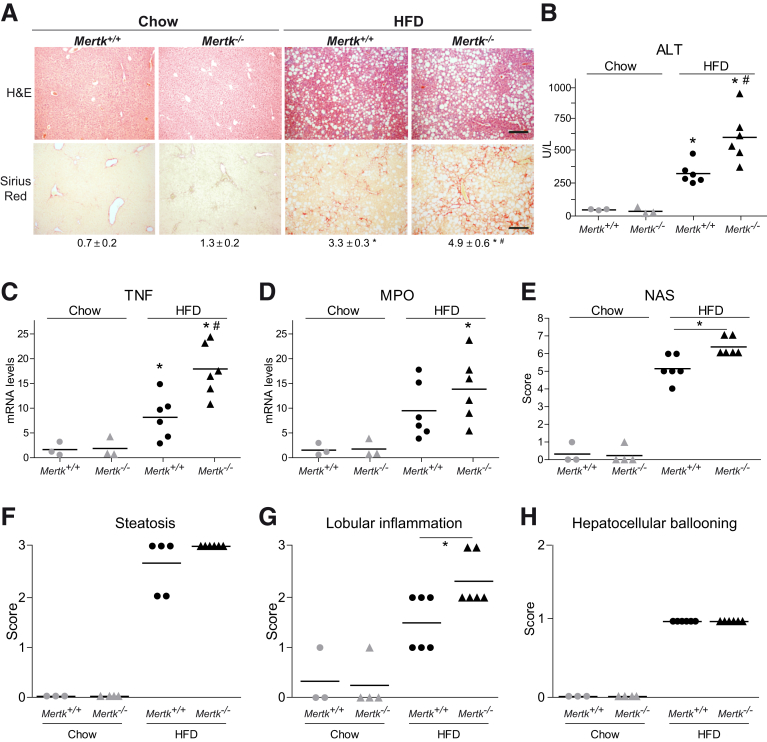
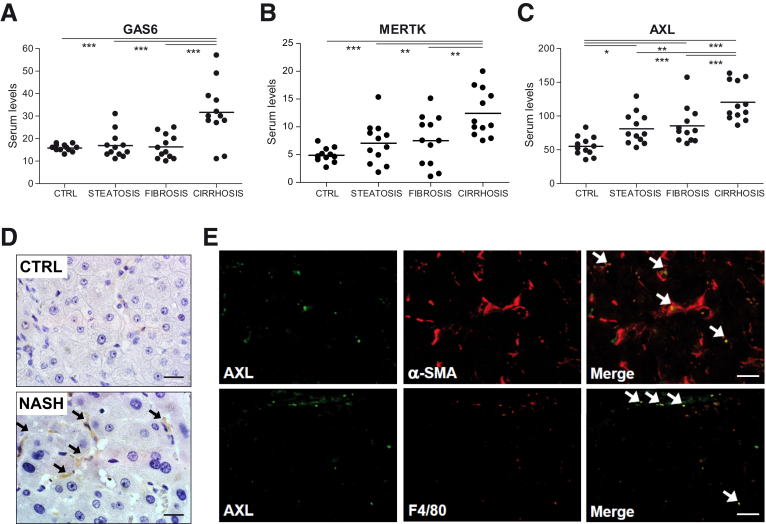
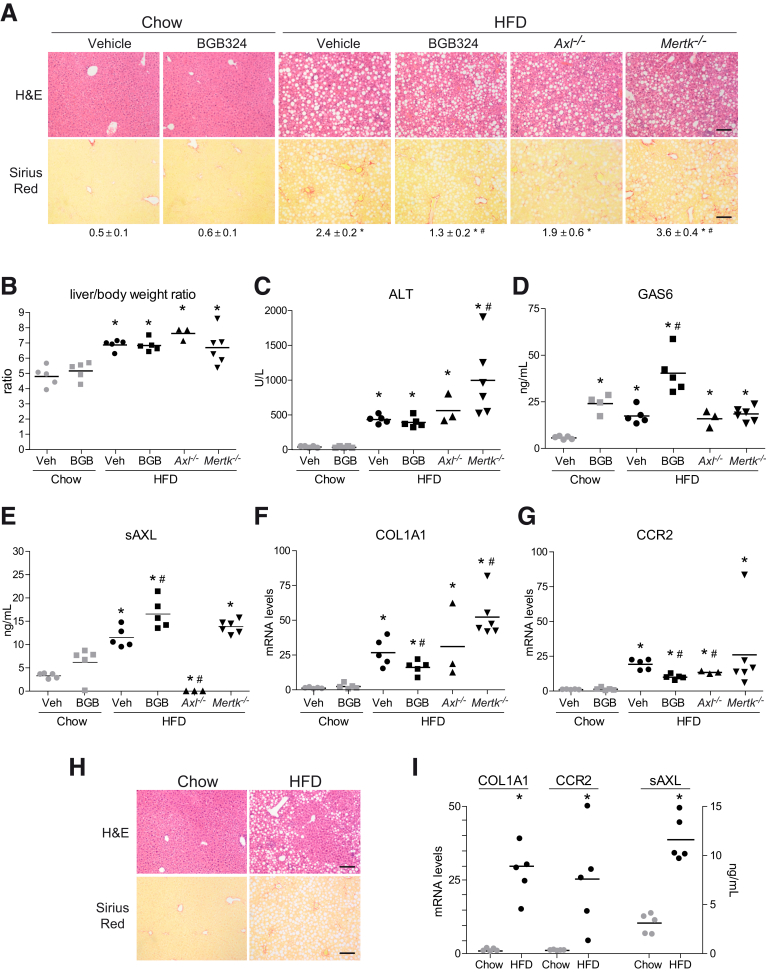
Methods: GAS6/TAM signaling was analyzed in cultured primary hepatocytes, hepatic stellate cells (HSC) and Kupffer cells (KCs). Axl-/-, Mertk-/- and wild-type C57BL/6 mice were fed with Chow, High Fat Choline-Deficient Methionine-Restricted (HFD) or methionine-choline-deficient (MCD) diet. HSC activation, liver inflammation and cytokine/chemokine production were measured by qPCR, mRNA Array analysis, western blotting and ELISA. GAS6, soluble AXL (sAXL) and MERTK (sMERTK) levels were analyzed in control individuals, steatotic and NASH patients.

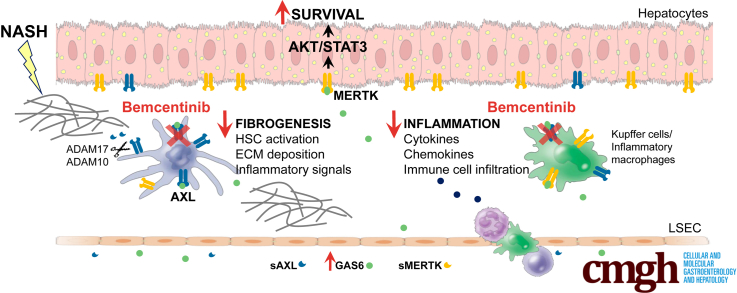
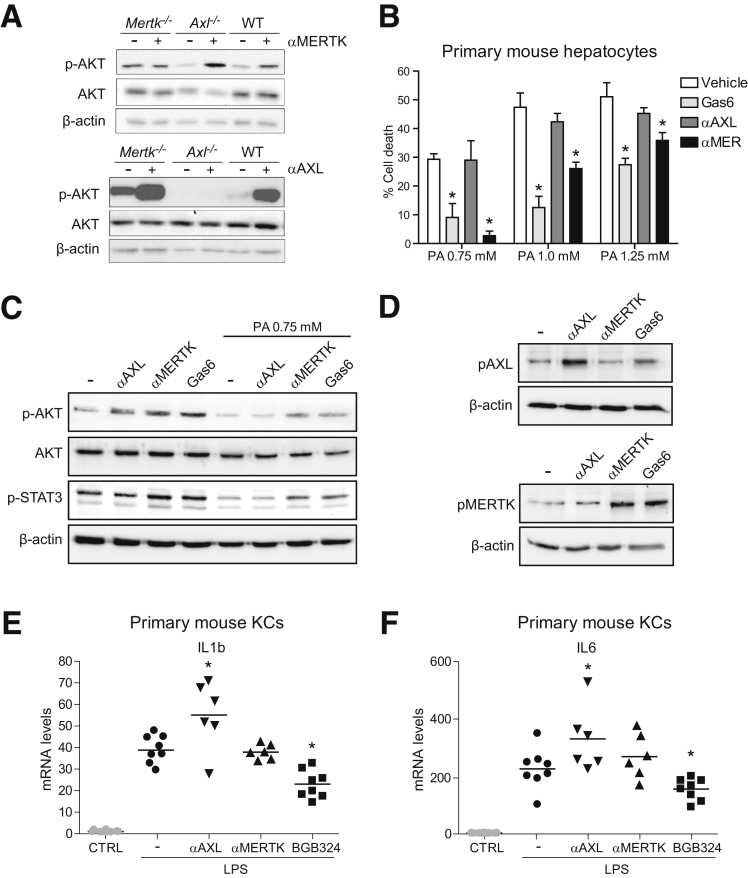
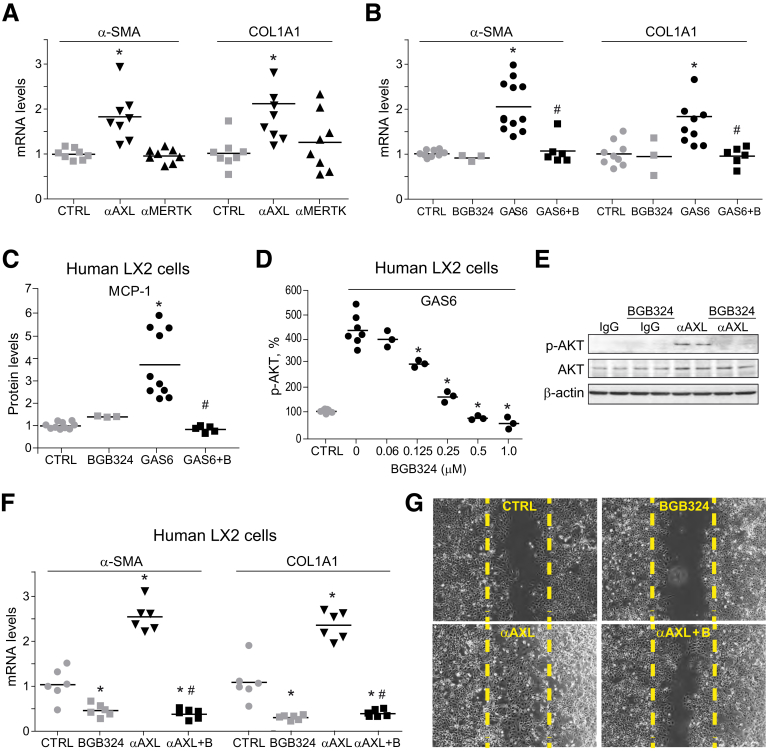
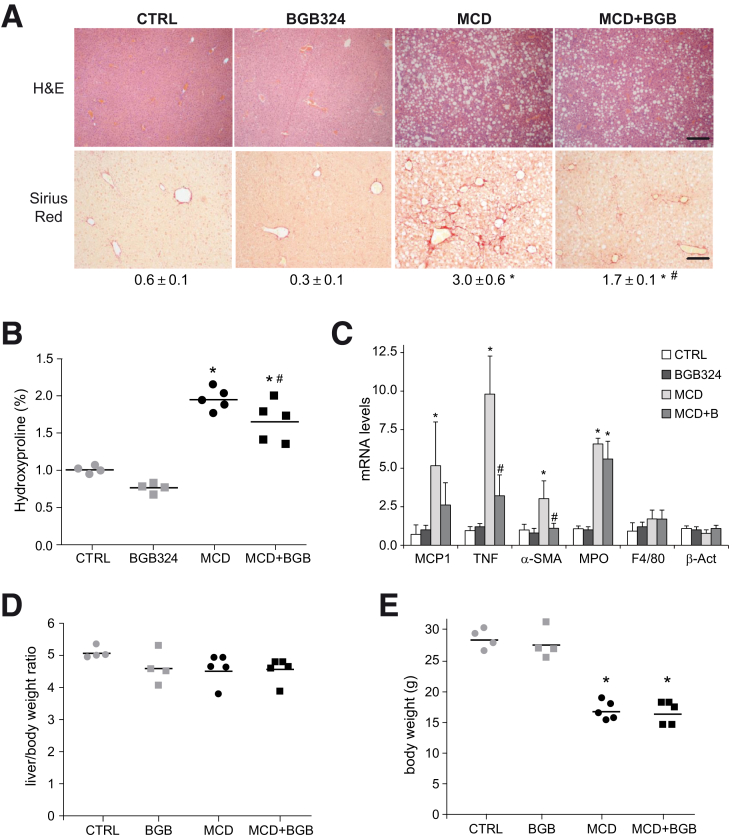
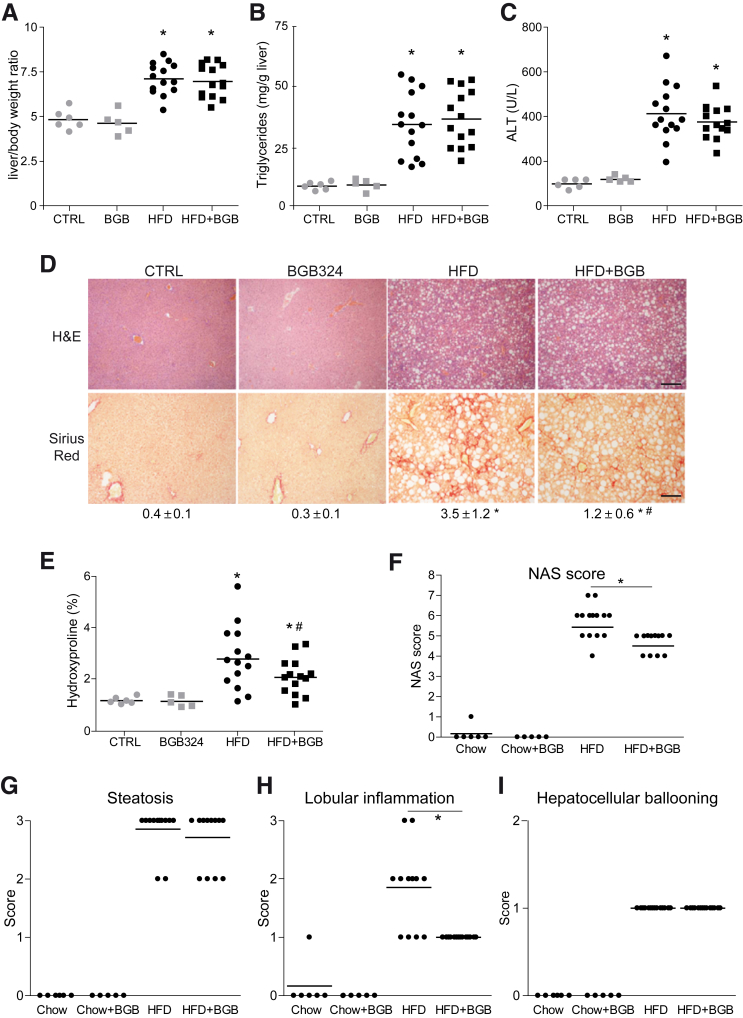
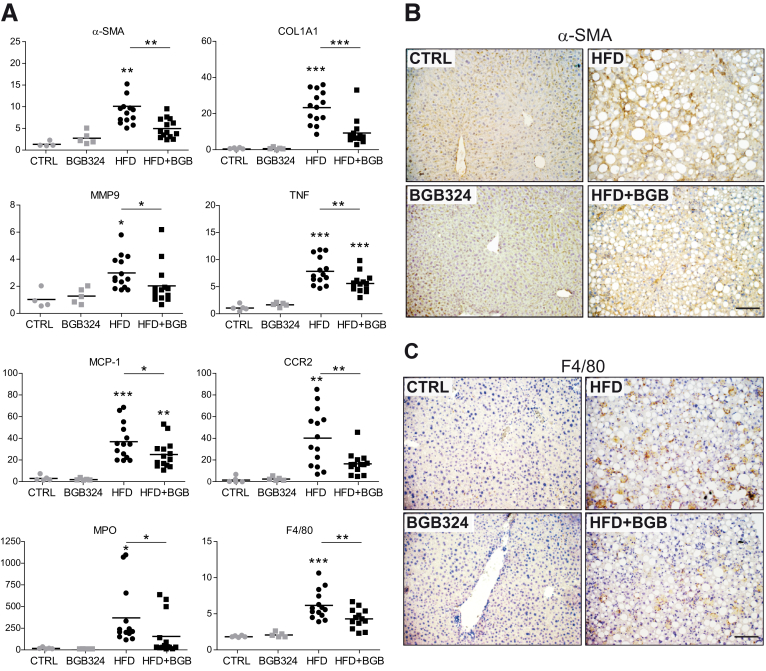
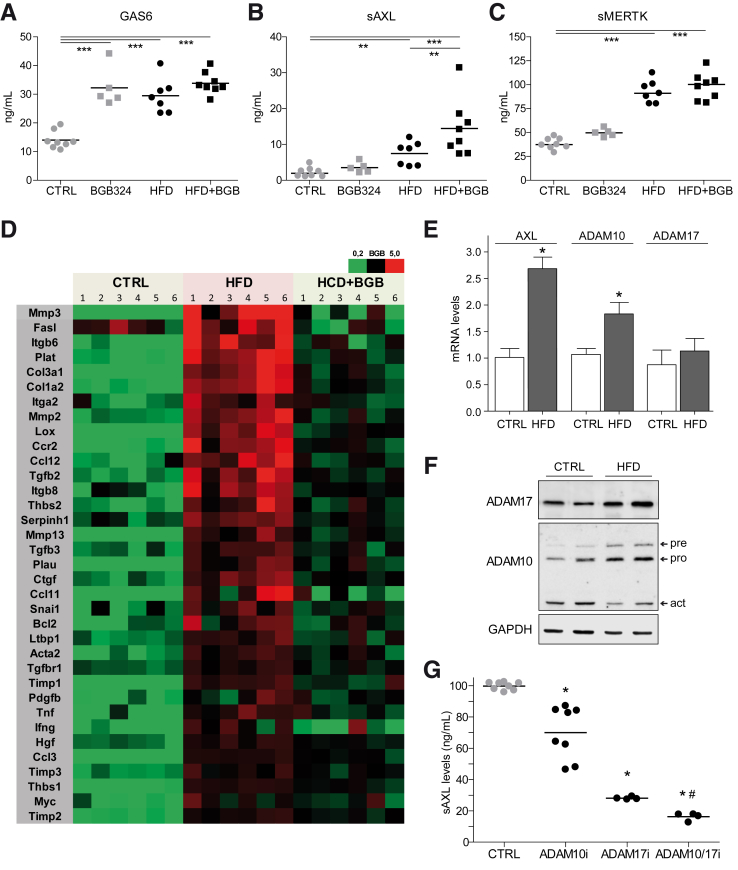
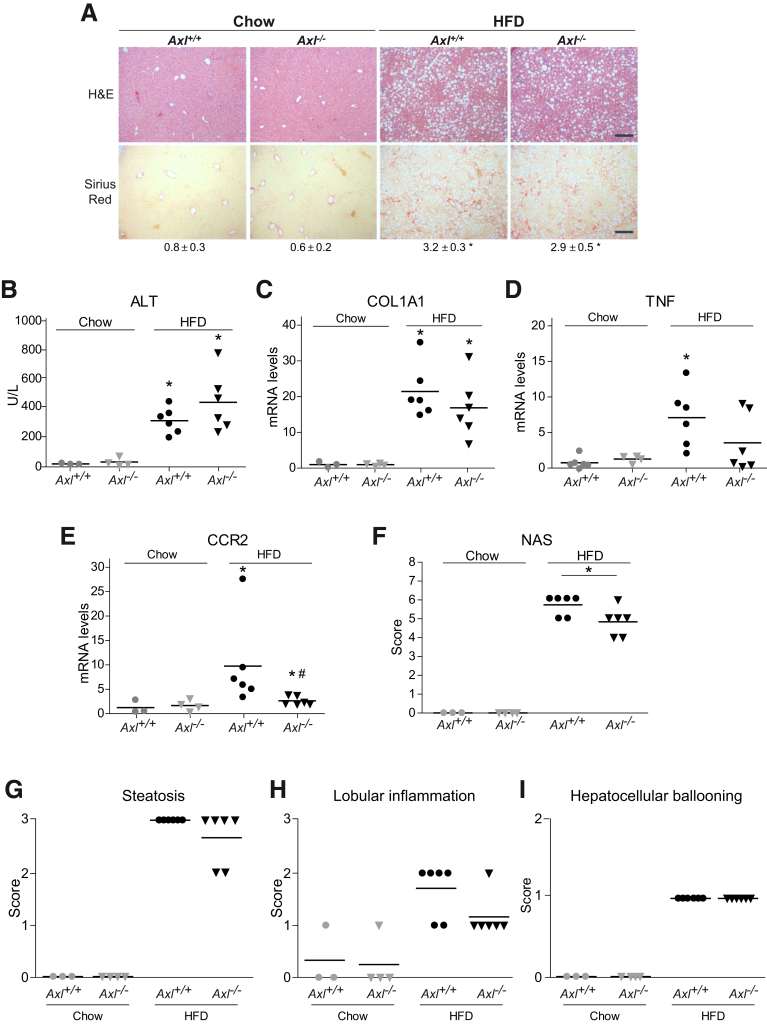
Results: In primary mouse cultures, GAS6 or MERTK activation protected primary hepatocytes against lipid toxicity via AKT/STAT-3 signaling, while bemcentinib (small molecule AXL inhibitor BGB324) blocked AXL-induced fibrogenesis in primary HSCs and cytokine production in LPS-treated KCs. Accordingly; bemcentinib diminished liver inflammation and fibrosis in MCD- and HFD-fed mice. Upregulation of AXL and ADAM10/ADAM17 metalloproteinases increased sAXL in HFD-fed mice. Transcriptome profiling revealed major reduction in fibrotic- and inflammatory-related genes in HFD-fed mice after bemcentinib administration. HFD-fed Mertk-/- mice exhibited enhanced NASH, while Axl-/- mice were partially protected. In human serum, sAXL levels augmented even at initial stages, whereas GAS6 and sMERTK increased only in cirrhotic NASH patients. In agreement, sAXL increased in HFD-fed mice before fibrosis establishment, while bemcentinib prevented liver fibrosis/inflammation in early NASH.

Conclusion: AXL signaling, increased in NASH patients, promotes fibrosis in HSCs and inflammation in KCs, while GAS6 protects cultured hepatocytes against lipotoxicity via MERTK. Bemcentinib, by blocking AXL signaling and increasing GAS6 levels, reduces experimental NASH, revealing AXL as an effective therapeutic target for clinical practice.

Keywords: Bemcentinib (BGB324); GAS6/TAM Signaling; Hepatic Stellate Cells; Liver Fibrosis; Liver Inflammation.


Figures

None
Graphical abstract
Figure 1
Figure 1
GAS6 protects PMHs against cell death induced by palmitic acid via MERTK and bemcentinib blocks LPS-induced inflammation in KCs. (A) Activating antibodies against AXL (α-AXL) or MERTK (α-MERTK) were used in primary fibroblast from WT, AXL, and MERTK KO mice. AXL and MERTK activators (10 nM) were exposed for 1 hour and p-AKT analyzed in cell extracts by Western blot. (B) Cell death after 18 hours in PMHs exposed to palmitic acid (0.75/1.0/1.25 mM) pretreated with recombinant GAS6 or activating antibodies against AXL or MERTK. Results are expressed as mean ± SD. *P ≤ .05 vs palmitic acid-treated cells (n = 3). (C) p-AKT and p-STAT3 levels in PMHs after exposure to GAS6, AXL, or MERTK activators in the presence or absence of palmitic acid (0.75 mM). (D) Changes in p-AXL and p-MERTK levels after KC exposure to GAS6, AXL, or MERTK activators. (E, F) mRNA expression levels of IL-1β and IL-6 in KCs exposed to LPS (50 ng/mL, 2 hours), activating antibodies, or bemcentinib (0.25 μM). *P ≤ .05 vs control cells (n = 6–8).
Figure 2
Figure 2
GAS6 and AXL activation induce profibrotic signaling in HSCs, being blocked by bemcentinib administration. α-SMA and COL1A1 mRNA levels in primary HSCs incubated (A) with activating antibodies against AXL or MERTK (10 nM) for 24 hours (n = 8) and (B) after GAS6 and/or bemcentinib incubation (n = 3–12). (C) MCP-1 release measured by ELISA in cultured medium after 16 hours in GAS6-treated (1 μg/mL) LX2 cells preincubated with BGB324 (0.25 μM) or vehicle (n = 3–10). (D) p-AKT levels measured by ELISA in LX2 cell extracts after GAS6 addition (1 μg/mL, 15 minutes) and BGB324 preincubation (0–1.0 μM) or vehicle (n = 3–8). (E) Representative Western blot of p-AKT and AKT in LX2 cells treated with AXL activating antibody (α-AXL, 10 nM, 15 minutes) and bemcentinib (0.25 μM). (F) mRNA expression level of α-SMA and COL1A1 in LX2 cells treated with AXL activating antibody (α-AXL, 10 nM, 24 hours) and bemcentinib (0.25 μM). *P ≤ .05 vs control cells, #P ≤ .05 vs α-AXL– or GAS6-treated cells (n = 6). (G) Representative images of cell migration experiments in LX2 cells treated with α-AXL (10 nM, 24 hours) or bemcentinib (0.25 μM). The percentage of migrated cells was quantified using ImageJ software, establishing as 100% the rate of scratch replenishment after 24 hours in untreated LX2 cells. *P ≤ .05 vs control cells; #P ≤ .05 vs GAS6- or α-AXL–treated cells.
Figure 3
Figure 3
AXL inhibition reduces liver fibrosis and inflammation in MCD-fed mice. (A) Representative images of liver sections after H&E and Sirius Red staining; bar (200 μm). Sirius Red quantifications using ImageJ software in 6 random sections from each animal are shown below the respective pictures. Student’s t test; *P ≤ .05 vs control mice, #P ≤ .05 vs MCD-fed mice; n = 5–6 independent samples. (B) Collagen determination by hydroxyproline quantification in liver samples (n = 4–5) and (C) mRNA expression level of MCP-1, TNF, α-SMA, MPO, F4/80, and β-actin in liver samples from treated mice. Results are expressed as mean plus standard deviation (n = 4–5). *P ≤ .05 vs control mice; #P ≤ .05 vs MCD-fed mice; Student’s t test. (D, E) Body and liver weight were measured after sacrifice in mice fed for 6 weeks with chow and MCD diet that received vehicle or bemcentinib (BGB324) oral gavages for the last 2 weeks. *P ≤ .05 vs control; n = 4–5. The results shown are representative for 2 independent experiments.
Figure 4
Figure 4
Bemcentinib reduces liver fibrosis and inflammation in HFD-fed mice. (A) Body and liver weight, (B) triglycerides in liver extracts, and (C) serum alanine aminotransferase (ALT) transaminases were measured after sacrifice in mice fed for 8 weeks with chow or HFD that received vehicle or bemcentinib (BGB324) oral gavages for the last 2 weeks (n = 5–14). (D) Representative images of liver sections after H&E and Sirius Red staining; bar (200 μm). Sirius Red quantifications are shown each picture. Student’s t test; *P ≤ .05 vs control mice, #P ≤ .05 vs HFD-fed mice. (E) Hydroxyproline quantification in liver samples from treated mice. Student’s t test; *P ≤ .05 vs control mice, #P ≤ .05 vs HFD-fed mice; n = 5–14. (F) NAFLD activation score, composed by (G) steatosis, (H) lobular inflammation, and (I) hepatocellular ballooning, was evaluated in liver samples from treated mice. One-way analysis of variance; Student’s t test; *P ≤ .05 vs HFD-fed mice; n = 5–14.
Figure 5
Figure 5
Reduction of profibrotic and proinflammatory gene and protein expression by bemcentinib administration to HFD-fed mice. (A) mRNA expression level of α-SMA, COL1A1, MMP9, TNF, MCP1, CCR2, MPO, and F4/80 were measured in liver samples from animals receiving chow or HFD diet with or without administration of AXL inhibitor bemcentinib.*P ≤ .05, **P ≤ .01, and ***P ≤ .001 between groups; 1-way analysis of variance; n = 5–14. (B, C) Representative images of liver immunohistochemistry of α-SMA and F4/80 expression in mice treated as above. Scale bar = 100 μm.
Figure 6
Figure 6
Increased serum sAXL in diet-induced NASH mice as consequence of ADAMs and AXL upregulation. (A–C) Serum GAS6, sAXL, and MERTK levels were measured in mice fed with chow diet and HFD gavaged with vehicle or bemcentinib.*P ≤ .05, **P ≤ .01, and ***P ≤ .001 between groups; 1-way analysis of variance; n = 5–8. (D) Analysis of AXL inhibition in HFD-fed mice using an mRNA Array containing fibrosis- and inflammation-related genes (n = 6). (E) Expression changes of AXL, ADAM10, and ADAM17 mRNA in HFD-fed mice. Results are expressed as mean plus standard deviation.*P ≤ .05 vs control mice; n = 3. (F) Representative Western blot of ADAM10, ADAM17, and GADPH protein expression in chow- and HFD-fed mice. (G) Levels of sAXL secreted from LX2 cells in the presence or absence of ADAM10 inhibitor (GI254023X), ADAM17 inhibitor (TMI-005), or both. *P ≤ .05 vs untreated cells; #P ≤ .05 vs ADAM10 or ADAM17 inhibitors; n = 4–8.
Figure 7
Figure 7
AXL-deficient mice display partial protection against liver fibrosis and inflammation in HFD-fed mice. (A) Representative images of liver sections after H&E and Sirius Red staining from control and AXL KO mice treated with chow or HFD diet. Scale bar = 200 μm. Sirius Red quantification is shown below the respective pictures. Student’s t test; *P ≤ .05 vs control mice. (B) alanine aminotransferase (ALT) serum levels from treated mice (n = 3–6). (C–E) mRNA expression level of COL1A1, TNF, and CCR2 in liver samples from treated mice (n = 3–6). (F) NAFLD Activation Score, composed by (G) steatosis, (H) lobular inflammation, and (I) hepatocellular ballooning, was evaluated in liver samples from treated mice. One-way analysis of variance; *P ≤ .05 vs HFD-fed mice; n = 3–6. The results shown are representative for 2 independent experiments.
Figure 8
Figure 8
MERTK deficiency increased liver fibrosis and inflammation in HFD-fed mice. (A) Representative images of liver sections after H&E and Sirius Red staining from control and MERTK KO mice treated with chow or HFD diet. Scale bar = 200 μm. Sirius Red quantification is shown below the respective pictures. Student’s t test; *P ≤ .05 vs control mice, #P ≤ .05 vs HFD-fed mice; n = 3–6. (B) Alanine aminotransferase (ALT) serum levels from treated mice (n = 3–6). (C, D) mRNA expression level of TNF and MPO in liver samples from treated mice. *P ≤ .05 vs control mice; #P ≤ .05 vs HFD-fed mice; n = 3–6. (E) NAFLD activation score, composed by (F) steatosis, (G) lobular inflammation, and (H) hepatocellular ballooning, was evaluated in liver samples from treated mice. One-way analysis of variance. *P ≤ .05 vs HFD-fed mice; n = 3–6. The results shown are representative for 2 independent experiments.
Figure 9
Figure 9
Serum levels of sAXL are increased in NASH patients being expressed in activated HSCs and KCs. (A–C) GAS6 and soluble levels of AXL and MERTK (ng/mL) were measured in control individuals (n = 12) and in patients with different degree of NASH progression: with steatosis (n = 12), fibrosis (n = 12), and cirrhosis (n = 12). *P ≤ .05, **P ≤ .01 and ***P ≤ .001 between groups (1-way analysis of variance). (D) Representative images of liver IHC of AXL expression in control and cirrhotic NASH patients. Scale bar = 50 μm; n = 4. (E) Representative immunofluorescence images of AXL (green) and α-SMA/F480 (red) in cirrhotic NASH patients (n = 4).
Figure 10
Figure 10
Bemcentinib reduces early liver fibrosis and inflammation in HFD-fed mice. (A) Representative images of liver sections after H&E and Sirius Red staining from mice fed for 4 weeks with chow and HFD diet that received vehicle or bemcentinib (BGB324) gavages for the last 2 weeks. Scale bar = 200 μm. Sirius Red quantifications are shown under representative pictures. Student’s t test; *P ≤ .05 vs control mice; #P ≤ .05 vs HFD-fed mice; n = 3–6. (B) Liver to body weight and (C) serum alanine aminotransferase (ALT) transaminases were measured (n = 3–6). (D) Serum GAS6 and (E) sAXL were measured in mice fed with chow diet and HFD gavaged with vehicle or bemcentinib. One-way analysis of variance; *P ≤ .05 vs chow-fed mice; #P ≤ .05 vs HFD-fed mice; n = 3–6. (F, G) mRNA expression level of COL1A1 and CCR2 in liver samples from treated mice. *P ≤ .05 vs chow-fed mice; #P ≤ .05 vs HFD-fed mice; n = 3–6. (H) Representative images of liver sections after H&E and Sirius Red staining from mice fed for 2 weeks with chow and HFD diet. Scale bar = 200 μm. (I) mRNA expression level of COL1A1 and CCR2 in liver samples and protein sAXL levels in serum from treated mice. *P ≤ .05 vs chow-fed mice; n = 5. The results shown are representative for 2 independent experiments.

Comment in

Similar articles

Cited by

References

    1. Younossi Z.M., Loomba R., Rinella M.E., Bugianesi E., Marchesini G., Neuschwander-Tetri B.A., Serfaty L., Negro F., Caldwell S.H., Ratziu V., Corey K.E., Friedman S.L., Abdelmalek M.F., Harrison S.A., Sanyal A.J., Lavine J.E., Mathurin P., Charlton M.R., Chalasani N.P., Anstee Q.M., Kowdley K.V., George J., Goodman Z.D., Lindor K. Current and future therapeutic regimens for nonalcoholic fatty liver disease and nonalcoholic steatohepatitis. Hepatology. 2018;68:361–371. - PMC - PubMed
    1. Rinella M.E. Nonalcoholic fatty liver disease: a systematic review. JAMA. 2015;313:2263–2273. - PubMed
    1. Younossi Z.M., Koenig A.B., Abdelatif D., Fazel Y., Henry L., Wymer M. Global epidemiology of nonalcoholic fatty liver disease-Meta-analytic assessment of prevalence, incidence, and outcomes. Hepatology. 2016;64:73–84. - PubMed
    1. Schuppan D., Surabattula R., Wang X.Y. Determinants of fibrosis progression and regression in NASH. J Hepatol. 2018;68:238–250. - PubMed
    1. Ratziu V., Harrison S.A., Francque S., Bedossa P., Lehert P., Serfaty L., Romero-Gomez M., Boursier J., Abdelmalek M., Caldwell S., Drenth J., Anstee Q.M., Hum D., Hanf R., Roudot A., Megnien S., Staels B., Sanyal A., Group G.-I.S. Elafibranor, an agonist of the peroxisome proliferator-activated receptor-alpha and -delta, induces resolution of nonalcoholic steatohepatitis without fibrosis worsening. Gastroenterology. 2016;150:1147–1159.e5. - PubMed

Publication types

MeSH terms