. 2019 Nov 19;116(47):23790-23796.
doi: 10.1073/pnas.1908529116. Epub 2019 Nov 5.

ABCA7 haplodeficiency disturbs microglial immune responses in the mouse brain

Affiliations

ABCA7 haplodeficiency disturbs microglial immune responses in the mouse brain

Tomonori Aikawa et al. Proc Natl Acad Sci U S A. .

Abstract

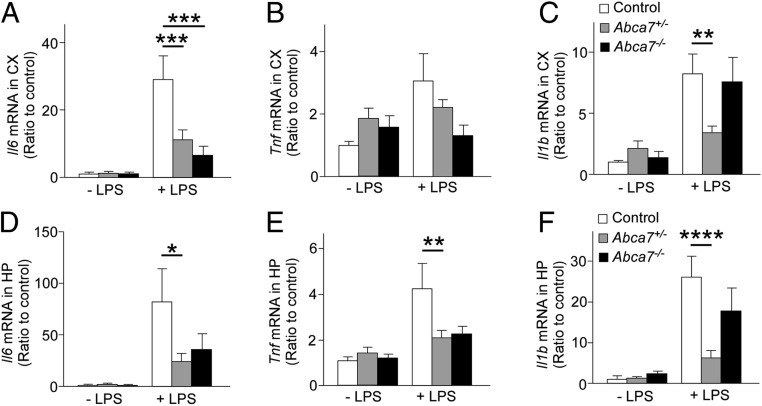
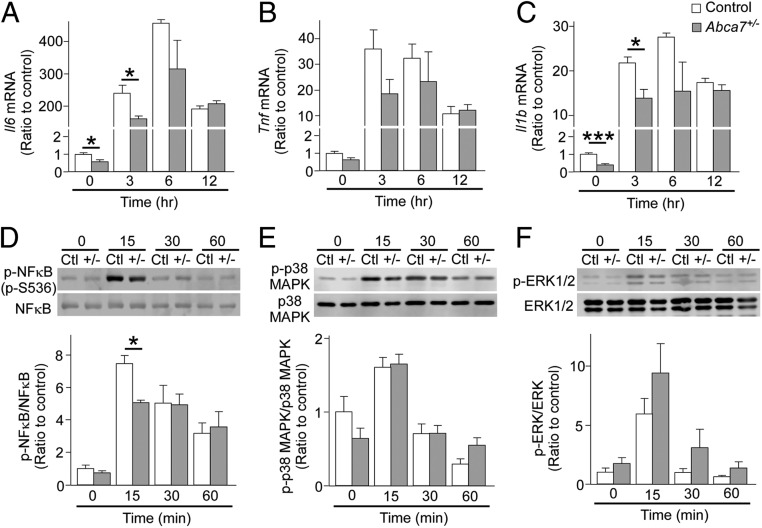
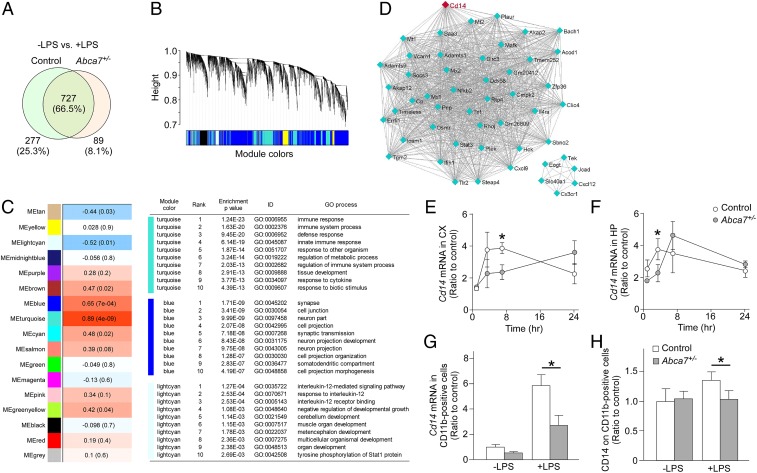
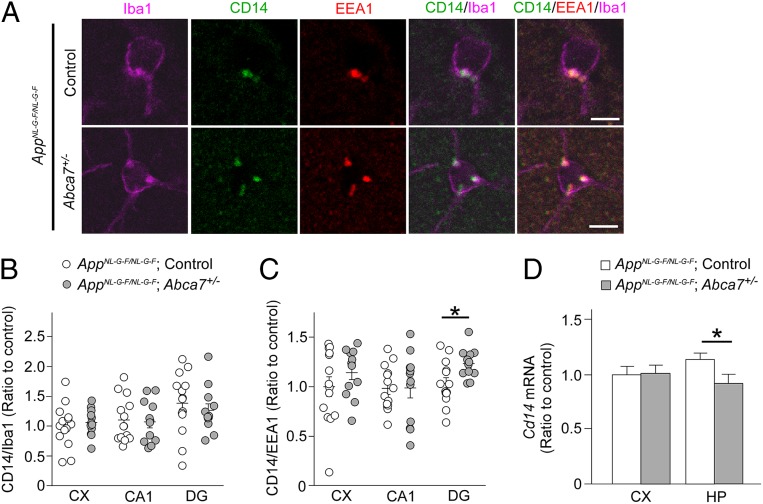
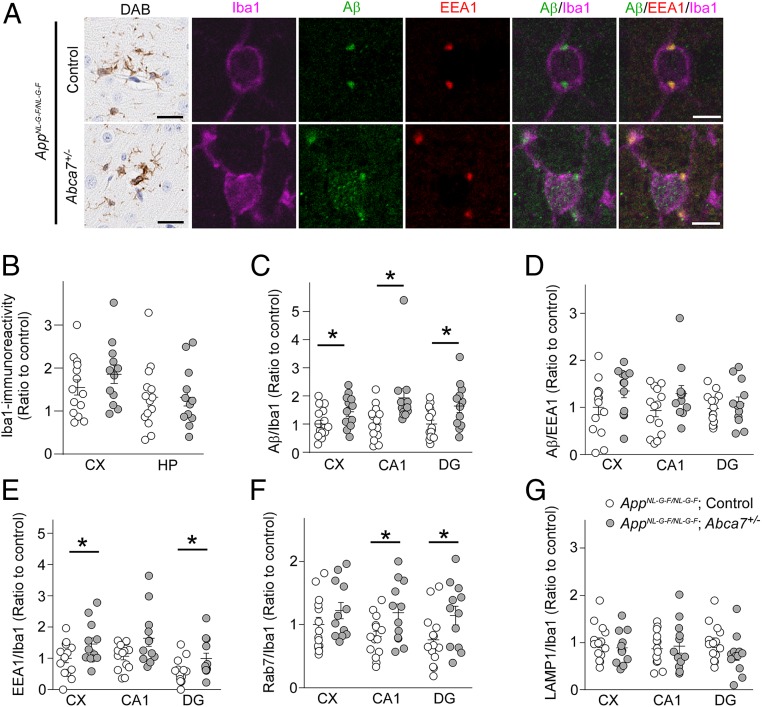
Carrying premature termination codons in 1 allele of the ABCA7 gene is associated with an increased risk for Alzheimer's disease (AD). While the primary function of ABCA7 is to regulate the transport of phospholipids and cholesterol, ABCA7 is also involved in maintaining homeostasis of the immune system. Since inflammatory pathways causatively or consequently participate in AD pathogenesis, we studied the effects of Abca7 haplodeficiency in mice on brain immune responses under acute and chronic conditions. When acute inflammation was induced through peripheral lipopolysaccharide injection in control or heterozygous Abca7 knockout mice, partial ABCA7 deficiency diminished proinflammatory responses by impairing CD14 expression in the brain. On breeding to AppNL-G-F knockin mice, we observed increased amyloid-β (Aβ) accumulation and abnormal endosomal morphology in microglia. Taken together, our results demonstrate that ABCA7 loss of function may contribute to AD pathogenesis by altering proper microglial responses to acute inflammatory challenges and during the development of amyloid pathology, providing insight into disease mechanisms and possible treatment strategies.

Keywords: ABCA7; Alzheimer’s disease; CD14; amyloid-β; immune response.


Conflict of interest statement

The authors declare no competing interest.

Figures

Fig. 1.
Fig. 1.
Abca7 deficiency suppresses inflammatory cytokine expression in the mouse brain on peripheral LPS administration. mRNA expression levels of inflammatory cytokines were analyzed in the cortex (CX; AC) and hippocampus (HP; DF) of control (white), Abca7+/− (gray), and Abca7−/− (black) mice at 3.5 h after administration with i.p. LPS injection (control, n = 15; Abca7+/−, n = 17; Abca7−/−, n = 9) or without i.p. LPS injection (control, n = 16; Abca7+/−, n = 18; Abca7−/−, n = 7). The ∆∆Ct values of Il6 (A and D), Tnf (B and E), and Il1b (C and F) relative to Hprt were measured by qRT-PCR. Relative ratios to control mice without LPS administration are shown as mean ± SEM. *P < 0.05; **P < 0.01; ***P < 0.001; ****P < 0.0001, Tukey–Kramer post hoc analysis of 2-way ANOVA within LPS(−) or LPS(+) groups.
Fig. 2.
Fig. 2.
Delayed immune responses in microglia from heterozygous Abca7 knockout mice after LPS stimulation. Primary cultures of microglia were prepared from control (white) and Abca7+/− (gray) mice. The ΔΔCt values of Il6 (A), Tnf (B), and Il1b (C) relative to Hprt were measured by qRT-PCR in microglia at 3, 6, and 12 h after culture with LPS (10 ng/mL). Phosphorylation of NF-κB (D), p38 MAPK (E), and ERK (F) was analyzed by Western blotting at 15, 30, and 60 min after culture with LPS. Relative ratios to control microglia without LPS are shown as mean ± SEM (n = 3/each). *P < 0.05; ***P < 0.001, Student t test at each time point.
Fig. 3.
Fig. 3.
Altered cortical transcriptome by ABCA7 haplodeficiency and peripheral LPS stimulation. (A) Venn diagram of cortical genes markedly changed at 3.5 h after LPS administration in control and Abca7+/− mice (n = 6/each) through RNA-seq. (B) Clustering dendrogram of genes displayed with gene dissimilarity based on topological overlap through WGCNA among the 4 groups of mice: control with LPS administration, Abca7+/− with LPS administration, control with LPS administration, and Abca7+/− with LPS administration. Each module is represented by a unique color. (C) The module traits were correlated with the 4 groups of mice. The corresponding correlations and P values are displayed in each module. Modules showing a significant change (P ≤ 0.01) were analyzed for pathway enrichment. (D) Visualization of the gene–gene interaction within the turquoise module. (EH) Expression levels of Cd14 mRNA were analyzed in the cortex (CX; E) and hippocampus (HP; F) of control (white) and Abca7+/− (gray) mice at 1 h (control, n = 4; Abca7+/−, n = 4), 3.5 h (control, n = 15; Abca7+/−, n = 17), 7 h (control, n = 4; Abca7+/−, n = 4), and 24 h (control, n = 4; Abca7+/−, n = 4) after i.p. LPS injection. (G and H) CD11b-positive microglia were isolated from the cortex at 7 h after administration with or without i.p. LPS injection. Cd14 mRNA (G; control, n = 4; Abca7+/−, n = 4; control with LPS, n = 9; Abca7+/− with LPS, n = 9) and cell surface CD14 (H; control, n = 4; Abca7+/−, n = 4; control with LPS, n = 9; Abca7+/− with LPS, n = 9) levels in the isolated microglia were measured by qRT-PCR and FACS, respectively. For qRT-PCR, the ∆∆Ct values of Cd14 relative to Hprt were measured. Relative ratios to control mice without LPS administration are shown as mean ± SEM. *P < 0.05, Student t test at each time point (E and F) or Tukey–Kramer post hoc analysis of 2-way ANOVA (G and H).
Fig. 4.
Fig. 4.
Influence of ABCA7 haplodeficiency on CD14 in AppNL-G-F/NL-G-F mice. (A) Brain sections from AppNL-G-F/NL-G-F;control (n = 14) and AppNL-G-F/NL-G-F;Abca7+/− mice (n = 12) were immunostained for Iba-1, CD14, and EEA1 at age 3 mo. Representative images from the dentate gyrus region are shown. (Scale bars: 10 μm.) (BD) Localization of CD14-positive (B) and EEA1-positive (C) compartments in Iba-1–positive cells was quantified in the cortex (CX), CA1, and dentate gyrus (DG) of the mice using ImageJ. (D) The ∆∆Ct values of Cd14 relative to Hprt were measured by qRT-PCR in the cortex and hippocampus (HP). Relative ratios to AppNL-G-F/NL-G-F;control mice are shown as mean ± SEM, *P < 0.05, Student t test.
Fig. 5.
Fig. 5.
Microglial Aβ accumulation in AppNL-G-F/NL-G-F;Abca7+/− mice. (A) Brain sections from AppNL-G-F/NL-G-F;control (n = 14) and AppNL-G-F/NL-G-F;Abca7+/− mice (n = 12) were immunostained for Iba-1 (DAB; scale bars: 50 μm) and for Iba-1, Aβ, and EEA1 (immunofluorescence; scale bars: 5 μm) at age 3 mo. Representative images from the cortical region for DAB staining and the dentate gyrus (DG) region for immunofluorescence staining are shown. (B) DAB immunoreactivity for Iba-1 in the cortex (CX) and hippocampus (HP) were quantified through the Aperio Positive Pixel Count program (Leica Biosystems Imaging). (C and D) Localization of Aβ in Iba-1–positive cells (C) and EEA1-positive compartments in Iba-1–positive cells (D) was quantified by ImageJ in the cortex, CA1, and dentate gyrus. (EG) Mouse brain sections were also immunostained for Iba-1 and EEA1 (E), Rab7 (F), and LAMP1 (G), and localization in Iba-1–positive cells was quantified. Relative ratios to AppNL-G-F/NL-G-F;control mice (CX) are shown as mean ± SEM. *P < 0.05, Student t test or the Wilcoxon test.

References

    1. Hansen D. V., Hanson J. E., Sheng M., Microglia in Alzheimer’s disease. J. Cell Biol. 217, 459–472 (2018). - PMC - PubMed
    1. Sarlus H., Heneka M. T., Microglia in Alzheimer’s disease. J. Clin. Invest. 127, 3240–3249 (2017). - PMC - PubMed
    1. Herrup K., Reimagining Alzheimer’s disease—An age-based hypothesis. J. Neurosci. 30, 16755–16762 (2010). - PMC - PubMed
    1. Karch C. M., Goate A. M., Alzheimer’s disease risk genes and mechanisms of disease pathogenesis. Biol. Psychiatry 77, 43–51 (2015). - PMC - PubMed
    1. Allen M., et al. , ABCA7 loss-of-function variants, expression, and neurologic disease risk. Neurol. Genet. 3, e126 (2017). - PMC - PubMed

Publication types

Substances