. 2019 Nov 5;10(1):5027.
doi: 10.1038/s41467-019-12716-2.

Metabolic dysregulation in vitamin E and carnitine shuttle energy mechanisms associate with human frailty

Affiliations

Metabolic dysregulation in vitamin E and carnitine shuttle energy mechanisms associate with human frailty

Nicholas J W Rattray et al. Nat Commun. .

Abstract

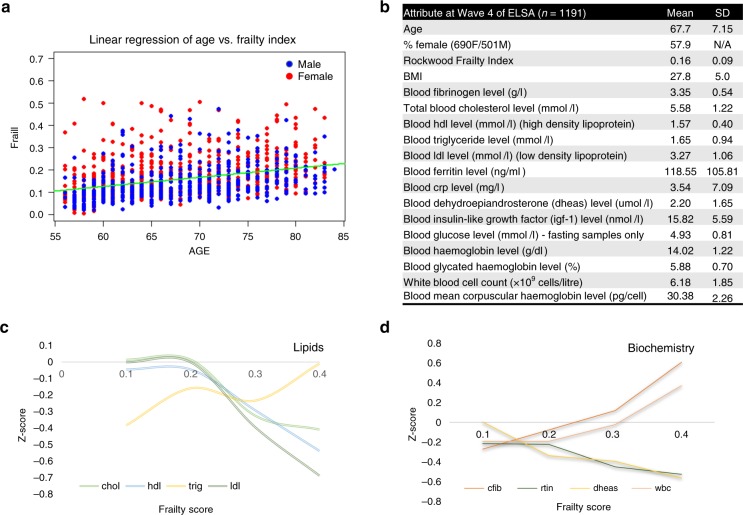
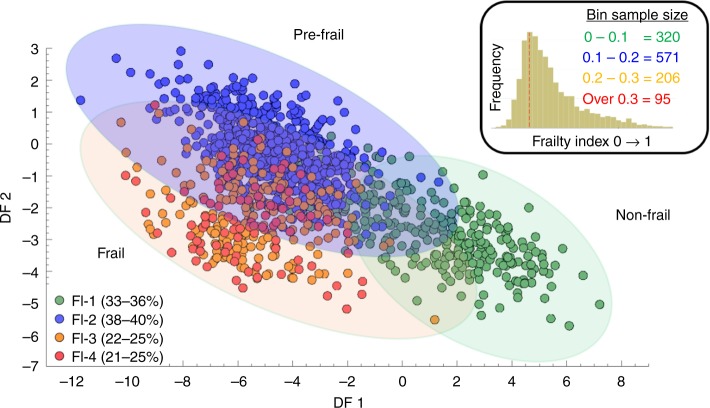
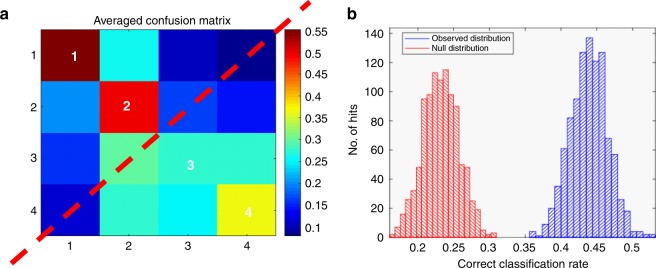
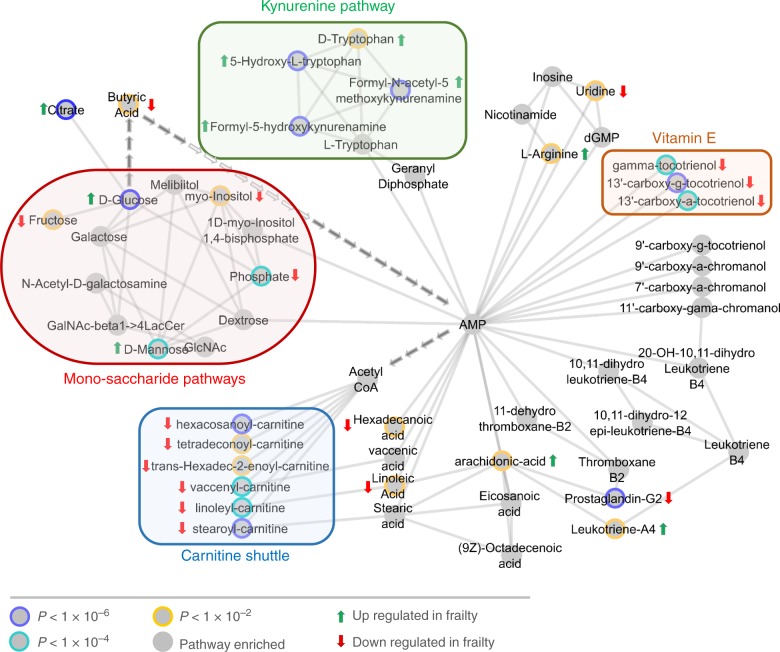
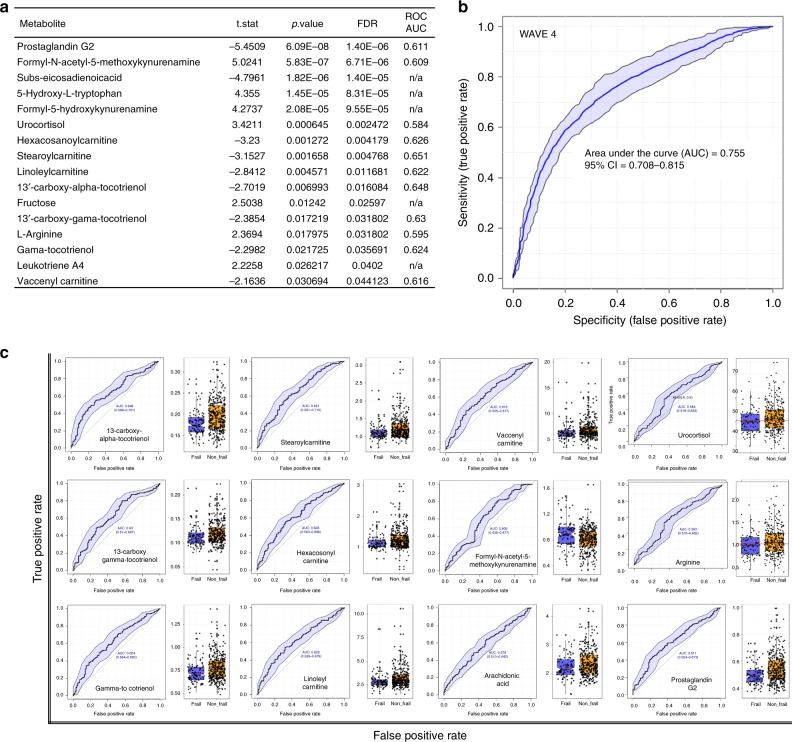
Global ageing poses a substantial economic burden on health and social care costs. Enabling a greater proportion of older people to stay healthy for longer is key to the future sustainability of health, social and economic policy. Frailty and associated decrease in resilience plays a central role in poor health in later life. In this study, we present a population level assessment of the metabolic phenotype associated with frailty. Analysis of serum from 1191 older individuals (aged between 56 and 84 years old) and subsequent longitudinal validation (on 786 subjects) was carried out using liquid and gas chromatography-mass spectrometry metabolomics and stratified across a frailty index designed to quantitatively summarize vulnerability. Through multivariate regression and network modelling and mROC modeling we identified 12 significant metabolites (including three tocotrienols and six carnitines) that differentiate frail and non-frail phenotypes. Our study provides evidence that the dysregulation of carnitine shuttle and vitamin E pathways play a role in the risk of frailty.


Conflict of interest statement

The authors declare no competing interests.

Figures

Fig. 1
Fig. 1
Sample attributes at wave 4 of ELSA. a Linear regression of Age vs. Frailty Index score indicating a moderate correlation and implying that the concept of frailty, when measured under the Rockwood FI scoring system, is an independent variable with respect to age (blue dots = male subjects, red dots = female subjects). b Mean sample characteristics from 1191 subjects and associated blood analysis. c Mean cholesterol levels as observed across the frailty distribution using the standard scoring method. It can be seen that LDL, HDL and cholesterol all decrease when entering the non-frail cut-off. Triglycerides are seen to increase. d Most pronounced biochemistry levels as observed across the frailty distribution using the standard scoring method. Fibrinogen and white blood cells indicating a marked increased Z-score over the frailty distribution whereas ferritin and dehydroepiandrosterone indicate a decrease. Source data are provided as a Source Data file
Fig. 2
Fig. 2
PC-DFA of serum metabolite data stratified over the frailty index distribution. Principal component discriminant function analysis (PC-DFA) carried out on serum metabolite profiling data from 1191 subjects within wave 4 of ELSA. Data were log2 transformed and stratified in to groups determined by Rockwood Frailty Index value. The results were cross validated by bootstrapping (10,000 iterations) and indicate two clear planes of separation along the 0.1–0.2 axis and the 0.2–0.3 axis. This data correlates with observations that directly stratify clinical assessment over the frailty index indicating three distinct clinical phenotypes. Green circle = Frailty Index 0–0.1, Blue circle—Frailty Index 0.1–0.2, Orange circle = Frailty Index 0.2–0.3, Red circle = Frailty Index above 0.3). Source data are provided as a Source Data file
Fig. 3
Fig. 3
RUSBoost-CART analysis of samples binned over the frailty index. a Machine learning based Random Under Sampling boosting Classification and Regression Tree analyses on (+) mode UHPLC-MS data supporting correct sample stratification over frailty index distribution. Confusion Matrix indicates a clear separation between >0.2 and <0.2 on the frailty index and thus good model prediction. b Null-distribution classification rate (red frequency histogram) supporting machine learning results (blue frequency histogram) and, indicating the groupings in the confusion matrix are correctly classified. Source data are provided as a Source Data file
Fig. 4
Fig. 4
Enriched pathway model from hybrid network analysis. Frailty metabolite subnetwork generated from the human metabolite network from within the mummichog-Cytoscape pipeline using 554 metabolite features with unique m/z values from the LCMS (+) analysis alongside the addition of 86 metabolites from GCMS analysis. This combined approach highlights 4 main metabolic areas that altered within the frailty metabotype, all of them identifying cyclic AMP as a potential hub-metabolite. Source data are provided as a Source Data file
Fig. 5
Fig. 5
Significance and predictive ability within the metabolic model of frailty. a Table indicating 12 metabolites of statistical significance (p < 0.05) in differentiating non-frail and frail metabolic phenotypes using Kruskal-Wallis analysis of variance with subsequent false discovery rate testing for multiple comparisons. Data also contains area under curve data used to create multivariate receiver operating characteristic curve (mROC) b mROC curve from Waves 4 generated by combining 12 metabolites to generate a predictive model of frailty status. The shaded area indicate 95% confidence intervals calculated by Monte Carlo cross validation using balanced subsampling and 1000 iterations of bootstrapped cross-validation. c Univariate ROC curves and non-frail (orange) to frail (blue) boxplots of each metabolite used to generate the multivariate ROC analysis. Each boxplot displays a median value (centre line), upper and lower quartiles (box limits), 1.5× interquartile range (black bar), and points out of interquartile range are outliers. Source data are provided as a Source Data file

References

    1. W.H.O. World Health Statistics 2016: Monitoring health for the SDGs (2016).
    1. W.H.O. Ageing and Health Fact Sheet No. 404 (2015).
    1. W.H.O. Global Health and Aging (2017).
    1. Dong X, Milholland B, Vijg J. Evidence for a limit to human lifespan. Nature. 2016;538:257–259. doi: 10.1038/nature19793. - DOI - PMC - PubMed
    1. Devlin, H. Maximum human lifespan could far exceed 115 years—new research. The Guardian (2017).

Publication types