. 2019 Nov 5;9(1):16063.
doi: 10.1038/s41598-019-52277-4.

Frequency of extreme precipitation increases extensively with event rareness under global warming

Affiliations

Frequency of extreme precipitation increases extensively with event rareness under global warming

G Myhre et al. Sci Rep. .

Abstract

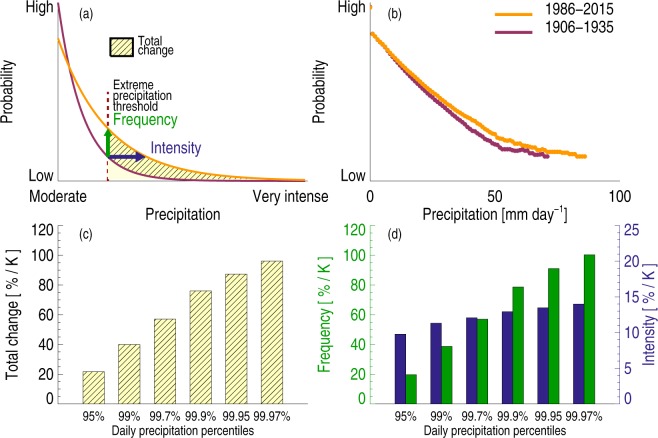
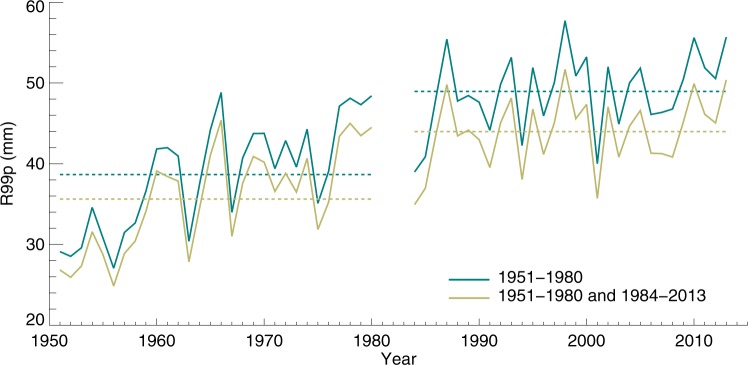
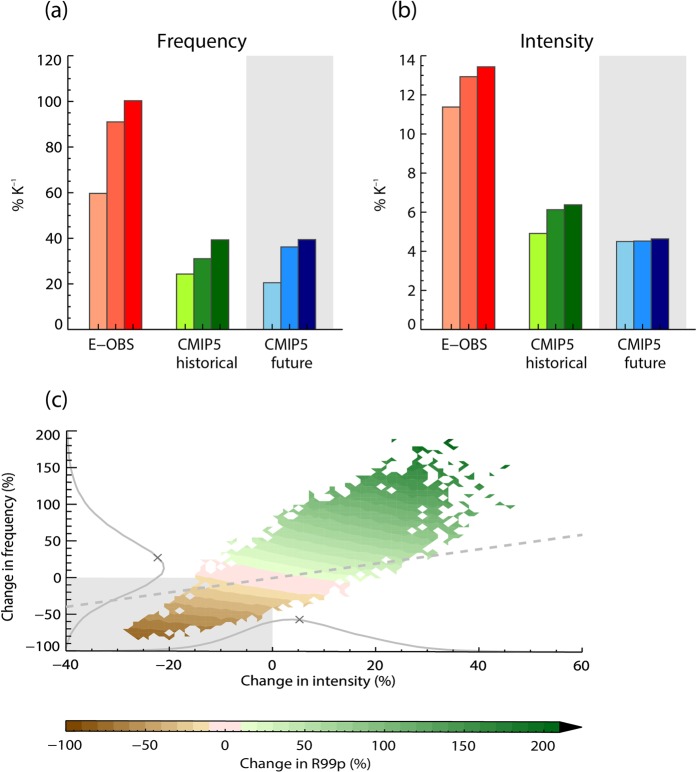
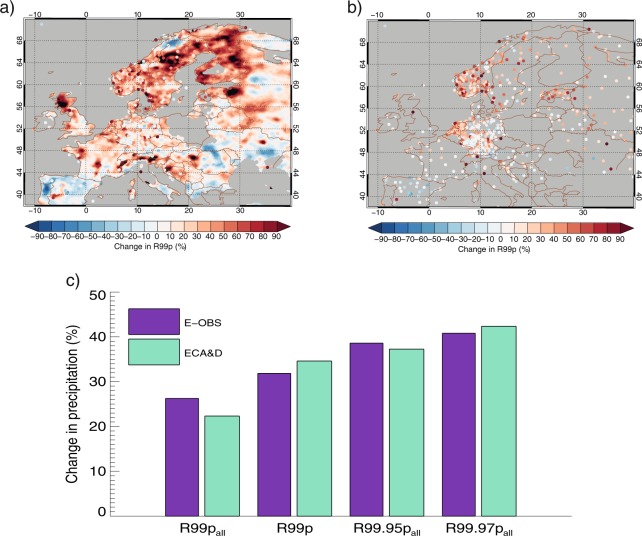
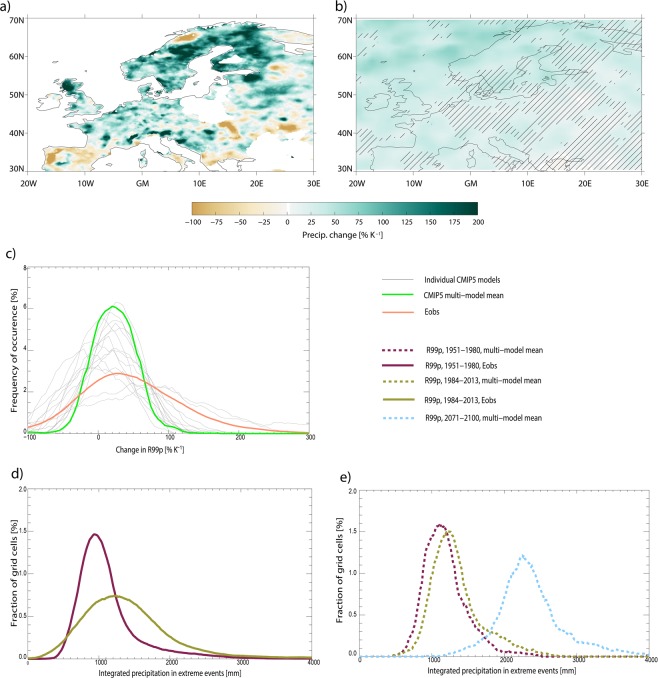
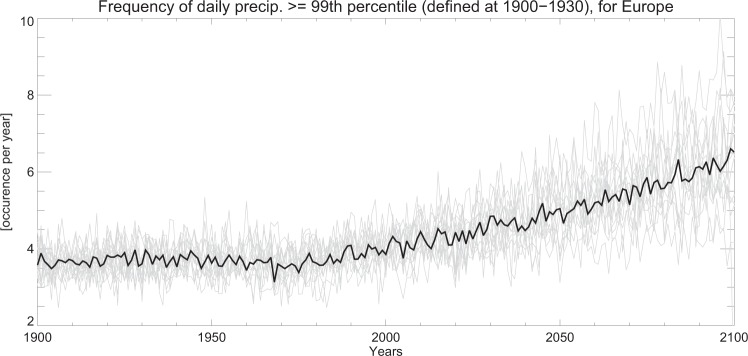
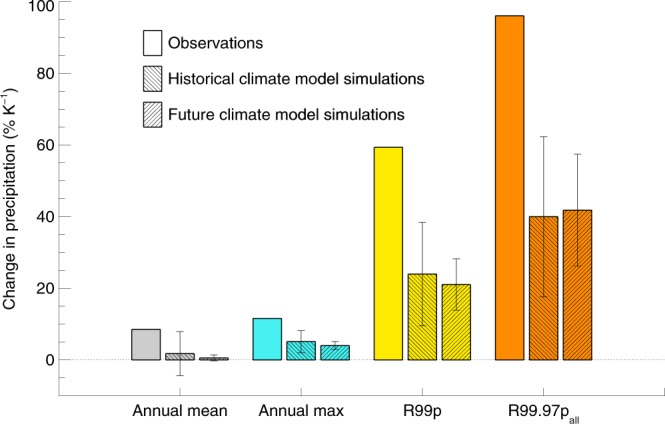
The intensity of the heaviest extreme precipitation events is known to increase with global warming. How often such events occur in a warmer world is however less well established, and the combined effect of changes in frequency and intensity on the total amount of rain falling as extreme precipitation is much less explored, in spite of potentially large societal impacts. Here, we employ observations and climate model simulations to document strong increases in the frequencies of extreme precipitation events occurring on decadal timescales. Based on observations we find that the total precipitation from these intense events almost doubles per degree of warming, mainly due to changes in frequency, while the intensity changes are relatively weak, in accordance to previous studies. This shift towards stronger total precipitation from extreme events is seen in observations and climate models, and increases with the strength - and hence the rareness - of the event. Based on these results, we project that if historical trends continue, the most intense precipitation events observed today are likely to almost double in occurrence for each degree of further global warming. Changes to extreme precipitation of this magnitude are dramatically stronger than the more widely communicated changes to global mean precipitation.


Conflict of interest statement

No competing non-financial interests, but one of the research projects funding this work has received a small part (less than 3% of the total budget) of the funding from an insurance company, If.

Figures

Figure 1
Figure 1
Schematic illustration of the probability density function (PDF) of daily precipitation amount (a). The purple line shows a reference PDF, and the orange line shows how it changes with higher temperatures. For a certain precipitation amount (vertical dotted line), the PDF shift can be decomposed into an increase in intensity (illustrated by the horizontal blue arrow) and an increase in frequency (vertical green arrow). The increase in the total extreme precipitation above a certain threshold is illustrated by the shaded yellow area, which combines intensity and frequency increases. The actual PDFs for two time periods 1906 to 1935 and 1986 to 2015 for the mean of 15 rain gauge stations in the Netherlands (b). Total extreme precipitation changes from E-OBS data between the two periods 1951–1980 and 1984–2013 (c) and the frequency and intensity contribution to total extreme precipitation change (d) for daily precipitation percentiles and scaled by global and annual mean temperature change to derive units of %/K. The 95th percentile occurs on average once in 20 days, 99th percentile once in 100 days, 99.7th percentile once in 333 days, 99.9th percentile once in 1000 days, 99.95th percentile once in 2000 days and 99.97th percentile once in 3333 days.
Figure 2
Figure 2
R99p over Europe from the E-OBS dataset. The green line uses 1951–1980 as a reference period at each grid point for the threshold of the 99th percentile of daily precipitation and this is applied for the 1984–2013 period, which is the standard approach in this study. The yellow line uses first the whole 60-year period (1951–1980 plus 1984–2013) for the calculation of the 99th percentile of daily precipitation on a grid point level and then how the mean varies over this 60-year period. The dotted lines show the mean of R99p for the two periods (1951–1980 and 1984–2013).
Figure 3
Figure 3
Changes in frequency (a) and intensity (b) of extreme rainfall events in observations (E-OBS) and models (CMIP5) between the two periods 1951–1980 and 1984–2013 over Europe. Historical and future (1984–2013 versus 2071–2100) model simulations are shown. The lightest colour is for changes contributing to R99p, medium colour to R99.95all and darkest colour for contributions to R99.97all. Total extreme precipitation change (R99p) shown as a function of change in intensity and frequency for observational data (E-OBS) over Europe (c) for time periods 1951–1980 versus 1984–2013. The colour scale refers to percentage change in R99p. PDFs of intensity and frequency changes are shown on the x-axis and y-axis, respectively. Crosses on the PDFs are mean values of the PDFs and scale to the results in (a,b) for R99p if one accounts for a temperature change of 0.46 K.
Figure 4
Figure 4
Change in R99p in E-OBS (a) and precipitation station data part of the ECA&D database (b) between the two periods 1951–1980 and 1984–2013 (same as in Fig. 1 and Fig S1). E-OBS is plotted as a contour plot, while the colored dots represent precipitation station results of change in R99p. Here, when several gauge data stations are available within an E-OBS grid point, we have averaged their measurements. The requirement of including stations is at least 80%-time coverage. Comparison of E-OBS and ECA&D for the extreme precipitation indices used in this study show good agreement, with no systematic bias between the two data sets (c).
Figure 5
Figure 5
Regional distribution of the change in R99p over Europe from E-OBS between the two periods 1951–1980 and 1984–2013 (a), mean of 16 CMIP5 models 1951–1980 and 1984–2013 (b), PDFs of 16 individual CMIP5 models, their model-mean PDF and observations (c), PDF of observed R99p for two time periods (d), PDF of model simulated R99p for historical, present, and future (2071–2100) (e). Note the x-axis in panel (d,e) refers to the sum of R99p over 30-year periods. In panel b, hatching is provided for grid cells where more than 4 of the 16 models disagree on the sign of the change.
Figure 6
Figure 6
European regional mean frequency of daily 99th percentile of precipitation simulated by CMIP5 models for historical and future conditions (1900–2100). The percentile is calculated in a reference period covering 1900 to 1930. The thin grey lines are for individual CMIP5 models and the solid line is for the multi-model mean.
Figure 7
Figure 7
Change in temporal mean precipitation, annual maximum precipitation (Rx1day), R99p, and in R99.97pall in observations (1951–1980 versus 1984–2013) and CMIP5 climate models (1951–1980 versus 1984–2013 for the historical period and 1984–2013 versus 2071–2100 for future) over Europe. Whiskers around model averages give the spread between individual model results as plus minus one standard deviation.

References

    1. Kharin VV, Zwiers FW, Zhang X, Wehner M. Changes in temperature and precipitation extremes in the CMIP5 ensemble. Climatic Change. 2013;119:345–357. doi: 10.1007/s10584-013-0705-8. - DOI
    1. Boucher, O. et al. In Climate Change 2013: The Physical Science Basis. Contribution of Working Group I to the Fifth Assessment Report of the Intergovernmental Panel on Climate Change (eds T. F. Stocker et al.) 571–657 (Cambridge University Press, Cambridge, United Kingdom and New York, NY, USA, 2013).
    1. Berg P, Moseley C, Haerter JO. Strong increase in convective precipitation in response to higher temperatures. Nature Geosci. 2013;6:181–185. doi: 10.1038/ngeo1731. - DOI
    1. Fischer EM, Knutti R. Observed heavy precipitation increase confirms theory and early models. Nature Clim. Change. 2016;6:986–991. doi: 10.1038/nclimate3110. - DOI
    1. Sillmann J, Kharin VV, Zwiers FW, Zhang X, Bronaugh D. Climate extremes indices in the CMIP5 multimodel ensemble: Part 2. Future climate projections. J. Geophys. Res.-Atmos. 2013;118:2473–2493. doi: 10.1002/jgrd.50188. - DOI

Publication types