. 2019 Nov 5;9(1):16027.
doi: 10.1038/s41598-019-52583-x.

Programming effects of maternal and gestational obesity on offspring metabolism and metabolic inflammation

Affiliations

Programming effects of maternal and gestational obesity on offspring metabolism and metabolic inflammation

E Chang et al. Sci Rep. .

Abstract

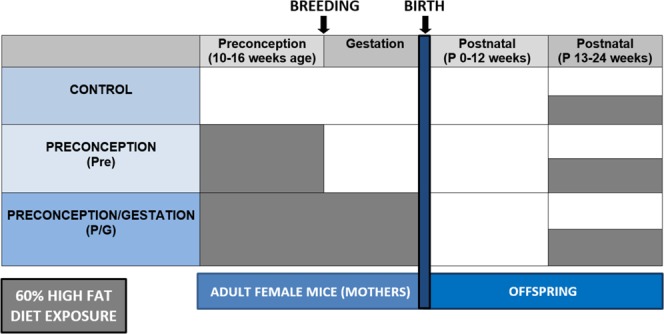
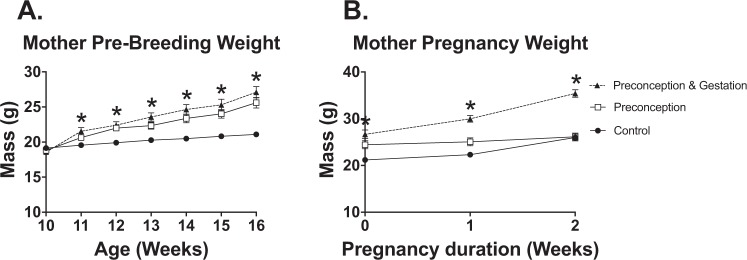
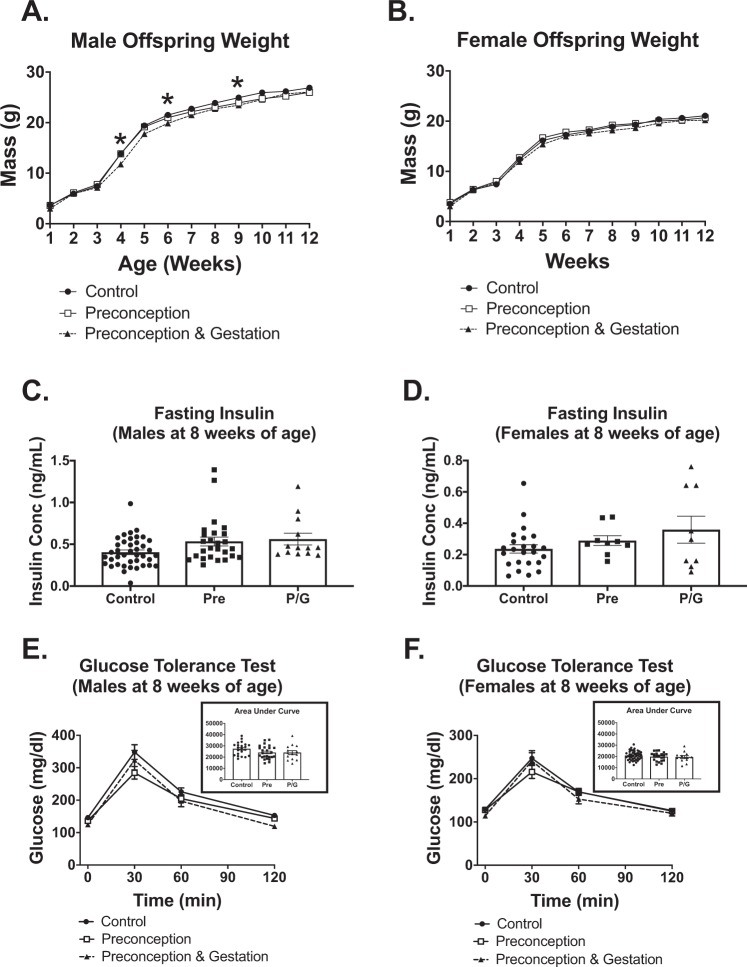
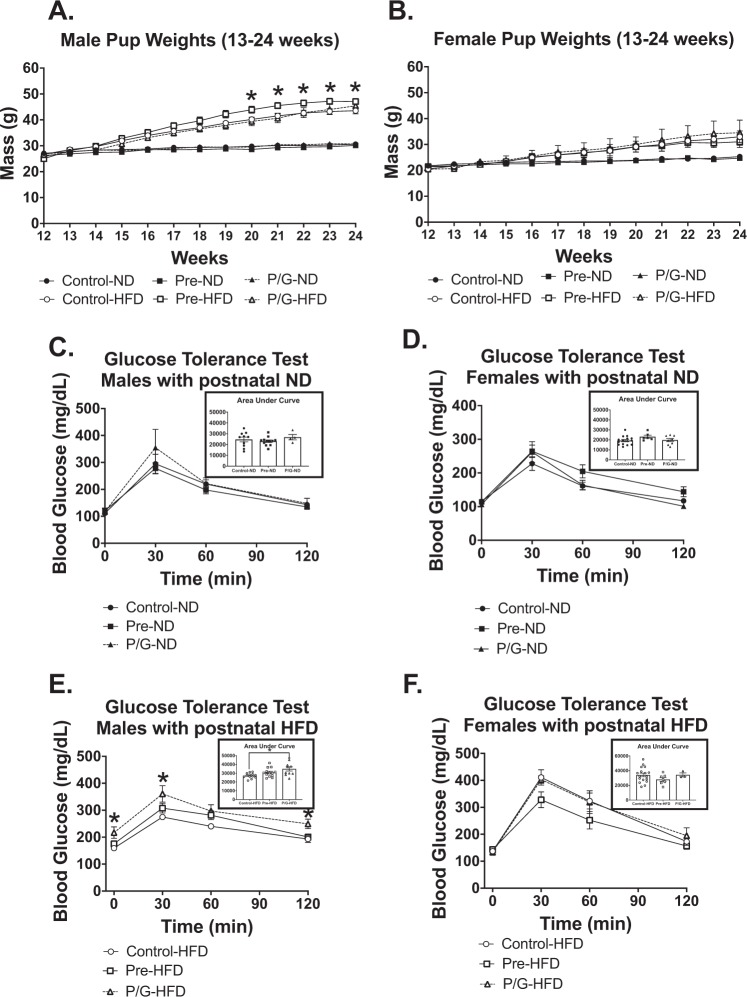
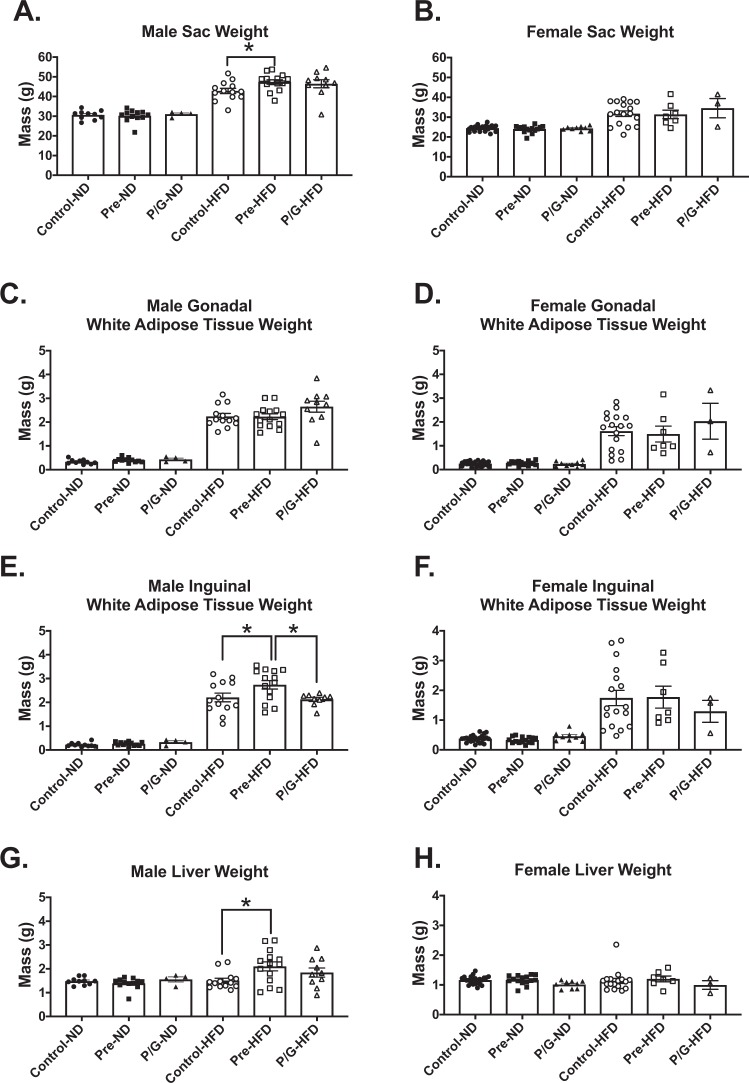
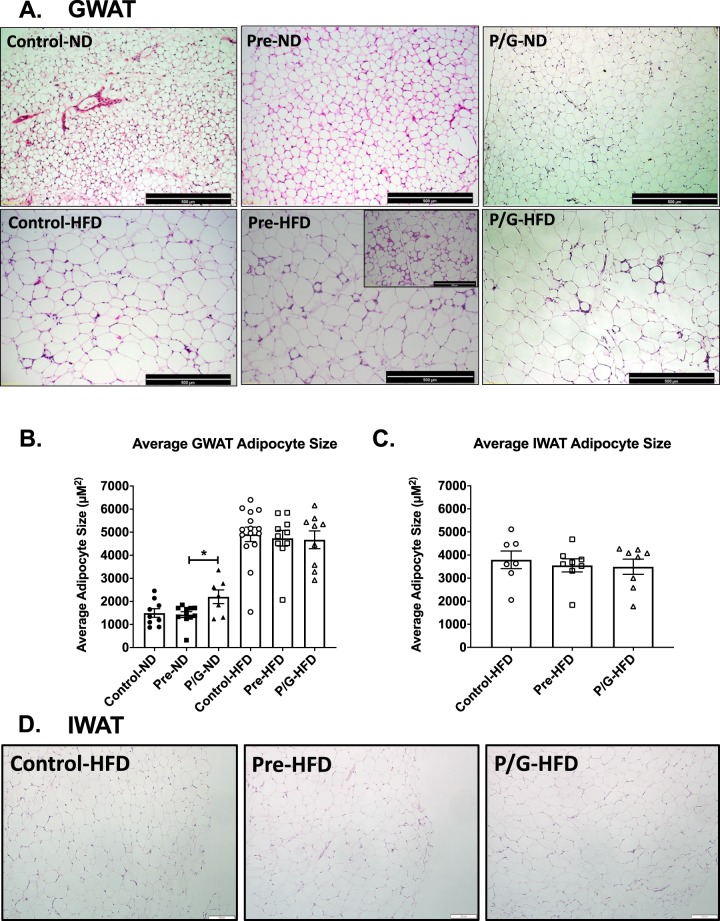
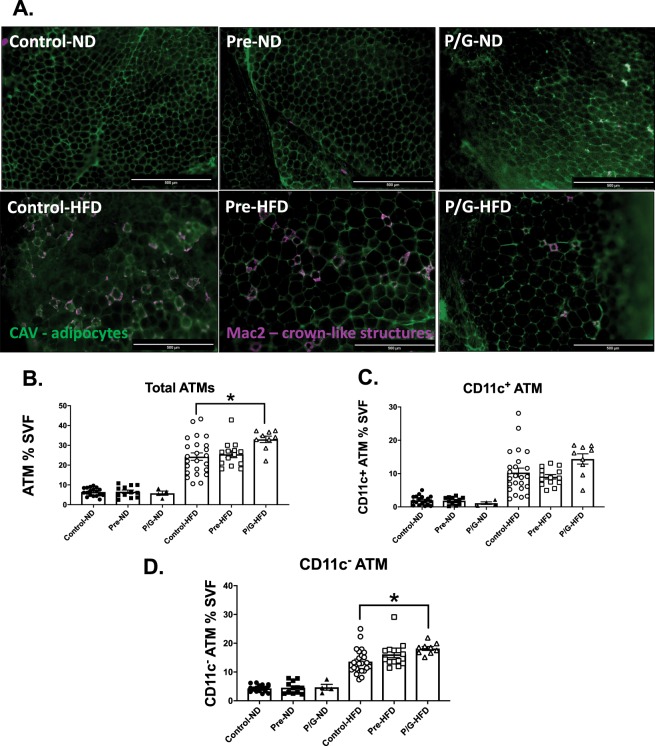
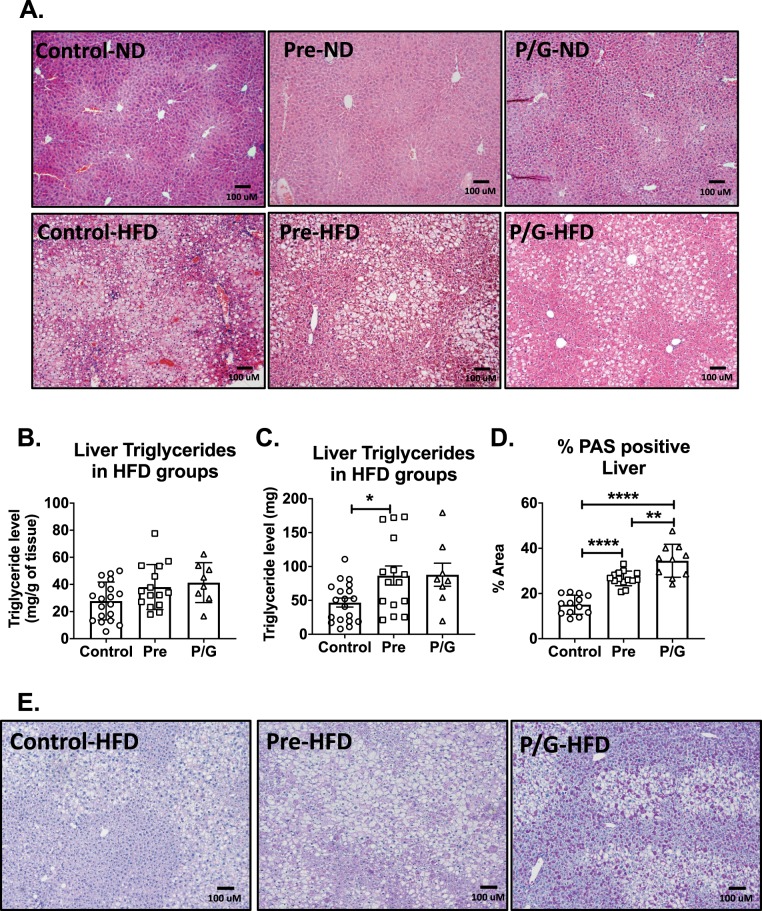
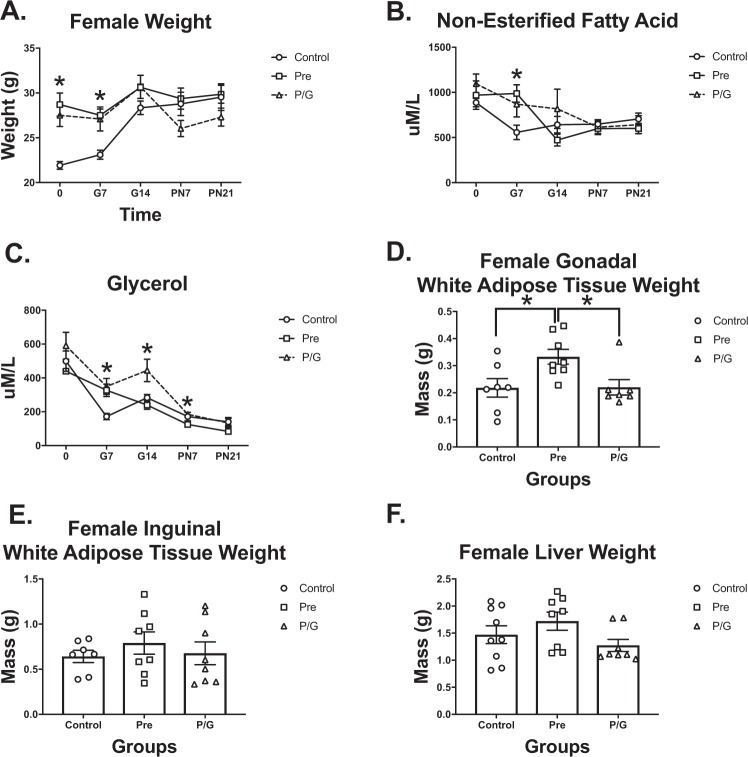
With the increasing prevalence of obesity in women of reproductive age there is a need to understand the ramifications of this on offspring. The purpose of this study is to investigate the programming effects of maternal obesity during preconception and the preconception/gestational period on adiposity and adipose tissue inflammation in offspring using an animal model. Adult female C57Bl/6J mice were assigned either normal diet, high fat diet (HFD) prior to pregnancy, or HFD prior to and through pregnancy. Some offspring were maintained on normal diet while others started HFD later in life. Offspring were assessed for body composition and metabolic responses. Lipid storing tissues were evaluated for expansion and inflammation. Male offspring from the preconception group had the greatest weight gain, most subcutaneous adipose tissue, and largest liver mass when introduced to postnatal HFD. Male offspring of the preconception/gestation group had worsened glucose tolerance and an increase in resident (CD11c-) adipose tissue macrophages (ATMs) when exposed to postnatal HFD. Female offspring had no significant difference in any parameter between the diet treatment groups. In conclusion, this study demonstrates that prenatal and pregnancy windows have independent programming effects on offspring. Preconception exposure affects body composition and adiposity while gestation exposure affects metabolism and tissue immune cell phenotypes.


Conflict of interest statement

The authors declare no competing interests.

Figures

Figure 1
Figure 1
Developmental timeline of human and mouse tissues and cells. This shows the developmental timeline for various tissues and cells from conception through the lactation period. Cells and tissues include: adipocytes, yolk sac (site of early formation of blood), liver hematopoiesis (main site of hematopoietic stem cell expansion and differentiation), and bone marrow hematopoietic stem cell (BM HSC) differentiating into immune cells (e.g. macrophages). This figure was adapted from another of our studies.
Figure 2
Figure 2
Experimental diet groups and HFD exposure timeline. Control group were only on normal diet. The Pre group (Preconception) had mothers with HFD exposure only prior to pregnancy. The P/G (Preconception/Gestation) group had mothers with HFD exposure 6 weeks prior to and through pregnancy. All offspring were on ND for the first 12 weeks of life. At 13 weeks of age, half of the offspring from each diet group were maintained on a normal diet while the other half were switched to HFD.
Figure 3
Figure 3
Maternal characteristics prior to pregnancy and during pregnancy. (A) Mother pre-breeding weight at ages 10–16 weeks of age, Control (n = 32), Pre (n = 18), P/G (n = 15). (B) Pregnancy weight, Control (n = 28), Pre (n = 18), P/G (n = 15). *p value < 0.05. Pre and P/G mothers had expected increase of pre-breeding weight due to HFD. During pregnancy, P/G group continued to gain weight while the Pre group’s weight converged with the Control group.
Figure 4
Figure 4
Male and female offspring metabolic characteristics prior to postnatal HFD. Weekly weights from 1–12 weeks of age (A) in male and (B) in female offspring, Male: Control (n = 22), Pre (n = 26), P/G (n = 16); Female: Control (n = 47), Pre (n = 22), P/G (n = 14). *p < 0.05. Fasting insulin at 8 weeks (C) in male and (D) in female offspring, Male: Control (n = 40), Pre (n = 26), P/G (n = 12); Female: Control (n = 25), Pre (n = 9), P/G (n = 10). Glucose tolerance test with AUC at 8 weeks (E) in male and (F) in female offspring, Male: Control (n = 22), Pre (n = 25), P/G (n = 14); Female: Control (n = 43), Pre (n = 22), P/G (n = 12). Among the male groups, P/G intermittently had lower weights. There was no significant difference in fasting insulin and GTT for both male and female.
Figure 5
Figure 5
Male and female offspring metabolic characteristics on postnatal ND or postnatal HFD. Weekly weights from 13–24 weeks of age (A) in male and (B) in female offspring, Male: Control-ND (n = 10), Pre-ND (n = 12), P/G-ND (n = 4), Control-HFD (n = 12), Pre-HFD (n = 14), P/G-HFD (n = 10); Female: Control-ND (n = 6), Pre-ND (n = 6), Control-HFD (n = 17), Pre-HFD (n = 7), P/G-HFD (n = 3). *p < 0.05 GTT and AUC at 22 weeks for groups with postnatal ND (C) in male and (D) in female offspring, Male: Control-ND (n = 10), Pre-ND (n = 12), P/G-ND (n = 4); Female: Control-ND (n = 15), Pre-ND (n = 6), P/G-ND (n = 9). GTT and AUC at 22 weeks for groups with postnatal HFD (E) in male and (F) in female offspring. Male: Control-HFD (n = 11), Pre-HFD (n = 14), P/G-HFD (n = 10); Female: Control-ND (n = 17), Pre-ND (n = 7), P/G-ND (n = 3). *p < 0.05. Among the male groups with postnatal HFD, there was a significant increase in body weight, greatest for Pre group from week 20–24. For IPGTT, P/G with postnatal HFD had the worst glucose tolerance.
Figure 6
Figure 6
Male and female offspring tissue weights at 24 weeks. Sac weight for the groups with postnatal ND and postnatal HFD (A) in male and (B) in female offspring. GWAT weight for the groups with postnatal ND and postnatal HFD (C) in male and (D) in female mice. IWAT weight for the groups with postnatal ND and postnatal HFD (E) in male and (F) in female. Liver weight for the groups with postnatal ND and postnatal HFD (G) in male and (H) in female. *p < 0.05. Male: Control-ND (n = 10), Pre-ND (n = 12), P/G-ND (n = 4), Control-HFD (n = 13), Pre-HFD (n = 14), P/G-HFD (n = 10); Female: Control-ND (n = 23), Pre-ND (n = 15), P/G-ND (n = 10), Control-HFD (n = 17), Pre-HFD (n = 7), P/G-HFD (n = 3).
Figure 7
Figure 7
Morphology of GWAT and IWAT in male offspring at 24 weeks of age. (A) Hematoxylin and eosin (HE) staining of GWAT of groups (Control, Pre, P/G) with postnatal ND (top row) and with postnatal HFD (bottom row). The Pre-HFD shows different degrees of fibrosis (smaller and larger image). (B) Average adipocyte sizes comparing groups with postnatal ND (n = 8 per group). Average adipocyte sizes were all significantly larger with postnatal HFD but there was no significant difference among the postnatal HFD groups, Control-HFD (n = 15), Pre-HFD (n = 10), P/G-HFD (n = 9). (C) Average IWAT adipocyte size (n = 8 per group) in the prenatal HFD challenged group. (D) H&E staining of IWAT from the prenatal HFD challenged group. *p < 0.05.
Figure 8
Figure 8
Immunofluorescence and flow cytometry studies of GWAT in male offspring at 24 weeks of age. (A) Staining of adipocytes (Caveolin, green) and cluster of macrophage crown-like structures (Mac2, magenta). Groups with postnatal HFD have larger adipocytes and more macrophage crown-like structures. GWAT shows increased crown-like structures with postnatal HFD. The Pre-HFD shows different degrees of crown-like structures (smaller and larger image) (B) GWAT ATM of SVF: Control-ND (n = 18), Pre-ND (n = 12), P/G-ND (n = 4), Control-HFD (n = 24), Pre-HFD (n = 14), P/G-HFD (n = 9) (C) CD11c+ ATMs of SVF: Control-ND (n = 18), Pre-ND (n = 12), P/G-ND (n = 4), Control-HFD (n = 24), Pre-HFD (n = 14), P/G-HFD (n = 9) (D) CD11c ATM of SVF: Control-ND (n = 18), Pre-ND (n = 12), P/G-ND (n = 4), Control-HFD (n = 24), Pre-HFD (n = 14), P/G-HFD (n = 9) *p < 0.05. Flow cytometry of male GWAT at 24 weeks of age show an increase in CD11c ATMs in P/G group.
Figure 9
Figure 9
Liver morphology and triglyceride content in male offspring. (A) Hematoxylin and eosin (HE) staining of liver of male groups (Control, Pre, P/G) with postnatal ND (top row) and with postnatal HFD (bottom row). There are increased lipid globules with postnatal diet. (B) Comparison of liver triglyceride content adjusted for liver weight (milligram of triglyceride per gram of liver) between the male groups with postnatal HFD. Control-HFD (n = 18), Pre-HFD (n = 15), P/G-HFD (n = 8). (C) Comparison of absolute liver triglyceride content (measured in milligram) between the male groups with postnatal HFD. Control-HFD (n = 18), Pre-HFD (n = 15), P/G-HFD (n = 8). There is no significant difference in liver triglyceride content among groups with postnatal HFD. (D) Quantification of % Area of liver stained with PAS from postnatal HFD groups and (E) representative images PAS staining of liver of postnatal HFD groups.
Figure 10
Figure 10
Maternal characteristics at the start of pregnancy (0) to postnatal day 21 (PN21) Following 6 weeks of HFD breeding cages were established and (A) mother weight from 0 thru PN21 charted for all groups. Control (n = 7), Pre (n = 8), P/G (n = 8). (B) Non-esterified fatty acid from 0 thru PN21. Control (n = 7), Pre (n = 8), P/G (n = 8) (C) Glycerol from 0 thru PN21. Control (n = 7), Pre (n = 8), P/G (n = 8) (D) IWAT weight. Control (n = 7), Pre (n = 8), P/G (n = 8) (E) GWAT weight. Control (n = 7), Pre (n = 8), P/G (n = 8) (F) Liver weight. Control (n = 7), Pre (n = 8), P/G (n = 8) *p < 0.05. During pregnancy, Pre and P/G group continued to gain weight. P/G lost weight when HFD was discontinued at time of birth. There was a significant difference in NEFA at G7, in glycerol from G7-P7. The pre-pregnancy HFD mothers (Pre) mother had the greatest GWAT weight at the end of the lactation period.

References

    1. Heslehurst N, Rankin J, Wilkinson JR, Summerbell CD. A nationally representative study of maternal obesity in England, UK: trends in incidence and demographic inequalities in 619 323 births, 1989-2007. Int J Obes (Lond) 2010;34:420–428. doi: 10.1038/ijo.2009.250. - DOI - PubMed
    1. Nohr EA, et al. Combined associations of prepregnancy body mass index and gestational weight gain with the outcome of pregnancy. Am J Clin Nutr. 2008;87:1750–1759. doi: 10.1093/ajcn/87.6.1750. - DOI - PubMed
    1. Ng M, et al. Global, regional, and national prevalence of overweight and obesity in children and adults during 1980-2013: a systematic analysis for the Global Burden of Disease Study 2013. Lancet. 2014;384:766–781. doi: 10.1016/S0140-6736(14)60460-8. - DOI - PMC - PubMed
    1. Singer K, Lumeng CN. The initiation of metabolic inflammation in childhood obesity. J Clin Invest. 2017;127:65–73. doi: 10.1172/JCI88882. - DOI - PMC - PubMed
    1. Hanks LJ, Simpson T, McCormick K, Casazza K. Pediatric obesity prevention: From naive examination of energy imbalance towards strategies that influence the competition for nutrient resources among tissues. World J Clin Pediatr. 2015;4:50–54. doi: 10.5409/wjcp.v4.i4.50. - DOI - PMC - PubMed

Publication types

MeSH terms