Clinical Trial
. 2019 Nov 5;9(1):16065.
doi: 10.1038/s41598-019-52561-3.

Myofascial trigger points alter the modular control during the execution of a reaching task: a pilot study

Affiliations
Clinical Trial

Myofascial trigger points alter the modular control during the execution of a reaching task: a pilot study

Tommaso Geri et al. Sci Rep. .

Abstract

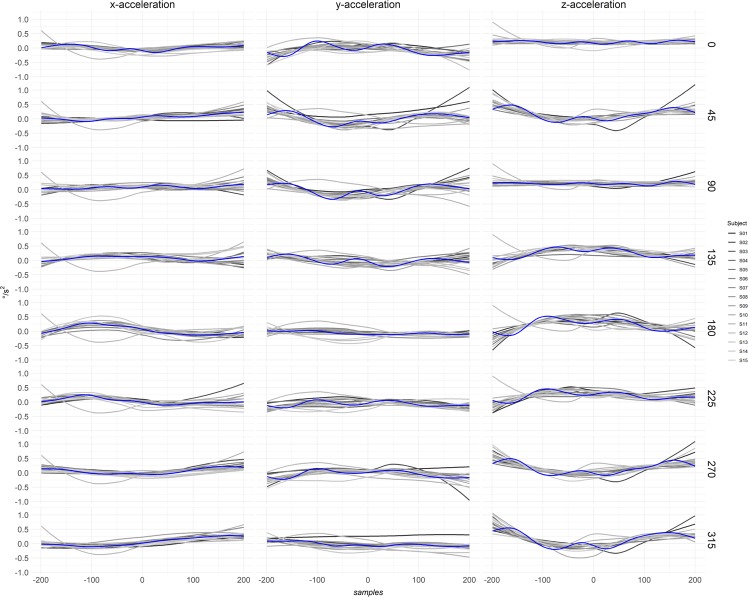
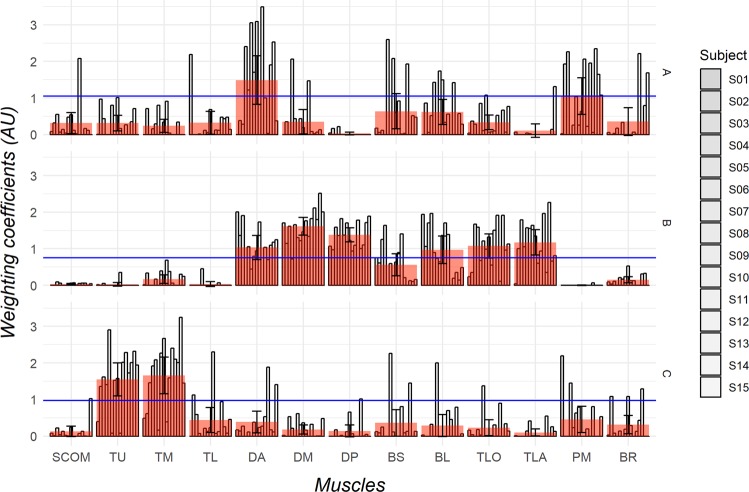
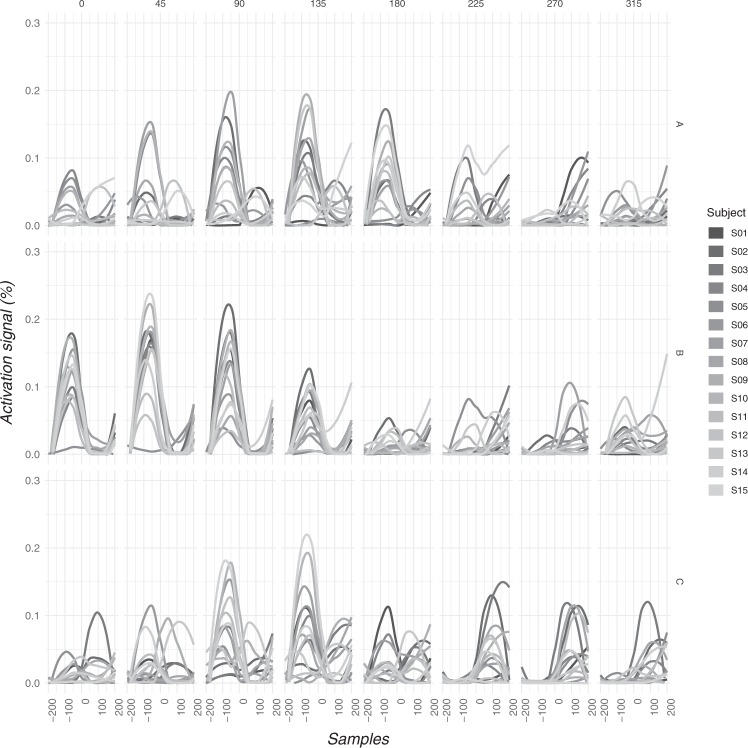
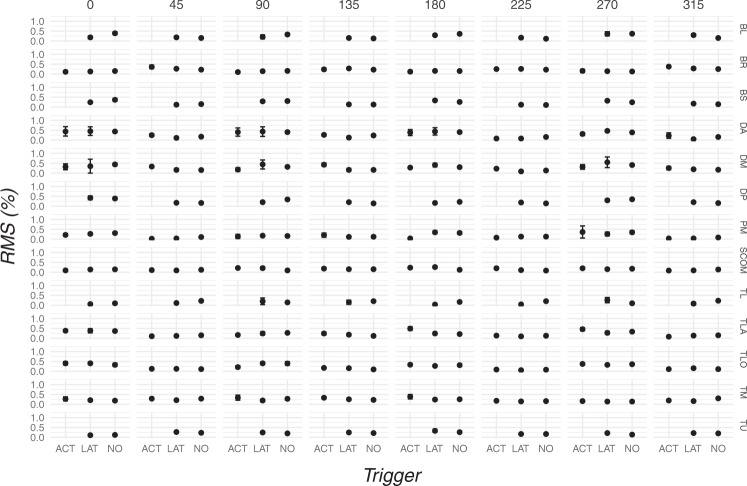
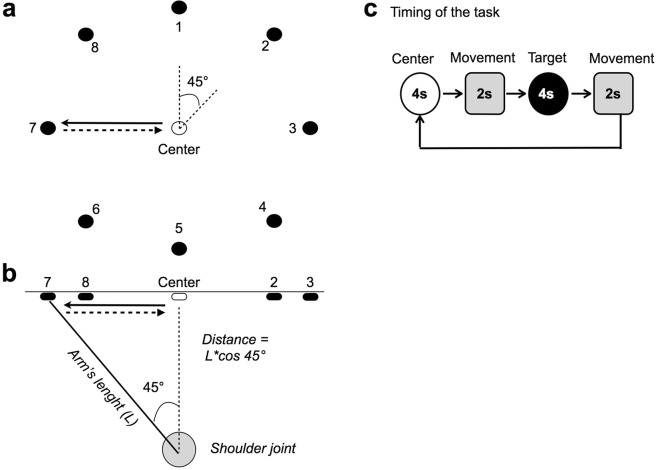
Myofascial trigger points (TP) constitute a conundrum in research and clinical practice as their etiopathogenesis is debated. Several studies investigating one or few muscles have shown that both active and latent TP causes an increased muscle activity, however the influence of TP on modular motor control during a reaching task is still unclear. Electromyographic signals, recorded from the muscles of the shoulder girdle and upper arm during a reaching task, were decomposed with Non-Negative Matrix Factorization algorithm. The extracted matrices of motor modules and activation signals were used to label the muscles condition as dominant or non-dominant. The presence of latent and active TP was detected in each muscle with manual examination. Despite a similar muscle activity was observed, we found that muscles with active TP had increased weighting coefficients when labeled in the dominant condition. No influences were found when muscles were in the non-dominant condition. These findings suggest that TP altered the motor control without co-contraction patterns. As a preliminary evidence, the present results suggest that the increased weighting coefficients in presence of TPs are associated with an alteration of the modular motor control without affecting the dimensionality of motor modules for each individual and reciprocal inhibition.


Conflict of interest statement

The authors declare no competing interests.

Figures

Figure 1
Figure 1
Time-profiles of x-, y-, z-accelerations of the wrist inertial sensor. In each column, the raw data of the kinematic variable is plotted versus the samples. The blue line represents the averaged value. The different number of samples from the one of the activation signals (see Fig. 3) is due to the different sampling frequency of the inertial sensor acquisition system. Each subject is represented by a line shaded in grey scale. Please note that the order of target is reported in degrees of a cartesian plane, therefore the order of target from top to bottom is 3, 2, 1, 8, 7, 6, 5, 4.
Figure 2
Figure 2
Motor modules retrieved from dimensionality analysis. Weighting coefficients are plotted for each subject and the mean with standard error in each synergy is superimposed for each muscle to show which are the dominant muscles for each synergy. Module A had the DA as dominant muscle, Module B had the DA, DM, DP, BL, TLO, and TLA muscle; and Module C had the TU and TM muscles. Note that despite the mean indicate an averaged dominant muscle, some subjects may have lower or higher weighting coefficients for that muscle (see Supplementary Fig. S2). Modules A, B, and C are described on the right. AU, Arbitrary Unit; BL, Biceps Long head; BS, Biceps Short head; BR, Brachioradialis; DA, Deltoid Anterior; DM, Deltoid Middle; DP, Deltoid Posterior; TL, Trapezius Lower; TM, Trapezius Middle; PM, Pectoralis Major; SCOM, Sterno-Cleido-Occipito-Mastoideus; TLA, Triceps Lateral head; TLO, Triceps Long head; TU, Trapezius Upper.
Figure 3
Figure 3
Time-profiles of the activation signals of all subjects for all motor modules and angles. Note that modules 2 and 3 overlaps for certain angles: this happened because some subjects achieved the criterion at 2 modules but 3 modules were extracted for all subjects in order to have comparable and meaningful data. Modules A, B, and C are described on the right. Please note that the order of target is reported in degrees of a cartesian plane, therefore the order of target from left to right is 3, 2, 1, 8, 7, 6, 5, 4.
Figure 4
Figure 4
Second order interaction plot representing the influence of active trigger points on muscles in the dominant condition (black) while in the non-dominant condition (grey) there is no difference between muscles with or without trigger points. Small dots aligned above the three columns of trigger point presence conditions (ACT, LAT, NO) represent every single observation. Big black dots on the left and the big grey dots on the right of each column represented the mean values with error bars predicted by the mixed model. ACT, Active trigger point; AU, Arbitrary Unit; LAT, Latent trigger point; NO, Absence of trigger point.
Figure 5
Figure 5
Mean and error bars of RMS of the three TP conditions (bottom) of each muscle (right) represented for every target (top). Increased muscle activities in presence of active TP were revealed for the TLA muscle at 180° and the DM muscle at 135°. A significant RMS decrease associated with active TP was detected for the PM muscle at 180°. Please note that the order of target is reported in degrees of a cartesian plane, therefore the order of target from left to right is 3, 2, 1, 8, 7, 6, 5, 4. ACT, Active trigger point; BL, Biceps Long head; BS, Biceps Short head; BR, Brachioradialis; DA, Deltoid Anterior; DM, Deltoid Middle; DP, Deltoid Posterior; LAT, Latent trigger point; TL, Trapezius Lower; TM, Trapezius Middle; PM, Pectoralis Major; RMS, Root Mean Square; SCOM, Sterno-Cleido-Occipito-Mastoideus; TLA, Triceps Lateral head; TLO, Triceps Long head; TU, Trapezius Upper.
Figure 6
Figure 6
Experimental setup. (a) The wood panel had customized rails to adjust the radius of the circumference according to the distance between the shoulder joint and the central target to account for the inter-individual variability of arm’s length. (b) Geometric description of the criterion used to set the distance between the shoulder joint and the central target. The subjects had to reach each target with a straight elbow whilst the hand moved approximately 45° away from the initial position. (c) The task rhythm was paced in four timeframes. In the first, the subject pushed the central button for 4 seconds while keeping the arm on the horizontal plane. In the second, the subject reached one radial target in about 2 seconds. In the third, the subject pressed the radial button for 4 seconds. In the fourth, the subject moved back to press the central target for about 2 seconds and then relaxed the arm.

References

    1. Lluch E, et al. Prevalence, incidence, localization, and pathophysiology of myofascial trigger points in patients with spinal pain: A systematic literature review. J Manipulative Physiol Ther. 2015;38:587–600. doi: 10.1016/j.jmpt.2015.08.004. - DOI - PubMed
    1. Simons, D. G., Travell, J. G. & Simons, L. S. Myofascial pain and dysfunction. The trigger point manual. 2nd edn Vol.1 Upper half of the body. (Williams & Wilkins, 1999).
    1. Fernandez-de-Las-Penas C, Dommerholt J. International consensus on diagnostic criteria and clinical considerations of myofascial trigger points: A delphi study. Pain Med. 2018;19:142–150. doi: 10.1093/pm/pnx207. - DOI - PubMed
    1. Gerwin RD, Dommerholt J, Shah JP. An expansion of simons’ integrated hypothesis of trigger point formation. Curr Pain Headache Rep. 2004;8:468–475. doi: 10.1007/s11916-004-0069-x. - DOI - PubMed
    1. Partanen J. End plate spikes in the human electromyogram. Revision of the fusimotor theory. J Physiol Paris. 1999;93:155–166. doi: 10.1016/S0928-4257(99)80146-6. - DOI - PubMed

Publication types