Review
. 2020 Mar;206(2):109-124.
doi: 10.1007/s00359-019-01375-9. Epub 2019 Nov 5.

How fly neurons compute the direction of visual motion

Affiliations
Review

How fly neurons compute the direction of visual motion

Alexander Borst et al. J Comp Physiol A Neuroethol Sens Neural Behav Physiol. 2020 Mar.

Abstract

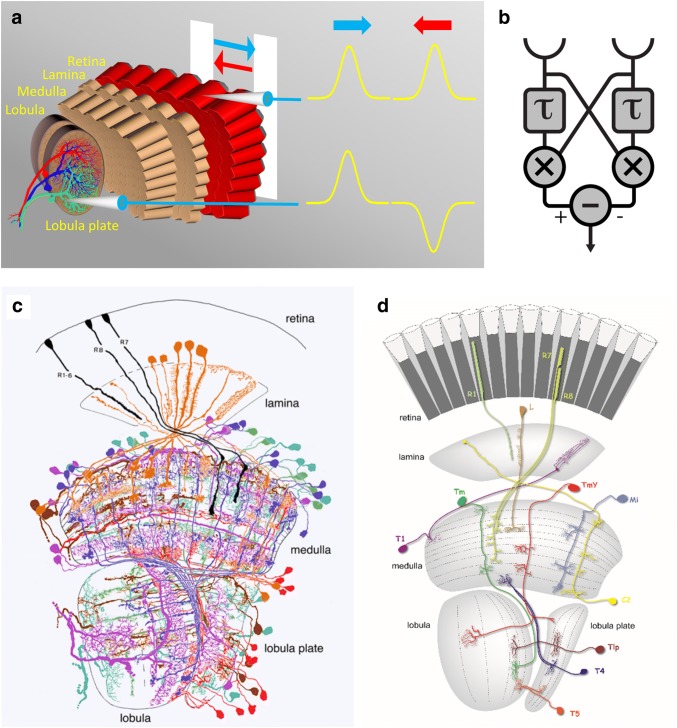
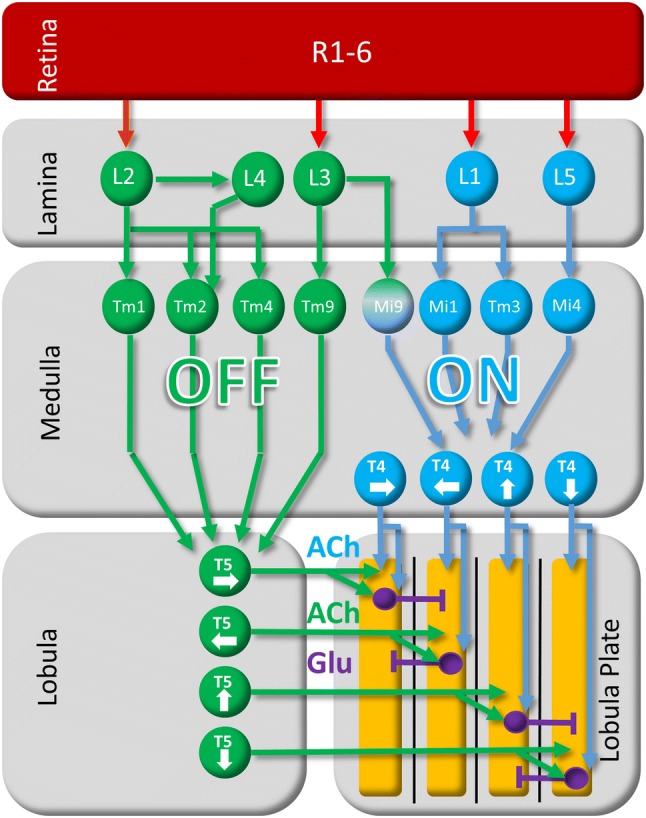
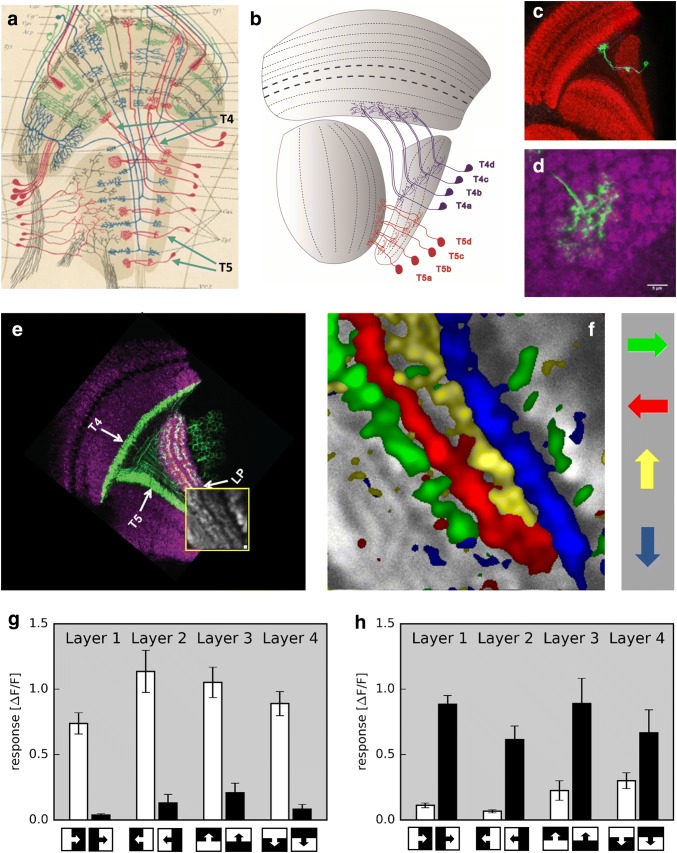
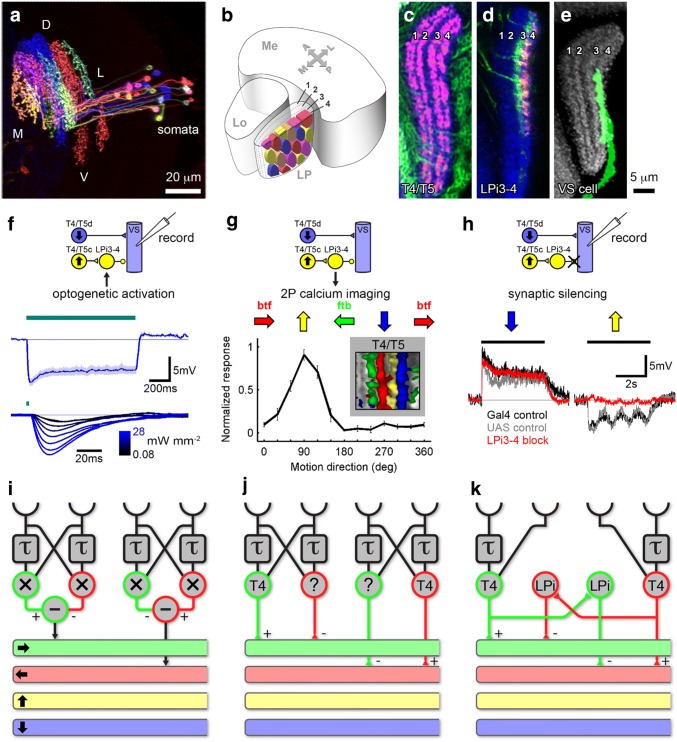
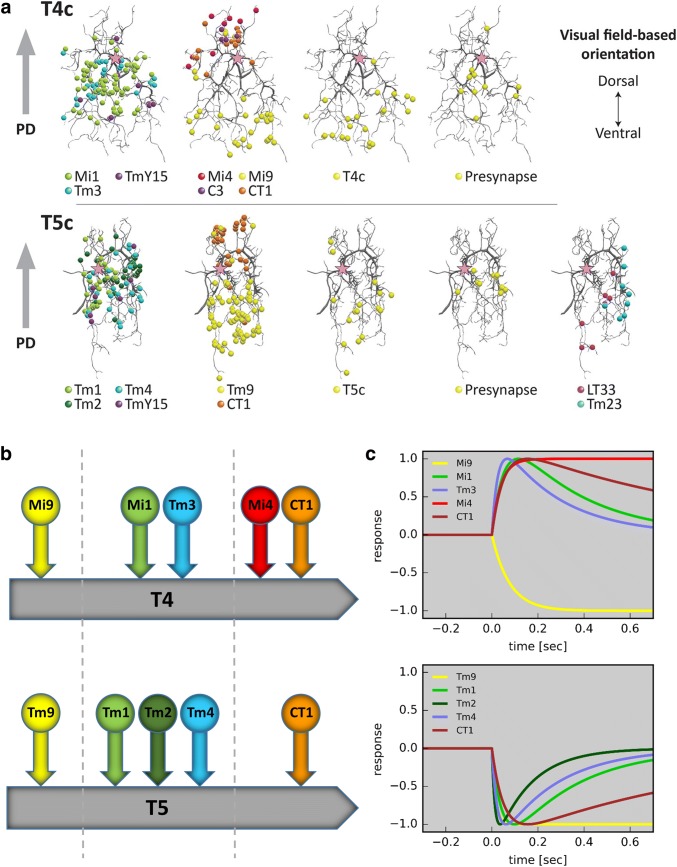
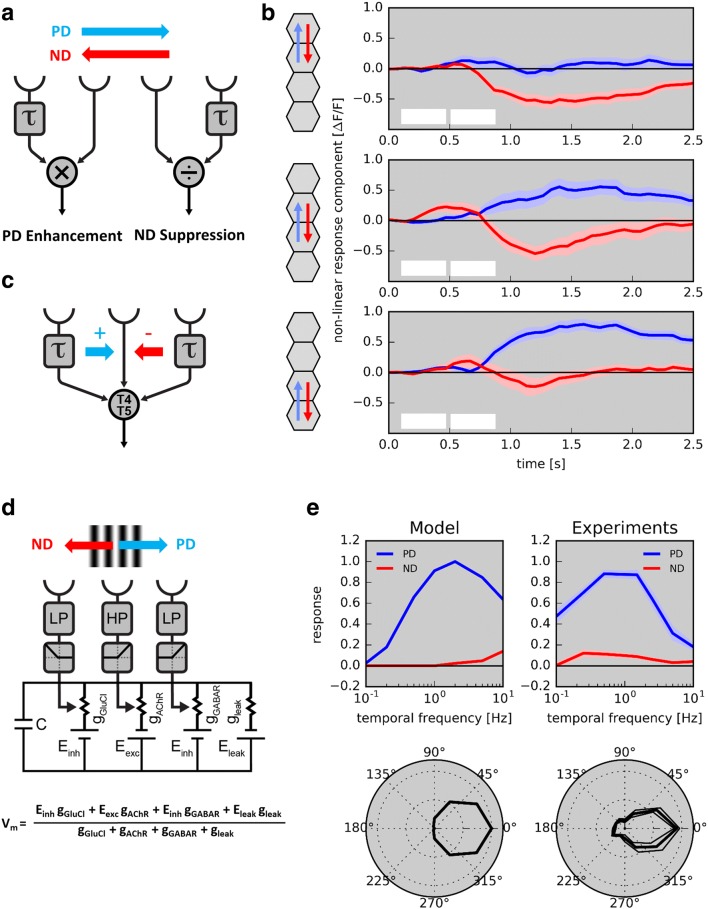
Detecting the direction of image motion is a fundamental component of visual computation, essential for survival of the animal. However, at the level of individual photoreceptors, the direction in which the image is shifting is not explicitly represented. Rather, directional motion information needs to be extracted from the photoreceptor array by comparing the signals of neighboring units over time. The exact nature of this process as implemented in the visual system of the fruit fly Drosophila melanogaster has been studied in great detail, and much progress has recently been made in determining the neural circuits giving rise to directional motion information. The results reveal the following: (1) motion information is computed in parallel ON and OFF pathways. (2) Within each pathway, T4 (ON) and T5 (OFF) cells are the first neurons to represent the direction of motion. Four subtypes of T4 and T5 cells exist, each sensitive to one of the four cardinal directions. (3) The core process of direction selectivity as implemented on the dendrites of T4 and T5 cells comprises both an enhancement of signals for motion along their preferred direction as well as a suppression of signals for motion along the opposite direction. This combined strategy ensures a high degree of direction selectivity right at the first stage where the direction of motion is computed. (4) At the subsequent processing stage, tangential cells spatially integrate direct excitation from ON and OFF-selective T4 and T5 cells and indirect inhibition from bi-stratified LPi cells activated by neighboring T4/T5 terminals, thus generating flow-field-selective responses.

Keywords: Direction selectivity; Drosophila; Null direction suppression; Optic lobe; Preferred direction enhancement; Visual motion.


Conflict of interest statement

The authors declare that they have no conflict of interest.

Figures

Fig. 1
Fig. 1
a Schematic illustration of the central phenomena of direction selectivity: moving a bar in front of the fly’s eye leads to a depolarization of photoreceptors each time, no matter whether the bar moves to the right or to the left. These signals are non-directional. Just a few synapses downstream, at the level of the lobula plate tangential cells, signals are direction-selective: These cells depolarize during motion along one, i.e., their ‘preferred’, and hyperpolarize during motion along the opposite, i.e., their ‘null’ direction. b Hassenstein–Reichardt model for elementary motion detection (τ low-pass filter; × multiplication). c Collection of all the different columnar cell types found in the Drosophila optic lobe (after Fischbach and Dittrich 1989). d Schematics of individual cell type classes (from Borst 2009)
Fig. 2
Fig. 2
General layout of the neural circuit for motion vision in Drosophila. Note that the actual circuitry is more complex, in particular with respect to the medulla neurons involved as well as their synaptic interactions. ACh acetylcholine, Glu glutamate
Fig. 3
Fig. 3
T4 and T5 cells are the elementary, motion-sensing neurons in the fly visual system. a First drawing of T4 and T5 cells (Cajal and Sanchez ; ‘T4’ and ‘T5’ labels and arrows added). b Schematic of the four types of T4 and T5 cells (after Fischbach and Dittrich 1989). c Individual T4 cell (Schilling and Pujol-Marti, unpublished). d Dendrite of an individual T4 cell extending across multiple medulla columns (Haag et al. 2016). e Confocal image of the optic lobe of a driver line, expressing in T4 and T5 cells (Maisak et al. 2013). f Calcium imaging reveals four subtypes tuned to four cardinal directions, each projecting to one of the four layers of the lobula plate (Maisak et al. 2013). g, h T4 cells (g) respond preferentially to moving ON edges; T5 cells (h) preferentially to moving OFF edges (data from Maisak et al. 2013)
Fig. 4
Fig. 4
Intrinsic lobula plate neurons (LPi) implement the subtraction of opponent T4/T5 cells within the lobula plate. a Multicolor flip-out showing several individual LPi neurons tiling the lobula plate in visual space. b Schematic representation of the dendritic fields of adjacent LPi neurons. c Horizontal cross section of the lobula plate, with T4/T5 cells expressing GFP (green) and presynaptic synaptotagmin-HA (sytHA, red). The axon terminals form four layers. d LPi neurons expressing GFP (green) and presynaptic synaptotagmin-HA (sytHA, red). Neurons ramify in layers 3 and 4, but have presynaptic specializations restricted to layer 4 only. e A VS cell with downward direction selectivity extends its dendrite to layer 4. f The synaptic connection between LPi and VS cells probed functionally by optogenetic stimulation of LPi cells and patch-clamp recordings from VS cells. 1 s light stimulation of LPi neurons evokes a sustained hyperpolarizing potential (upper recording trace). 2 ms light stimulation elicits short latency hyperpolarizing responses that increase in amplitude with increasing light intensity (lower recording traces and light intensity in mW/mm2 color-coded from black-to-blue). g Visual activity in LPi3-4 neurons measured by 2P-calcium imaging. Normalized response is shown as a function of grating motion direction in degrees (deg). LPi3–4 neurons respond preferentially to upward motion, as do T4 and T5 cells terminating in layer 3. Note that red (btf: back-to-front) and green (ftb: front-to-back) arrows indicating motion direction are flipped compared to Fig. 3f, because experiments were done on different body sides. Left, this panel; right, Fig. 3f. h Visually evoked potential changes recorded via patch clamp from VS cells in three experimental fly strains: two controls (black and gray) with fully intact visual circuitry as well as flies with LPi3–4 neurons genetically silenced (red). VS cells in control flies exhibit motion-opponent responses, with depolarization in response to downward and hyperpolarization in response to upward motion. Blocking LPi cells leaves the depolarizing preferred direction response of tangential cells unaffected, but abolishes their hyperpolarizing null direction response. Recording traces over time represent the mean across several cells. mV millivolt, s second. i–k Relation of the algorithmic Hassenstein–Reichardt detector to the actual circuitry as found in the fly optic lobe. All panels except c and i–k adapted from Mauss et al. (2015). c adapted from Mauss et al. (2014). Inset in panel g adapted from Maisak et al. (2013)
Fig. 5
Fig. 5
Synaptic input organization of T4 and T5 cells. a Spatial distribution of individual synapses of the various medulla cell types onto T4 (upper panel) and T5 (lower panel) cells, sensitive for upward motion, i.e., T4c and T5c (Shinomiya et al. 2019). b Schematic summary of data shown in a. c Step responses of most input cell types as derived from reverse reconstruction, using white noise stimuli and calcium imaging (Arenz et al. ; Meier and Borst 2019). Note that cells respond either with activity increase or decrease to stimulus onset at time point zero. Apart from the response sign, cells fall into two classes: low-pass (no response decay over time; Mi4, Mi9, and Tm9) and band-pass (after a peak, response decays back to baseline; Mi1, Tm3, CT1, Tm1, Tm2, Tm4, and CT1)
Fig. 6
Fig. 6
Core mechanism creating direction selectivity in T4 and T5 neurons. a Two alternative models to create direction selectivity: preferred direction enhancement (left) and null direction suppression (right). b Experiment to distinguish between the two mechanisms. Visual stimuli are placed onto the hexagonal grid of the fly eye via a telescope and responses are measured by 2P calcium imaging in upward motion-sensitive T4 cells. Two adjacent units in visual space (each unit comprising several photoreceptors ‘looking’ in the same direction) are stimulated sequentially along the preferred (blue arrows) or the null direction (red arrows) of the cell (apparent motion) or individually (no motion). First, responses to adjacent individual stimulations are shifted in time to match the time course of sequential stimulation and then summed, yielding a linear response expectation. Second, this linear expectation is subtracted from the response to the sequential apparent motion stimulation, yielding the non-linear response component. A positive deflection demonstrates a non-linear enhancement of signals (observed for the preferred direction), while a negative deflection indicates a non-linear suppression (observed for the null direction) (Haag et al. 2016, 2017). White boxes indicate the timing of sequential and individual single unit stimulation. c Algorithmic three-arm detector model based on calcium measurements from T4 and T5: the central input is amplified by a delayed signal from the preferred side and suppressed by a delayed signal from the null side. d Biophysical model implementing a three-arm model on the basis of ionic conductances (Borst 2018). Note that the left arm is an OFF element, while the central and right arms are ON elements. e Model performance versus experimental data (left from Borst ; right from Arenz et al. 2017). Top: temporal frequency tuning to gratings moving along the preferred (‘PD’, blue) and the null direction (‘ND’, red). Bottom: directional tuning to gratings moving in 12 different directions in steps of 30°

References

    1. Akerboom J, Chen TW, Wardill TJ, Tian L, Marvin JS, Mutlu S, Calderón NC, Esposti F, Borghuis BG, Sun XR, Gordus A, Orger MB, Portugues R, Engert F, Macklin JJ, Filosa A, Aggarwal A, Kerr RA, Takagi R, Kracun S, Shigetomi E, Khakh BS, Baier H, Lagnado L, Wang SS, Bargmann CI, Kimmel BE, Jayaraman V, Svoboda K, Kim DS, Schreiter ER, Looger LL. Optimization of a GCaMP calcium indicator for neural activity imaging. J Neurosci. 2012;32:13819–13840. - PMC - PubMed
    1. Ammer G, Leonhardt A, Bahl A, Dickson BJ, Borst A. Functional specialization of neural input elements to the Drosophila ON motion detector. Curr Biol. 2015;25:2247–2253. - PubMed
    1. Anstis SM, Rogers BJ. Illusory reversal of visual depth and movement during changes of contrast. Vision Res. 1975;15:957–961. - PubMed
    1. Arenz A, Drews MS, Richter FG, Ammer G, Borst A. The temporal tuning of the Drosophila motion detectors is determined by the dynamics of their input elements. Curr Biol. 2017;27:929–944. - PubMed
    1. Badwan BA, Creamer MS, Zavatone-Veth JA, Clark DA. Dynamic nonlinearities enable direction opponency in Drosophila elementary motion detectors. Nat Neurosci. 2019;22:1318–1326. - PMC - PubMed

Publication types

LinkOut - more resources