. 2020 Jan;64(1):33-51.
doi: 10.1111/1348-0421.12754. Epub 2019 Nov 18.

Gold nanoparticle-adjuvanted S protein induces a strong antigen-specific IgG response against severe acute respiratory syndrome-related coronavirus infection, but fails to induce protective antibodies and limit eosinophilic infiltration in lungs

Affiliations

Gold nanoparticle-adjuvanted S protein induces a strong antigen-specific IgG response against severe acute respiratory syndrome-related coronavirus infection, but fails to induce protective antibodies and limit eosinophilic infiltration in lungs

Hanako Sekimukai et al. Microbiol Immunol. 2020 Jan.

Abstract

The spike (S) protein of coronavirus, which binds to cellular receptors and mediates membrane fusion for cell entry, is a candidate vaccine target for blocking coronavirus infection. However, some animal studies have suggested that inadequate immunization against severe acute respiratory syndrome coronavirus (SARS-CoV) induces a lung eosinophilic immunopathology upon infection. The present study evaluated two kinds of vaccine adjuvants for use with recombinant S protein: gold nanoparticles (AuNPs), which are expected to function as both an antigen carrier and an adjuvant in immunization; and Toll-like receptor (TLR) agonists, which have previously been shown to be an effective adjuvant in an ultraviolet-inactivated SARS-CoV vaccine. All the mice immunized with more than 0.5 µg S protein without adjuvant escaped from SARS after infection with mouse-adapted SARS-CoV; however, eosinophilic infiltrations were observed in the lungs of almost all the immunized mice. The AuNP-adjuvanted protein induced a strong IgG response but failed to improve vaccine efficacy or to reduce eosinophilic infiltration because of highly allergic inflammatory responses. Whereas similar virus titers were observed in the control animals and the animals immunized with S protein with or without AuNPs, Type 1 interferon and pro-inflammatory responses were moderate in the mice treated with S protein with and without AuNPs. On the other hand, the TLR agonist-adjuvanted vaccine induced highly protective antibodies without eosinophilic infiltrations, as well as Th1/17 cytokine responses. The findings of this study will support the development of vaccines against severe pneumonia-associated coronaviruses.

Keywords: adjuvant; coronavirus; eosinophils; gold nanoparticles; immunopathology; mouse model.


Conflict of interest statement

The authors declare that there are no conflicts of interest.

Figures
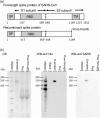
Figure 1
Figure 1
Preparation of recombinant SARS spike protein. (a) Schematic structure of the spike protein and the recombinant protein (Strep‐8xHis‐tagged at the C‐terminus of the ectodomain). (b) Purified recombinant protein. CB, Coomassie blue staining; Flow through, flow through fraction from the column; Pre, culture supernatant; RBD, receptor binding domain; SARS, severe acute respiratory syndrome; S‐protein, purified recombinant protein; SP, signal peptide; TM, transmembrane domain; WB, western blot analysis of the recombinant proteins using anti‐penta‐His and anti‐SARS‐S antibodies
Figure 2
Figure 2
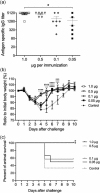
Immunogenicity of the recombinant SARS S protein in mice. Female BALB/c mice were subcutaneously immunized with the purified recombinant S protein at 1.0, 0.5, 0.1, or 0.05 µg/immunization (n = 6–7). After the second immunization, the mice were inoculated with 106 TCID50 of mouse‐adapted SARS‐CoV. (a) Antigen‐specific IgG titer in the sera 2 weeks after the second immunization. The detection limit was 1:10. Each dot shows the data from an individual animal. *P < 0.05. Tukey's multiple comparisons test following by one‐way ANOVA. (b) Body weight changes after SARS‐CoV challenge infection. *P < 0.05; ** P < 0.01; ***P < 0.001; ****P < 0.0001. Comparison of the body weight changes with those of the control group via Tukey's multiple comparisons test following one‐way ANOVA. (c) Survival curves after SARS‐CoV challenge. Comparisons of survival with respect to the control group were performed using the log‐rank test following by Kaplan‐Meier survival analysis. ANOVA, analysis of variance; SARS‐CoV; severe acute respiratory syndrome coronavirus
Figure 3
Figure 3
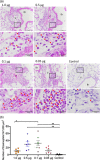
Lung histopathology in recombinant S protein‐immunized mice on day 10 postchallenge. The lung tissue samples are from the same animals used in the experiment shown in Figure 2. (a) Representative histopathological findings of mice with the highest eosinophil infiltration detected by eosinophil staining using the C.E.M. kit. Eosinophil infiltrations occurred around middle size blood vessels in the bronchi area. The arrows indicate eosinophils. Slight inflammatory cell infiltrations with a few mononuclear cells and eosinophils occurred around the blood vessels with edema. Upper panels, low magnification (bars, 100 µm); lower panels, high magnification (bars, 20 µm). (b) Number of eosinophils per lung section (n = 6–7) on day 10 postchallenge. Five 147,000 µm2 regions around the pulmonary bronchiole of each mouse were scored at 600× magnification. Each dot shows the data from an individual animal. The brown‐colored symbols indicate data from moribund animals within 10 dpi. *P < 0.05; **P < 0.01, via Tukey's multiple comparisons test following by one‐way ANOVA for comparisons with the control group. ANOVA, analysis of variance; Br, bronchi; Control, PBS pretreated challenge control on day 4 postinfection; dpi, days postinoculation; V, blood vessel
Figure 4
Figure 4
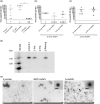
Quantification of the gold nanoparticle‐protein complex (S+AuNPs). (a–c) Virus‐specific IgG titer after the second immunization. A total of 0.5 µg S protein in an AuNP solution containing 0.1 nM particles was diluted and used for immunization (a). A total of 0.5 µg, 0.1 µg, or 0.05 µg S protein with 10 fmol AuNPs was used for immunization (b). A total of 0.1 µg S protein with 2 fmol of 40‐ or 100‐nm AuNPs was used for immunization (c). The dashed line indicates the limit of detection (<10). Each dot shows the data from an individual animal. *P < 0.05. Dunn's multiple comparison test. (d) Western blot analysis of the samples during the preparation of S+AuNPs. S protein, 50 ng of purified S protein; Sup1, supernatant from S+AuNP solution produced via centrifugation at 2000×g for 10 min, that is, free S protein in S+AuNP solution; sup2, wash buffer supernatant from the S+AuNP pellet; Binding S, S protein bound to BSPP‐AuNPs. (e) Transmission electron microscopy images of recombinant proteins (S protein), BSPP‐treated gold nanoparticles (BSPP‐AuNPs), and S protein‐conjugated gold nanoparticles (S+AuNPs) (bars, 200 nm). Particles and free protein are present in the S+AuNPs solution. The arrows indicate S protein‐bound AuNPs. Protein “corona” means layers of bound proteins around AuNPs (inset, bars 20 nm). AuNPs, gold nanoparticles; BSPP, bis(p‐sulfonatophenyl)phenylphosphine dihydrate dipotassium salt
Figure 5
Figure 5
Effects of adjuvants on the outcomes of immunization with recombinant spike protein. Female BALB/c mice were vaccinated with each antigen. Mice immunized with 0.1 µg S protein with or without adjuvant were challenged with 106 TCID50 of mouse‐adapted SARS‐CoV (n = 6–7). (a) Antigen‐specific IgG titer in the sera 2 weeks after the second immunization. The line indicates the limit of detection (<10). Each dot shows the data from an individual animal. **P < 0.01; ***P < 0.001, via Dunn's multiple comparison test. (b) Virus‐specific IgG titer after the second immunization. The dashed line indicates the limit of detection (<10). Each dot shows the data from an individual animal. *P < 0.05; **P < 0.01, via Dunn's multiple comparison test. (c) Serum neutralizing titers after the second immunization. The line indicates the limit of detection (<4). Each dot shows the data from an individual animal. *P < 0.05; **P < 0.01, via Dunn's multiple comparison test. (d) Body weight changes after SARS‐CoV challenge infection. **P < 0.01; ****P < 0.0001. Tukey's multiple comparisons test following one‐way ANOVA were used to compare the results with those of the control group. (e) Survival curves after SARS‐CoV challenge infection. The log‐rank test following Kaplan–Meier survival analysis was used to compare the survival with that of the control group. *P < 0.05; **P < 0.01. ANOVA, analysis of variance; SARS‐CoV, severe acute respiratory syndrome coronavirus
Figure 6
Figure 6
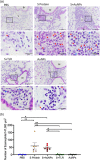
Lung histopathology from S protein‐immunized mice with adjuvant on day 10 postchallenge. The lung tissue samples were from the same animals used in the experiment shown in Figure 5. (a) Representative histopathological findings from the mice with the highest eosinophil infiltration was detected via eosinophil staining using the C.E.M. kit. The red arrows indicate representative eosinophils, and the blue arrows indicate plasma cells. Results of the PBS, or AuNPs pretreated controls on day 4 or 5 postchallenge infection. Upper panels, low magnification (bars, 100 µm); Lower panels, high magnification (bars, 20 µm). (b) Number of eosinophils per lung section (n = 6–7) on day 10 postchallenge. Five 147,000 µm2 regions around the pulmonary bronchiole of each mouse were counted at 600× magnification. Each circle shows the mean value from an individual animal. Brown‐colored symbols indicate data from moribund animals. *P < 0.05; **P < 0.01, via Tukey's multiple comparisons test following one‐way ANOVA comparing the results with those of the control group. ANOVA, analysis of variance; AuNPs, gold nanoparticles; Br, bronchi; PBS, phosphate‐buffered saline; V, blood vessel
Figure 7
Figure 7
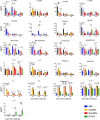
Protection against SARS‐CoV challenge in mice immunized with adjuvanted SARS‐CoV S protein. Samples from the lungs of immunized or non‐immunized mice after SARS‐CoV inoculation (n = 3–5). Virus titers (a) and mRNA expression levels of Type 1 IFN in lungs 1, 3, and 5 days postchallenge (b). The assays were performed using unicate samples per animal. Each circle shows the data from an individual animal. *P < 0.05; **P < 0.01; ***P < 0.001; ****P < 0.0001, via Tukey's multiple comparisons test following two‐way ANOVA to compare the results with those of the control group. ANOVA, analysis of variance; IFN, interferon; mRNA, messenger RNA; SARS‐CoV, severe acute respiratory syndrome coronavirus
Figure 8
Figure 8
Immune responses in the lungs of mice immunized with adjuvant after SARS‐CoV challenge. Cytokine and chemokine levels in the lungs of immunized or non‐immunized animals 1, 3, and 5 days after infection with SARS‐CoV (n = 3–5). The lung homogenates were from the same animals used in the experiment shown in Figure 7, and the assays were performed using unicate samples per animal. Each circle shows the data from an individual animal. *P < 0.05; **P < 0.01; ***P < 0.001; ****p < .0001, via Tukey's multiple comparisons test following two‐way ANOVA to compare the results with those of the control group. ANOVA, analysis of variance; SARS‐CoV, severe acute respiratory syndrome coronavirus

Similar articles

Cited by

References

    1. Droste C, Gunther S, Preiser W, et al. Identification of a novel coronavirus in patients with severe acute respiratory syndrome. N Engl J Med. 2003;348:1967‐76. - PubMed
    1. Guan Y, Peiris JS, Zheng B, et al. Molecular epidemiology of the novel coronavirus that causes severe acute respiratory syndrome. Lancet. 2004;363:99‐104. - PMC - PubMed
    1. Ksiazek TG, Erdman D, Goldsmith CS, et al. A novel coronavirus associated with severe acute respiratory syndrome. N Engl J Med. 2003;348:1953‐66. - PubMed
    1. Lee N, Hui D, Wu A, et al. A major outbreak of severe acute respiratory syndrome in Hong Kong. N Engl J Med. 2003;348:1986‐94. - PubMed
    1. Peiris JS, Lai ST, Poon LL, et al. Coronavirus as a possible cause of severe acute respiratory syndrome. Lancet. 2003;361:1319‐25. - PMC - PubMed

MeSH terms