. 2019 Nov 1;75(Pt 11):947-958.
doi: 10.1107/S2059798319011379. Epub 2019 Oct 31.

Visualization of protein crystals by high-energy phase-contrast X-ray imaging

Affiliations

Visualization of protein crystals by high-energy phase-contrast X-ray imaging

Maxim Polikarpov et al. Acta Crystallogr D Struct Biol. .

Abstract

For the extraction of the best possible X-ray diffraction data from macromolecular crystals, accurate positioning of the crystals with respect to the X-ray beam is crucial. In addition, information about the shape and internal defects of crystals allows the optimization of data-collection strategies. Here, it is demonstrated that the X-ray beam available on the macromolecular crystallography beamline P14 at the high-brilliance synchrotron-radiation source PETRA III at DESY, Hamburg, Germany can be used for high-energy phase-contrast microtomography of protein crystals mounted in an optically opaque lipidic cubic phase matrix. Three-dimensional tomograms have been obtained at X-ray doses that are substantially smaller and on time scales that are substantially shorter than those used for diffraction-scanning approaches that display protein crystals at micrometre resolution. Adding a compound refractive lens as an objective to the imaging setup, two-dimensional imaging at sub-micrometre resolution has been achieved. All experiments were performed on a standard macromolecular crystallography beamline and are compatible with standard diffraction data-collection workflows and apparatus. Phase-contrast X-ray imaging of macromolecular crystals could find wide application at existing and upcoming low-emittance synchrotron-radiation sources.

Keywords: X-ray refractive lenses; X-ray tomography; lipidic cubic phase; phase-contrast X-ray imaging.


Figures

Figure 1
Figure 1
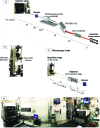
Beamline P14 at EMBL Hamburg. (a) The first optical element, a transfocator, is positioned 40 m from the source point. The double-crystal monochromator is located at a distance of 45 m from the source. The X-ray beam can be additionally focused at the sample position (61 m from the source) using bimorph X-ray mirrors in KB configuration located 60 m from the source. The detector stage carries detectors for crystallography and X-ray imaging, whereby the available motorized degrees of freedom can be used to choose between the two detector systems. (b) As a third positional option, refractive X-ray lenses are also mounted on the detector stage which can be used to support magnified X-ray imaging. (c) For magnified X-ray imaging, the detector can be mounted on the downstream hutch wall while refractive X-ray lenses are positioned inline. (d) Overview of the experimental hutch.
Figure 2
Figure 2
X-ray interference pattern from a boron fiber. (a) Intensity distribution acquired with the X-ray camera placed at a distance of 5 m from the point of intersection between the boron fiber and the 12.7 keV X-ray beam. (b) The cross-section of (a) (red) and the predicted intensity distribution for an effective source size of 35 µm (black). X-ray intensity (in arbitrary units) is measured as a function of distance from the core of the fiber. The experimental profile was obtained by averaging over ten pixel columns [red line in (a)]. (c) shows a magnification of the rectangular inset in (b).
Figure 3
Figure 3
Visualization of crystals embedded in an LCP matrix. (a) Image taken with the on-axis microscope of the MD3 diffractometer. (b) Heat plot of the number of diffraction spots found by Dozor as a function of xy positions tested with a microfocus beam. Pseudo-colors represent the number of diffraction spots per image on a linear scale using the ‘autumn’ colormap (https://matplotlib.org). The highest number of 1300 spots (indicated by a white coloring for the corresponding xy position) was found for a crystal diffracting to a resolution of 2.0 Å. (c) A flat-field-corrected projection recorded by X-ray imaging. (d) Enlargement of the region marked in (a)–(c). (e) Ortho-slice through the 3D tomogram derived from 180 X-ray projection images taken at the y coordinate indicated by the dashed red line in (c). The grayscaling is proportional to the attenuation coefficient. (f) 3D image after identification of regions representing crystals or the mesh mount using iterative segmentation as implemented in the carving workflow of Ilastik. The figure was produced using GLC_Player (http://www.glc-player.net/).
Figure 4
Figure 4
Scanning electron (a) and X-ray micrographs (b, c) of the Siemens star (Ta on SiN; XRESO-50HC, NTT-AT, Japan). Numbers along the upper right diagonal indicate feature sizes in µm. (c) Enlargement of the central part of (b) revealing the smallest distinguishable bars of sizes 0.1–0.2 µm.
Figure 5
Figure 5
Flat-field-corrected X-ray micrograph of a protein crystal embedded in LCP magnified by a factor of 11.4 by an objective CRL placed between the sample and the X-ray camera.

References

    1. Aherne, M., Lyons, J. A. & Caffrey, M. (2012). J. Appl. Cryst. 45, 1330–1333. - PMC - PubMed
    1. Aishima, J., Owen, R. L., Axford, D., Shepherd, E., Winter, G., Levik, K., Gibbons, P., Ashton, A. & Evans, G. (2010). Acta Cryst. D66, 1032–1035. - PMC - PubMed
    1. Als-Nielsen, J. & McMorrow, D. (2011). Elements of Modern X-ray Physics, 2nd ed. Chichester: John Wiley & Sons.
    1. Arhatari, B. D., Peele, A. G., Hannah, K., Kappen, P., Nugent, K. A., Williams, G. J., Yin, G. C., Chen, Y. M., Chen, J. H. & Song, Y. F. (2009). Ultramicroscopy, 109, 280–286. - PubMed
    1. Axford, D., Owen, R. L., Aishima, J., Foadi, J., Morgan, A. W., Robinson, J. I., Nettleship, J. E., Owens, R. J., Moraes, I., Fry, E. E., Grimes, J. M., Harlos, K., Kotecha, A., Ren, J., Sutton, G., Walter, T. S., Stuart, D. I. & Evans, G. (2012). Acta Cryst. D68, 592–600. - PMC - PubMed

MeSH terms