

SAD phasing of XFEL data depends critically on the error model
- PMID: 31692470
- PMCID: PMC6834081
- DOI: 10.1107/S2059798319012877
SAD phasing of XFEL data depends critically on the error model
Abstract
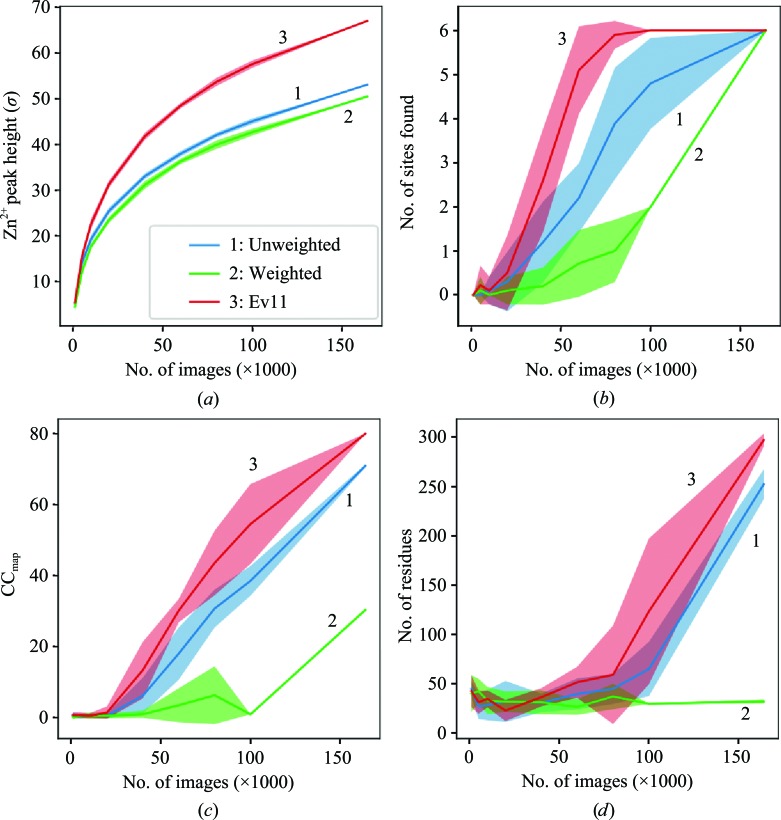
A nonlinear least-squares method for refining a parametric expression describing the estimated errors of reflection intensities in serial crystallographic (SX) data is presented. This approach, which is similar to that used in the rotation method of crystallographic data collection at synchrotrons, propagates error estimates from photon-counting statistics to the merged data. Here, it is demonstrated that the application of this approach to SX data provides better SAD phasing ability, enabling the autobuilding of a protein structure that had previously failed to be built. Estimating the error in the merged reflection intensities requires the understanding and propagation of all of the sources of error arising from the measurements. One type of error, which is well understood, is the counting error introduced when the detector counts X-ray photons. Thus, if other types of random errors (such as readout noise) as well as uncertainties in systematic corrections (such as from X-ray attenuation) are completely understood, they can be propagated along with the counting error, as appropriate. In practice, most software packages propagate as much error as they know how to model and then include error-adjustment terms that scale the error estimates until they explain the variance among the measurements. If this is performed carefully, then during SAD phasing likelihood-based approaches can make optimal use of these error estimates, increasing the chance of a successful structure solution. In serial crystallography, SAD phasing has remained challenging, with the few examples of de novo protein structure solution each requiring many thousands of diffraction patterns. Here, the effects of different methods of treating the error estimates are estimated and it is shown that using a parametric approach that includes terms proportional to the known experimental uncertainty, the reflection intensity and the squared reflection intensity to improve the error estimates can allow SAD phasing even from weak zinc anomalous signal.
Keywords: SAD phasing; XFELs; cctbx.xfel; error modeling; serial crystallography.
open access.
Figures
References
-
- Adams, P. D., Afonine, P. V., Bunkóczi, G., Chen, V. B., Davis, I. W., Echols, N., Headd, J. J., Hung, L.-W., Kapral, G. J., Grosse-Kunstleve, R. W., McCoy, A. J., Moriarty, N. W., Oeffner, R., Read, R. J., Richardson, D. C., Richardson, J. S., Terwilliger, T. C. & Zwart, P. H. (2010). Acta Cryst. D66, 213–221. - PMC - PubMed
-
- Barends, T. R. M., Foucar, L., Botha, S., Doak, R. B., Shoeman, R. L., Nass, K., Koglin, J. E., Williams, G. J., Boutet, S., Messerschmidt, M. & Schlichting, I. (2014). Nature (London), 505, 244–247. - PubMed
-
- Bergmann, U., Yachandra, V. & Yano, J. (2017). X-ray Free Electron Lasers. Cambridge: The Royal Society of Chemistry.
-
- Brewster, A. S., Young, I. D., Lyubimov, A., Bhowmick, A. & Sauter, N. K. (2019). Comput. Crystallogr. Newslett. 10, 22–39.
MeSH terms
Substances
Grants and funding
- DE-AC02-05CH11231/U.S. Department of Energy, Office of Science
- 17-SC-20-SC/U.S. Department of Energy, Office of Science
- GM117126/Foundation for the National Institutes of Health
- R01GM109019/Foundation for the National Institutes of Health
- DE-AC02-76SF00515/U.S. Department of Energy, Office of Science
