. 2019 Oct 30;5(10):eaax9183.
doi: 10.1126/sciadv.aax9183. eCollection 2019 Oct.

Myeloid Tribbles 1 induces early atherosclerosis via enhanced foam cell expansion

Affiliations

Myeloid Tribbles 1 induces early atherosclerosis via enhanced foam cell expansion

Jessica M Johnston et al. Sci Adv. .

Abstract

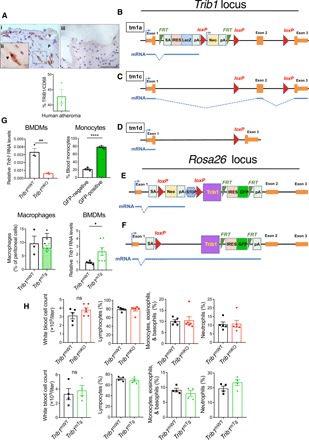
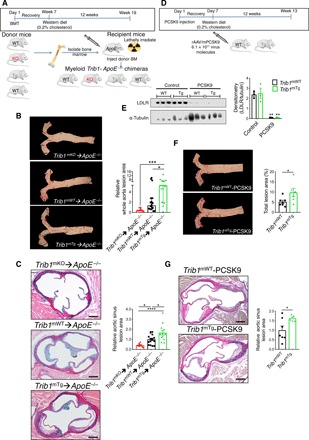
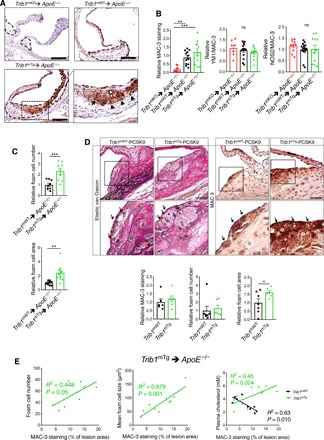
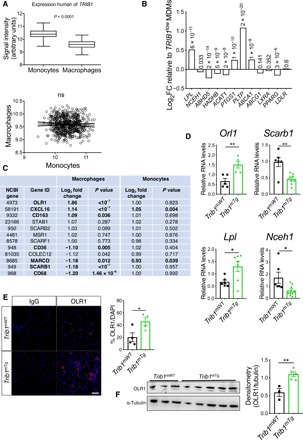
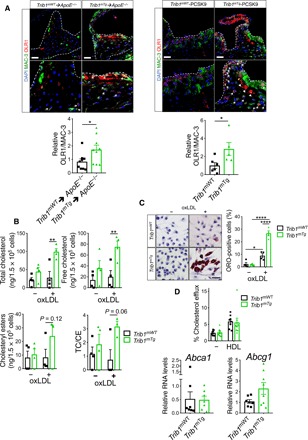
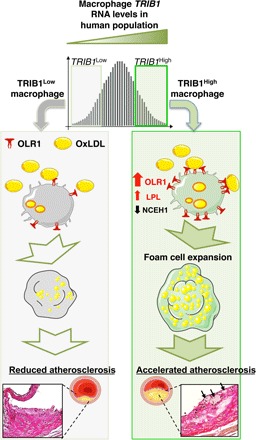
Macrophages drive atherosclerotic plaque progression and rupture; hence, attenuating their atherosclerosis-inducing properties holds promise for reducing coronary heart disease (CHD). Recent studies in mouse models have demonstrated that Tribbles 1 (Trib1) regulates macrophage phenotype and shows that Trib1 deficiency increases plasma cholesterol and triglyceride levels, suggesting that reduced TRIB1 expression mediates the strong genetic association between the TRIB1 locus and increased CHD risk in man. However, we report here that myeloid-specific Trib1 (mTrib1) deficiency reduces early atheroma formation and that mTrib1 transgene expression increases atherogenesis. Mechanistically, mTrib1 increased macrophage lipid accumulation and the expression of a critical receptor (OLR1), promoting oxidized low-density lipoprotein uptake and the formation of lipid-laden foam cells. As TRIB1 and OLR1 RNA levels were also strongly correlated in human macrophages, we suggest that a conserved, TRIB1-mediated mechanism drives foam cell formation in atherosclerotic plaque and that inhibiting mTRIB1 could be used therapeutically to reduce CHD.


Figures

Fig. 1
Fig. 1. Generation and characterization of myeloid-specific Trib1 mouse strains.
(A) Representative immunohistochemistry image of human atherosclerotic plaque (P). Red, TRIB1; brown, CD68+. (ii) Magnification (×40) of boxed area. Arrowhead highlights a double-positive cell. Quantification (mean ± SD) of three patient samples. (iii) Isotype control (scale bar, 50 μm). (B) Targeting construct used to produce the null, conditional-ready/floxed (tm1c) and conditional-null (tm1d) Trib1 alleles. Predicted transcripts below. FRT, flippase recognition target; SA, splice acceptor; pA, polyadenylation motif; IRES, internal ribosome entry site; LacZ, β-galactosidase; Neo, neomycin resistance gene. (C) Trib1mWT allele following removal of the “gene-trap” cassette. (D) Conditional-null Trib1 allele was produced by crossing tm1c and Cre-expressing mice. (E) Construct used to produce Trib1mWT and Trib1mTransgenic (Tg) mice. (F) Cre-mediated excision of the STOP cassette produces a bicistronic Trib1-eGFP transcript. Bent arrow, indicates transcription from endogenous Rosa26 promoter. (G) Trib1 RNA (relative to Actb) in BMDMs from homozygous tm1c (i.e., Trib1mWT) and Trib1mKO mice (n = 3 per group). eGFP expression in monocytes of three Trib1mTg mice and peritoneal macrophages from specified mice (n = 3 per group). Trib1 RNA levels (relative to Trib1mWT) in BMDMs of Trib1mTg (n = 5 to 7 per group). (H) Blood cell counts of mixed-gender Trib1mKO (top) and Trib1mTg (bottom) and their respective WT littermates (n = 5 to 6 per group). Data are means ± SEM. Significances were determined by Student’s t test, *P < 0.05, **P < 0.01, and ****P < 0.0001. ns, non-significant.
Fig. 2
Fig. 2. Myeloid-specific Trib1 expression increases atherosclerosis burden in two murine models of human atherosclerosis.
(A) Schematic of the bone marrow transplant experiment. Bone marrow cells from myeloid-specific Trib1 KO and transgenic (Tg) mice and their respective WT controls were transplanted into ApoE−/− recipients. (B) Representative en face Oil Red O staining of thoracic aortas (week 19) from specified chimeras. Lesion areas were calculated as percentages of the total surface area of the whole aorta and normalized (median, ±95% confidence interval) to Trib1mWT; n = 10 to 18 per group. (C) Representative images of Elastic van Gieson–stained aortic sinus lesions. Quantification relative to WT (n = 10 to 16 mice per group). (D) Second model of human atherosclerosis. rAAV/mPCSK9, recombinant adenovirus–produced murine proprotein convertase subtilisin/kexin 9. (E) LDLR protein in liver samples from specified mice was quantified by Western blotting (n = 3 per group). (F) Representative en face Oil Red O staining of thoracic aortas from specified mice. Lesion areas were calculated as percentages of the total surface areas of the whole aorta (n = 6 to 7 per group). (G) Representative images of Elastic van Gieson–stained aortic sinus lesions of specified mice and quantification, relative to WT (n = 5 to 7 per group). Scale bars, 200 μm (C and G). Data are means ± SEM. Significance was determined by one-way (B and C) or two-way analysis of variance (ANOVA) (E) or Student’s t test (F and G). *P < 0.05, **P < 0.01, ***P < 0.001, and ****P < 0.0001.
Fig. 3
Fig. 3. Myeloid-Trib1 induces foam cell expansion.
(A) MAC-3 staining (brown) of representative cross sections of the aortic sinus from specified mice (scale bars, 100 μm). Dashed lines indicate lesion boundaries. Arrows highlight foam cells in the boxed region (40-fold magnification). (B) Staining of aortic sinus lesions from specified chimeric mice with specified antibodies: MAC-3 (n = 9 to 12 per group) and double-positive YM1/MAC-3 (n = 7 to 14 per group) and NOS2/MAC-3 (n = 10 to 16 per group) cells. (C) Quantification of relative foam cell numbers (top) and size (bottom) in aortic sinus lesions of specified chimeras. n = 10 to 16 per group. (D) Representative images (scale bars, 30 μm) of Elastic van Gieson– and MAC-3–stained aortic sinus lesions from specified mice injected with rAAV/mPCSK9 (n = 9 to 11 per group). Arrows in magnified (×40) images of boxed area highlight foam cells. Quantification of MAC-3 staining and foam cell numbers and sizes (n = 6 to 7 per group). (E) Correlation between MAC-3 staining (x axis) in aortic sinus lesions of specified chimeric mice and foam cell numbers (left), foam cell size (middle), and plasma cholesterol levels (right). MAC-3 staining expressed as percentage (%) of total aortic sinus lesion area. R2, Pearson correlation coefficient. In (B) to (D), data (means ± SEM) are expressed relative to WT. Statistical differences were determined by one-way ANOVA (B) or Student’s t test (C and D). *P < 0.05, **P < 0.01, and ***P < 0.001.
Fig. 4
Fig. 4. Myeloid TRIB1 induces reciprocal changes in oxLDL and HDL receptor expression in human and mouse macrophages.
(A) TRIB1 RNA levels in monocytes and MDMs of CTS participants (24). Correlation (R2 < 0.001, P = 0.47) was performed on 596 paired monocyte and MDM samples. (B) MDM (n = 596) and monocytes (n = 758) were ranked according to TRIB1 RNA contents and gene expression values in the top and bottom quartiles compared. Log2 fold changes (FC) of specified RNAs in TRIB1High (n = 149) versus TRIB1Low (n = 149) MDM, with associated P values. (C) FC and P values for differential expression of RNAs encoding representative scavenger receptors, including CD36, which mediates (ox)-phospholipid and long-chain fatty acid uptake (39), the acetylated-LDL scavenging receptor (40), and macrophage scavenger receptor (40). Comparisons are between TRIB1High versus TRIB1Low MDMs and between TRIB1High (n = 191) versus TRIB1Low (n = 191) monocytes. (D) RT-qPCR quantification of RNA (mean ± SEM) in BMDM prepared from specified mice (n = 5 to 9 per group). (E) Immunocytochemistry of nonpolarized Trib1mWT and Trib1mTg BMDMs. OLR1 (red), nuclei counterstained with 4′,6-diamidino-2-phenylindole (DAPI) (blue). Scale bar, 50 μm. Quantifications performed on BMDMs prepared from four to five mice per group. (F) Western blot analysis of OLR1 in Trib1mWT and Trib1mTg BMDMs (n = 3 to 5 per group). In (D) to (F), significance was determined by Student’s t test; *P < 0.05, and **P < 0.01.
Fig. 5
Fig. 5. Myeloid-Trib1 increases ORL1 expression, cholesterol uptake, and neutral lipid accumulation.
(A) Representative images (scale bars, 25 μm) of aortic sinus lesions from specified mice and enlarged images. Dashed lines indicate boundaries of lesions. MAC-3 (green), OLR1 (red), and nuclei counterstained with DAPI (blue). Arrows indicate OLR1-positive macrophages. Arrowheads indicate assumed acellular OLR1. Quantification: Trib1mWTApoE−/− and Trib1mTgApoE−/− chimeras, nine per group; mTrib1-PCSK9, five to six per group (mean ± SEM). (B) Intracellular total cholesterol, unesterified cholesterol, and cholesteryl ester contents of Trib1mTg and Trib1mWT bone marrow cells differentiated into macrophages and incubated with oxLDL (25 μg/ml) for 24 hours (n = 4 per group). (C) Representative images of BMDMs stained with Oil Red O (scale bar, 50 μm). Quantification was performed on three fields of view per sample. (D) Quantification of cholesterol efflux from cholesterol-loaded BMDMs to human HDL (n = 8 to 9 per group). RT-qPCR quantification of Abca1 and Abcg1 RNA in nonpolarized BMDMs prepared from specified mice (n = 7 to 8 per group). Data are means ± SEM. Significance determined by Student’s t test (A and D, bottom panels) or two-way ANOVA with Sidak’s multiple comparisons posttest (B to D) *P < 0.05, **P < 0.01, and ****P < 0.001.
Fig. 6
Fig. 6. Model summarizing the proposed effects of differences in mTRIB1 expression on foam cell expansion in early-stage atherosclerosis.
Factors up-regulating mTRIB1 expression in human MDMs and plaque macrophages simultaneously increase cholesterol and neutral lipid uptake, with no compensatory rise in cholesterol efflux. Schematic recognizes that increased OLR1 expression increases the probability of this scavenger receptor assembling as a hexamer made up of three homodimers on the macrophage cell surface and that this configuration leads to a marked increase in its affinity for oxLDL (9) and hence OLR1-mediated uptake of oxLDL lipids. In the setting of no compensatory rise in HDL-mediated cholesterol efflux, accelerated foam cell expansion and increased atheroma burden ensue, highlighting the therapeutic potential of inhibiting macrophage Trib1 expression to block the gene expression changes that both promote macrophage cholesterol uptake and cholesteryl ester formation accumulation and prevent the increased hydrolysis of the accumulated cholesteryl ester and thus the up-regulation of the reverse cholesterol transport pathway to mediate the removal of cholesterol from the arterial wall.

References

    1. Rocha V. Z., Libby P., Obesity, inflammation, and atherosclerosis. Nat. Rev. Cardiol. 6, 399–409 (2009). - PubMed
    1. Uchida Y., Recent advances in fluorescent angioscopy for molecular imaging of human atherosclerotic coronary plaque. J. Atheroscler. Thromb. 24, 539–551 (2017). - PMC - PubMed
    1. Moore K. J., Sheedy F. J., Fisher E. A., Macrophages in atherosclerosis: A dynamic balance. Nat. Rev. Immunol. 13, 709–721 (2013). - PMC - PubMed
    1. Skålén K., Gustafsson M., Rydberg E. K., Hultén L. M., Wiklund O., Innerarity T. L., Borén J., Subendothelial retention of atherogenic lipoproteins in early atherosclerosis. Nature 417, 750–754 (2002). - PubMed
    1. Schrijvers D. M., De Meyer G. R., Kockx M. M., Herman A. G., Martinet W., Phagocytosis of apoptotic cells by macrophages is impaired in atherosclerosis. Arterioscler. Thromb. Vasc. Biol. 25, 1256–1261 (2005). - PubMed

Publication types

MeSH terms