. 2019 Oct 30;5(10):eaax4761.
doi: 10.1126/sciadv.aax4761. eCollection 2019 Oct.

More than efficacy revealed by single-cell analysis of antiviral therapeutics

Affiliations

More than efficacy revealed by single-cell analysis of antiviral therapeutics

Wu Liu et al. Sci Adv. .

Abstract

Because many aspects of viral infection dynamics and inhibition are governed by stochastic processes, single-cell analysis should provide more information than approaches using population averaging. We have developed a microfluidic device composed of ~6000 wells, with each well containing a microstructure to capture single, infected cells replicating an enterovirus expressing a fluorescent reporter protein. We have used this system to characterize enterovirus inhibitors with distinct mechanisms of action. Single-cell analysis reveals that each class of inhibitor interferes with the viral infection cycle in a manner that can be distinguished by principal component analysis. Single-cell analysis of antiviral candidates not only reveals efficacy but also facilitates clustering of drugs with the same mechanism of action and provides some indication of the ease with which resistance will develop.


Figures

Fig. 1
Fig. 1. Addition of cell-trapping microstructures to wells of a microfluidic device enhances single-cell occupancy.
(A) Schematic of the device. The following layers exist: microwell (not shown explicitly), channel (green), and valve (cyan). The device is divided into five sections of 1140 microwells (different shades of green for the channel layer) for a total of 5700 microwells. (B) Schematic of two wells of the device with all relevant dimensions indicated. The microwell layer creates a physical barrier between adjacent wells. The barrier between adjacent wells is sealed with water emanating from the valve layer. Water in the valve layer is sealed by application of air under pressure (20 to 30 psi). (C) Simulation of the flow velocity field in a microwell indicated that the outlet would maximize cell trapping by the microstructure. (D) Image showing cells captured by the microstructures in the microwells. The device was infused with cells (5 × 10⁵ cells/ml) at a rate of 0.5 μl/min. Under optimal conditions, 86.1% (4908) microwells of the device contained single cells.
Fig. 2
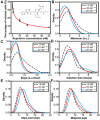
Fig. 2. Evaluation of rupintrivir, a PV 3C protease inhibitor.
(A) Dose-response analysis. Percentage of single, infected (green, GFP-positive ) cells was determined as a function of rupintrivir concentration. (B to F) Distributions for each parameter in the presence of 10 or 20 nM rupintrivir were compared with that in the absence of drug using a t test. A *P < 0.05 and **P < 0.005. Numerical values for experimental parameters and statistical analysis are provided in table S2. The parameters presented in the panels are as follows: (B) maximum, (C) slope, (D) infection time, (E) start point, and (F) midpoint. hpi, hours postinfection; a.u., arbitrary units.
Fig. 3
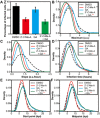
Fig. 3. Evaluation of GA, an HSP90 inhibitor.
(A) Dose-response analysis. Percentage of single, infected (green, GFP-positive ) cells was determined as a function of GA concentration. (B to F) Distributions for each parameter in the presence of 25 or 100 nM GA were compared with that in the absence of drug using a t test. **P < 0.005. Numerical values for experimental parameters and statistical analysis are provided in table S3. The parameters presented in the panels are as follows: (B) maximum, (C) slope, (D) infection time, (E) start point, and (F) midpoint.
Fig. 4
Fig. 4. Evaluation of an antiviral drug combination: 2′-C-Me-A and GA.
(A) Combination of 2′-C-Me-A and GA is not synergistic based on the fraction of established infections. Percentage of single, infected (green, GFP-positive) cells was determined in the presence of 50 μM 2′-C-Me-A, 25 nM GA, or the combination of the two drugs. (B to F) Distributions for each parameter in the presence of the combination were compared with that in the presence of GA alone using a t test. Numerical values for experimental parameters and statistical analysis are provided in table S4. The parameters presented in the panels are as follows: (B) maximum, (C) slope, (D) infection time, (E) start point, and (F) midpoint. *P < 0.05; **P < 0.005.
Fig. 5
Fig. 5. Mechanistic classes of antiviral agents distinguished by PCA of single-cell data.
(A) Points representing groups of single cells are colored according to compound identities with each point representing a different drug treatment concentration. PCA was performed using the mean values of the maximum, slope, infection time, start point, and midpoint from the various drug treatment concentrations and control groups. The top two principal components accounted for 94% of the total variance. The light blue lines indicate the relationship between variables in the space of the first two components. (B) The pair of scores for principle components 1 and 2 for the drug combination experiment shown in Fig. 4 was plotted in the PCA space from (A). The expected vector for additive behavior of the combination is indicated. This analysis reveals the synergistic behavior of the combination of 2′-C-Me-A and GA.

References

    1. Campbell G. L., Marfin A. A., Lanciotti R. S., Gubler D. J., West Nile virus. Lancet Infect. Dis. 2, 519–529 (2002). - PubMed
    1. Peiris J. S., Lai S. T., Poon L. L., Guan Y., Yam L. Y., Lim W., Nicholls J., Yee W. K., Yan W. W., Cheung M. T., Cheng V. C., Chan K. H., Tsang D. N., Yung R. W., Ng T. K., Yuen K. Y.; SARS study group , Coronavirus as a possible cause of severe acute respiratory syndrome. Lancet 361, 1319–1325 (2003). - PMC - PubMed
    1. Burt F. J., Rolph M. S., Rulli N. E., Mahalingam S., Heise M. T., Chikungunya: A re-emerging virus. Lancet 379, 662–671 (2012). - PubMed
    1. Baize S., Pannetier D., Oestereich L., Rieger T., Koivogui L., Magassouba N., Soropogui B., Sow M. S., Keïta S., De Clerck H., Tiffany A., Dominguez G., Loua M., Traoré A., Kolié M., Malano E. R., Heleze E., Bocquin A., Mély S., Raoul H., Caro V., Cadar D., Gabriel M., Pahlmann M., Tappe D., Schmidt-Chanasit J., Impouma B., Diallo A. K., Formenty P., Van Herp M., Günther S., Emergence of Zaire Ebola virus disease in Guinea. N. Engl. J. Med. 371, 1418–1425 (2014). - PubMed
    1. Campos G. S., Bandeira A. C., Sardi S. I., Zika virus outbreak, Bahia, Brazil. Emerg. Infect. Dis. 21, 1885–1886 (2015). - PMC - PubMed

Publication types

MeSH terms

LinkOut - more resources