. 2020 Jan;29(1):223-236.
doi: 10.1002/pro.3772. Epub 2019 Nov 20.

Hybrid Electron Microscopy Normal Mode Analysis with Scipion

Affiliations

Hybrid Electron Microscopy Normal Mode Analysis with Scipion

Mohamad Harastani et al. Protein Sci. 2020 Jan.

Abstract

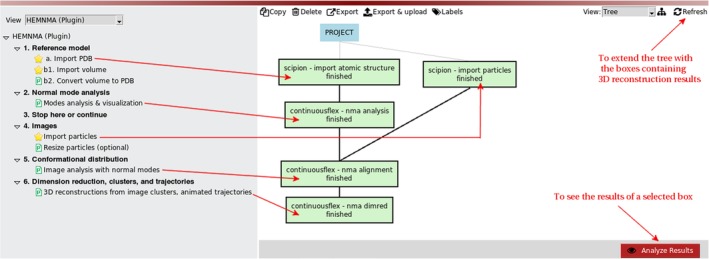
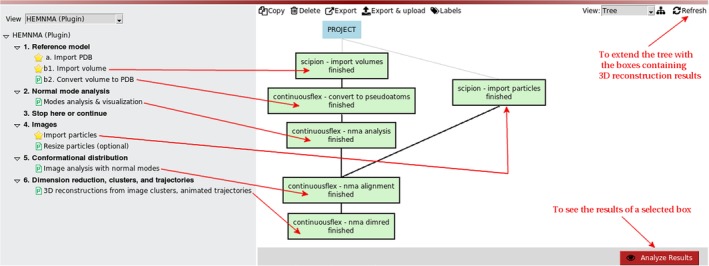
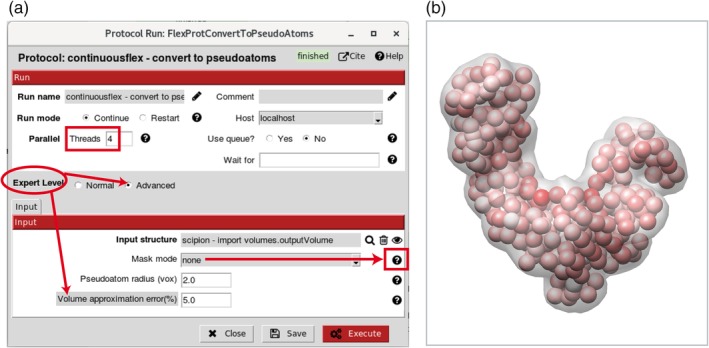
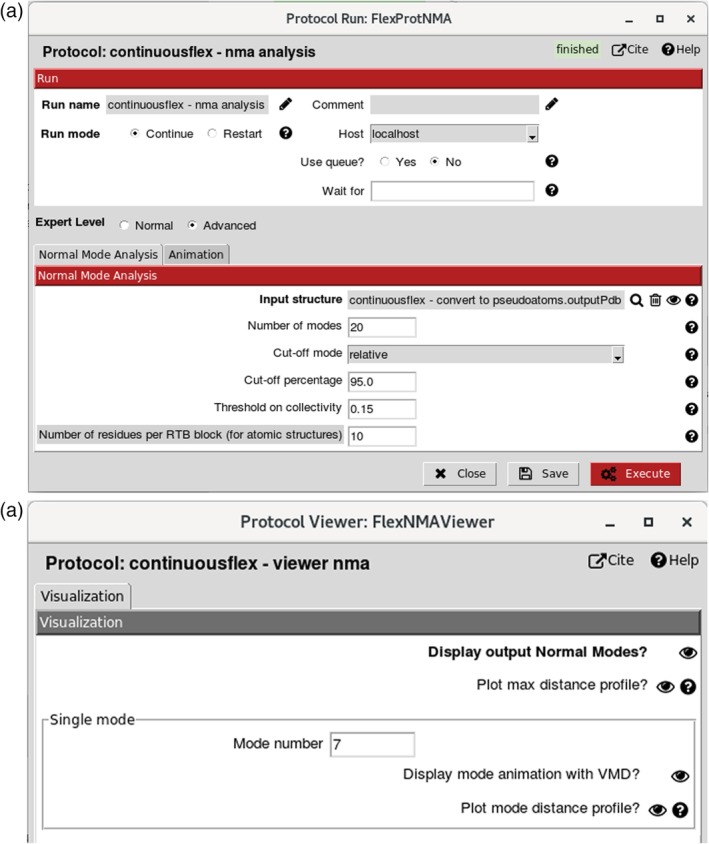
Hybrid Electron Microscopy Normal Mode Analysis (HEMNMA) method was introduced in 2014. HEMNMA computes normal modes of a reference model (an atomic structure or an electron microscopy map) of a molecular complex and uses this model and its normal modes to analyze single-particle images of the complex to obtain information on its continuous conformational changes, by determining the full distribution of conformational variability from the images. An advantage of HEMNMA is a simultaneous determination of all parameters of each image (particle conformation, orientation, and shift) through their iterative optimization, which allows applications of HEMNMA even when the effects of conformational changes dominate those of orientational changes. HEMNMA was first implemented in Xmipp and was using MATLAB for statistical analysis of obtained conformational distributions and for fitting of underlying trajectories of conformational changes. A HEMNMA implementation independent of MATLAB is now available as part of a plugin of Scipion V2.0 (http://scipion.i2pc.es). This plugin, named ContinuousFlex, can be installed by following the instructions at https://pypi.org/project/scipion-em-continuousflex. In this article, we present this new HEMNMA software, which is user-friendly, totally free, and open-source. STATEMENT FOR A BROADER AUDIENCE: This article presents Hybrid Electron Microscopy Normal Mode Analysis (HEMNMA) software that allows analyzing single-particle images of a complex to obtain information on continuous conformational changes of the complex, by determining the full distribution of conformational variability from the images. The HEMNMA software is user-friendly, totally free, open-source, and available as part of ContinuousFlex plugin (https://pypi.org/project/scipion-em-continuousflex) of Scipion V2.0 (http://scipion.i2pc.es).

Keywords: continuous conformational changes; cryo-electron microscopy; dynamics; normal mode analysis; single-particle analysis; software; structure.


Figures

Figure 1
Figure 1
HEMNMA project tree for the case of analyzing images using an atomic structure as the reference model
Figure 2
Figure 2
HEMNMA project tree for the case of analyzing images using a density volume as the reference model. The volume is converted into 3D Gaussian functions (the so‐called pseudoatoms)
Figure 3
Figure 3
Volume‐to‐pseudoatoms conversion. (a) Dialog box. (b) Superposition of an input density volume (transparent grey) and its pseudoatomic representation [spheres where the amplitudes of Gaussian functions are color‐coded from white (smallest) to red (largest)]. In this example, the Gaussian‐function standard deviation (pseudoatom radius) and the desired volume approximation error are 2 voxels and 5%, respectively. The desired volume approximation error parameter is hidden by default (“Expert Level” is set to “Normal”) and can be visualized by setting “Expert Level” to “Advanced” (panel a). The volume‐to‐pseudoatoms conversion is parallelized using threads (parallel processes sharing the same memory) and the number of threads to use can be specified in the “Threads” field (panel a). The masking options to remove background noise from the input volume are explained in the help message under the corresponding question mark (panel a)
Figure 4
Figure 4
Normal mode analysis and visualization. (a) Dialog box (note that “Cut‐off mode” selected here is “relative” and that the interface allows selecting the cut‐off mode “absolute” as well). (b) Normal modes viewer allowing visualizing animations of normal modes (using “Display mode animation with VMD?” for the mode specified in “Mode number”) and checking their collectivities and scores (using “Display output Normal Modes?”)
Figure 5
Figure 5
Image analysis with normal modes. (a) and (b) Two sections of the dialog box, regarding input (panel a) and alignment (panel b). (c) An example of visualization of image analysis results in three dimensions (amplitudes along three normal modes). The image analysis task is parallelized using MPI protocol and the number of MPI cores (parallel processes that do not necessarily share the same memory) can be specified in the MPI field (panel a). In panel b, the default choice for the “Rigid‐body alignment method” is “wavelets & splines” (the alternative method is “projection matching”) and the elastic alignment is performed by Powell's trust region method. In panel c, each point corresponds to a particle image with assigned orientations, translations, and normal‐mode displacement amplitudes with respect to the reference model (close points correspond to similar conformations and vice versa)
Figure 6
Figure 6
Dimension reduction. (a) Dialog box for projecting normal‐mode amplitudes computed by image analysis onto a space of lower dimension using PCA (here, 2 in “Reduced dimension” means projecting onto a 2D space) or one of several other dimension reduction methods selected via “Dimensionality reduction method” (the default values of parameters of these methods are provided in the help message displayable by clicking on the corresponding question mark). (b) Dimension reduction viewer allowing visualizing normal‐mode amplitudes in the low‐dimensional space (here, a 2D space specified by axes 1 and 2) as well as opening the clustering (grouping) and trajectories tools. (c) Example of projecting normal‐mode amplitudes onto a low‐dimensional space (here, 2D space specified in panel b). In panel a, the methods available for the dimension reduction are PCA, Kernel PCA, Probabilistic PCA, Local Tangent Space Alignment (LTSA), Linear LTSA, Diffusion Map, Linearity Preserving Projection, Laplacian Eigenmap, Hessian Locally Linear Embedding, Stochastic Proximity Embedding, and Neighborhood Preserving Embedding
Figure 7
Figure 7
Animations after image analysis. (a) Trajectories Tool. (b) Example of trajectory (10 red points, see the text for more details). (c) Trajectory animation using VMD
Figure 8
Figure 8
3D reconstructions after image analysis. (a) Clustering Tool for grouping close points (images with similar conformations). (b) Example of selecting a group of points (circled in yellow) for 3D reconstruction. (c) Chimera superposition of three 3D reconstructions (yellow, cyan, and gray isosurfaces) from the corresponding groups of images denoted in panel b (points surrounded by yellow, cyan, and gray ellipses, panel b), with the most dominant motion shown by red arrows. The group of points saved using the “Create Cluster” button (panel a) appears as a new box in the project tree (panel c), possibly after using the “Refresh” button from the project window. The saved group of points can be inspected using the “Analyze Results” button from the project window, which shows images in this group (not shown here) and slices of the volume reconstructed from these images (panel c). The volume isosurface can be visualized by clicking on the Chimera icon in the slices display menu (panel c)

References

    1. Zhang X, Settembre E, Xu C, et al. Near‐atomic resolution using electron cryomicroscopy and single‐particle reconstruction. Proc Natl Acad Sci U S A. 2008;105:1867–1872. - PMC - PubMed
    1. Yu X, Jin L, Zhou ZH. 3.88 a structure of cytoplasmic polyhedrosis virus by cryo‐electron microscopy. Nature. 2008;453:415–419. - PMC - PubMed
    1. Liao M, Cao E, Julius D, Cheng Y. Structure of the trpv1 ion channel determined by electron cryo‐microscopy. Nature. 2013;504:107–112. - PMC - PubMed
    1. Bai XC, Yan C, Yang G, et al. An atomic structure of human gamma‐secretase. Nature. 2015;525:212–217. - PMC - PubMed
    1. Bartesaghi A, Merk A, Banerjee S, et al. 2.2 a resolution cryo‐em structure of beta‐galactosidase in complex with a cell‐permeant inhibitor. Science. 2015;348:1147–1151. - PMC - PubMed

Publication types

LinkOut - more resources