

Contactless monitoring of heart and respiratory rate in anesthetized pigs using infrared thermography
- PMID: 31693688
- PMCID: PMC6834247
- DOI: 10.1371/journal.pone.0224747
Contactless monitoring of heart and respiratory rate in anesthetized pigs using infrared thermography
Abstract
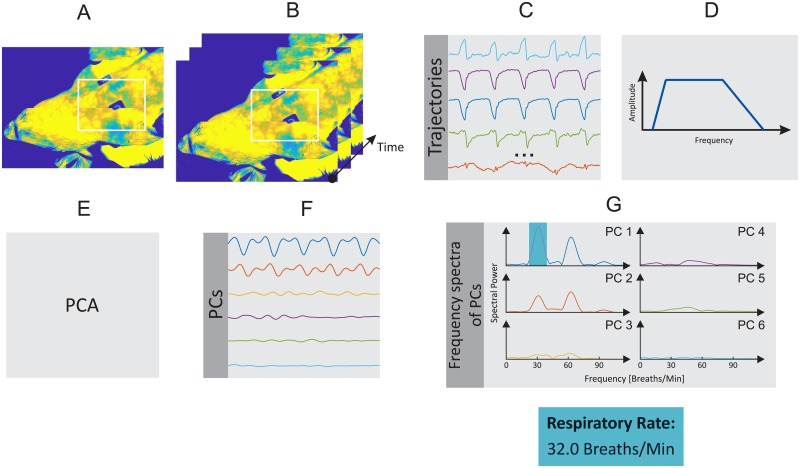
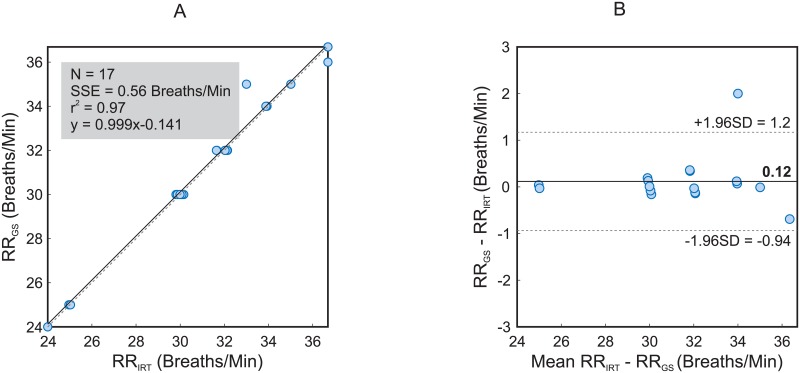
Pig experiments have played an important role in medical breakthroughs during the last century. In fact, pigs are one of the major animal species used in translational research, surgical models and procedural training due to their anatomical and physiological similarities to humans. To ensure high bioethical standards in animal trials, new directives have been implemented, among others, to refine the procedures and minimize animals' stress and pain. This paper presents a contactless motion-based approach for monitoring cardiorespiratory signals (heart rate and respiratory rate) in anesthetized pigs using infrared thermography. Heart rate monitoring is estimated by measuring the vibrations (precordial motion) of the chest caused by the heartbeat. Respiratory rate, in turn, is computed by measuring the mechanical chest movements that accompany the respiratory cycle. To test the feasibility of this approach, thermal videos of 17 anesthetized pigs were acquired and analyzed. A high agreement between infrared thermography and a gold standard (electrocardiography and capnography-derived respiratory rate) was achieved. The mean absolute error averaged 3.43 ± 3.05 bpm and 0.27 ± 0.48 breaths/min for heart rate and respiratory rate, respectively. In sum, infrared thermography is capable of assessing cardiorespiratory signals in pigs. Future work should be conducted to evaluate infared thermography capability of capturing information for long term monitoring of research animals in a diverse set of facilities.
Conflict of interest statement
M.C. is co-founder and CEO of Docs in Clouds GmbH, a provider of engineering services developing camera-based systems to assess vital data in various medical and non-medical applications. However, this does not alter our adheren ce to PLOS ONE policies on sharing data and materials.
Figures


References
-
- Exner C, Bode H, Blumer K, Giese C. Animal Experiments in Research Eds. Senate Commission on Animal Protection and Experimentation. Bonn: Lemmens Medien GmbH; 2007.
-
- Russell WMS, Burch RL. The principles of humane experimental technique. London: Methuen; 1959.
-
- Science, Medicine, and Animals. Washington, DC: The National Academies Press; 1991. - PubMed
Publication types
MeSH terms
LinkOut - more resources
Full Text Sources
