. 2019 Nov 5;29(6):1511-1523.e5.
doi: 10.1016/j.celrep.2019.09.070.

Metformin Improves Mitochondrial Respiratory Activity through Activation of AMPK

Affiliations

Metformin Improves Mitochondrial Respiratory Activity through Activation of AMPK

Yu Wang et al. Cell Rep. .

Abstract

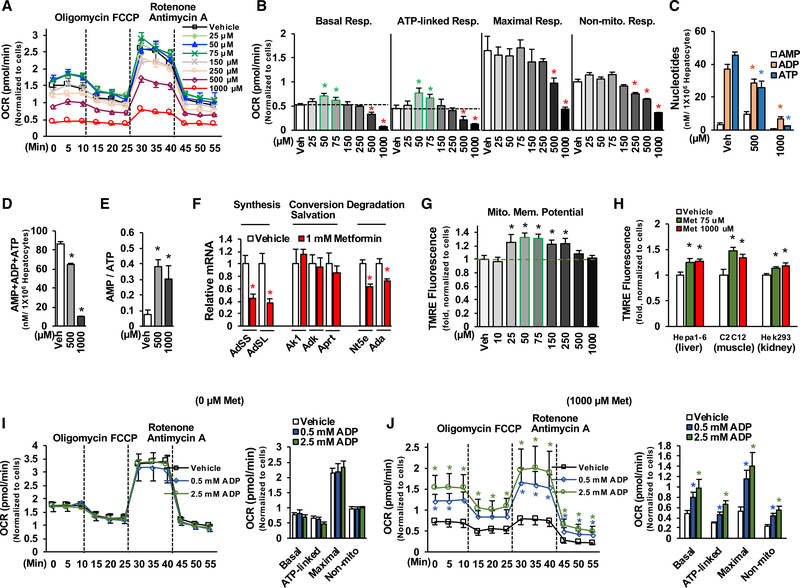
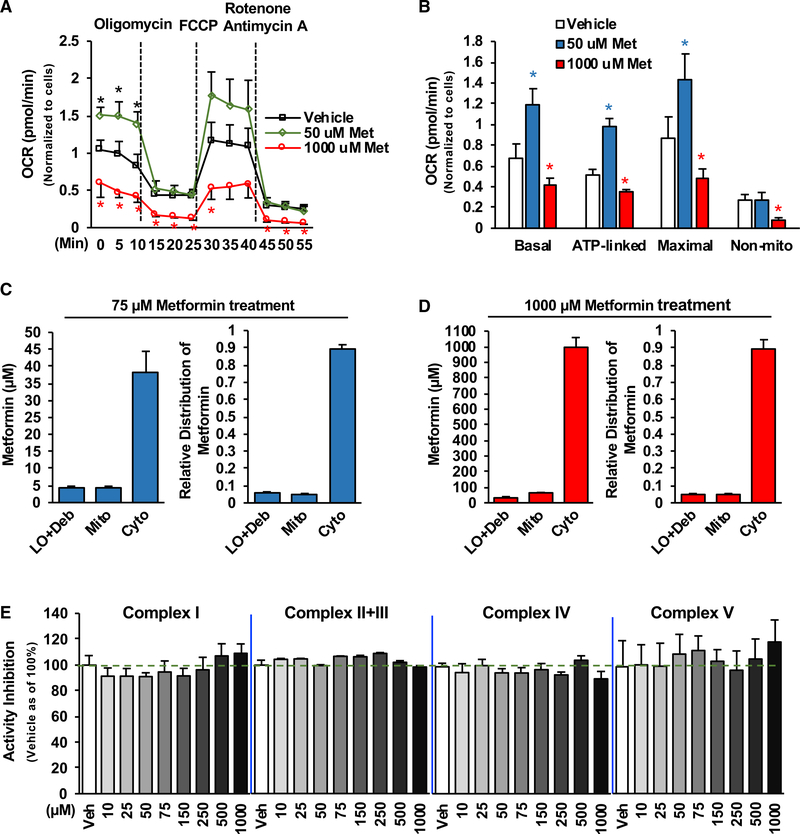
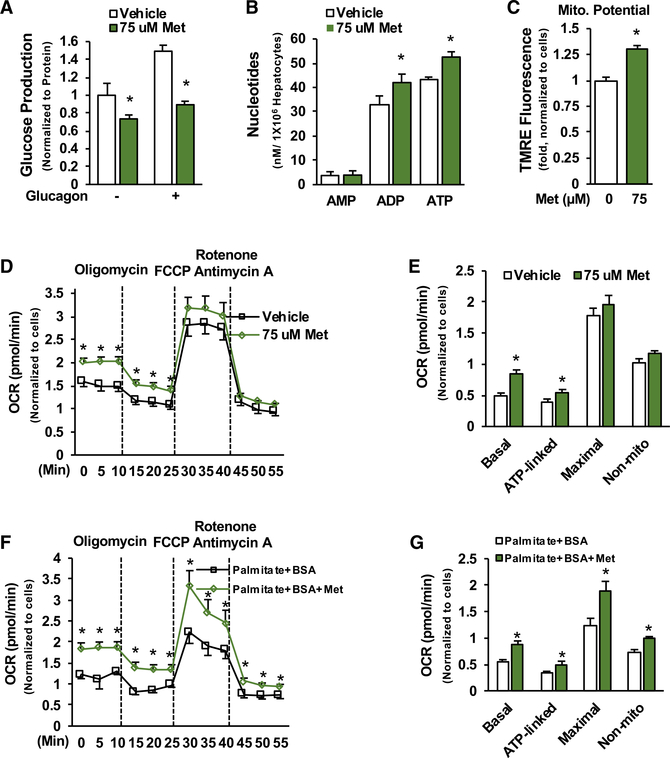
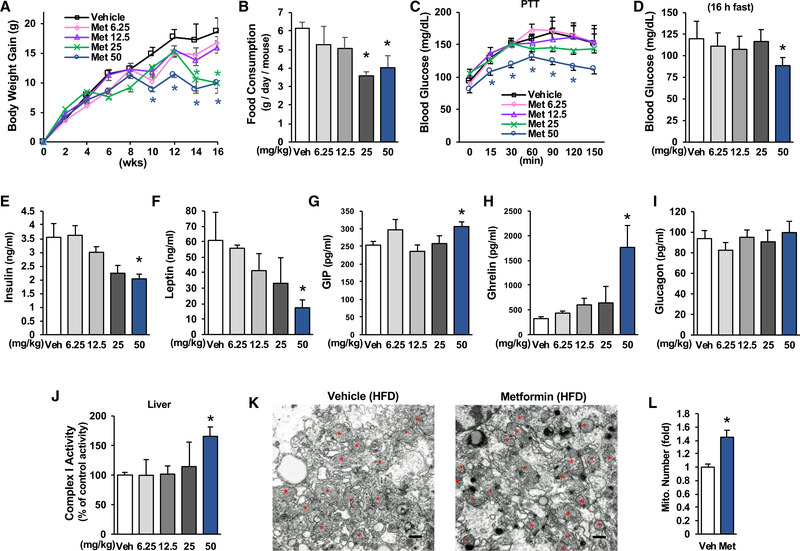
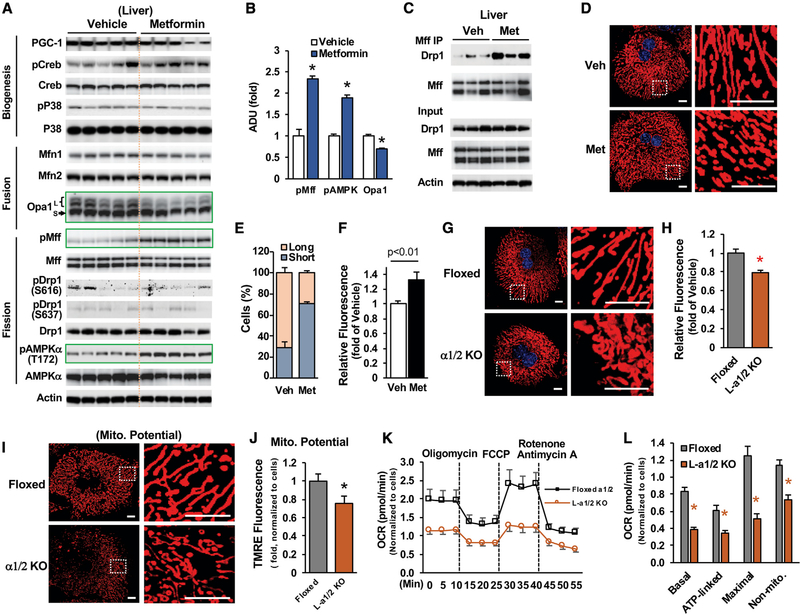
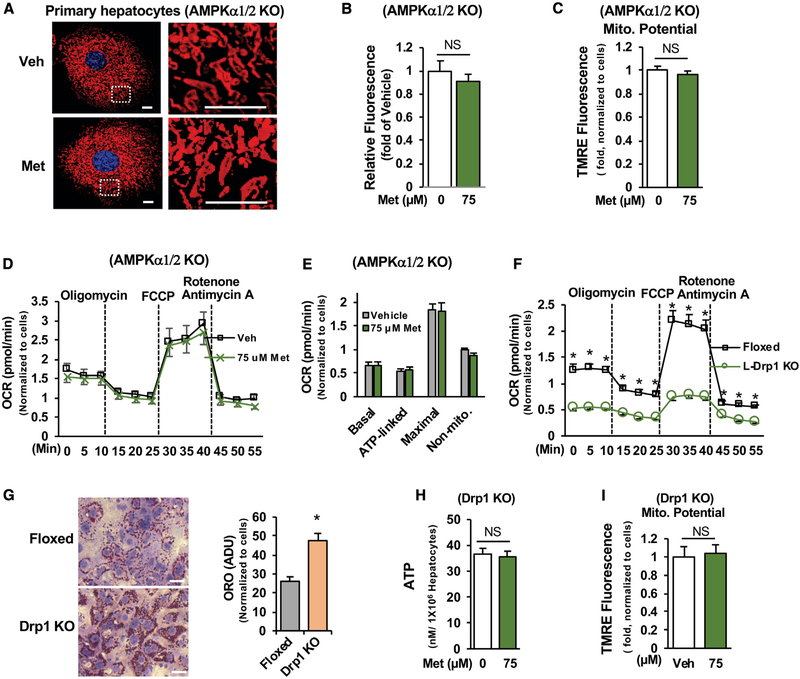
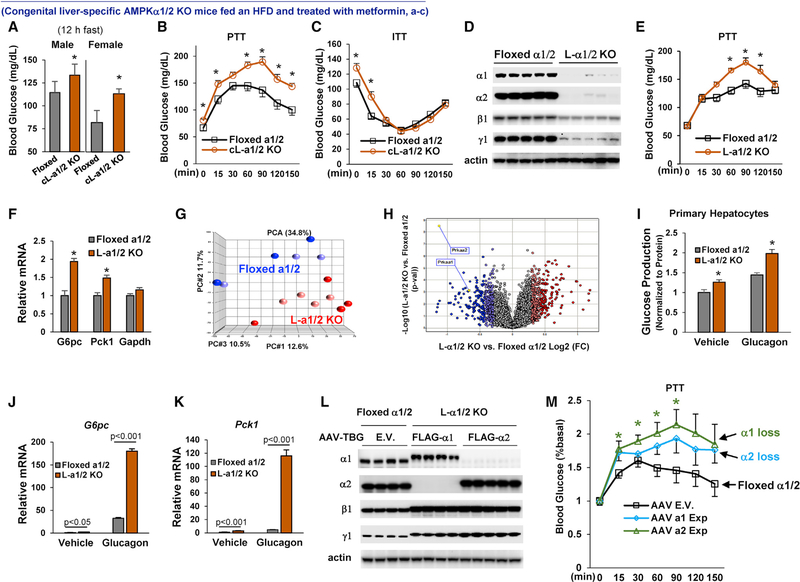
Impaired mitochondrial respiratory activity contributes to the development of insulin resistance in type 2 diabetes. Metformin, a first-line antidiabetic drug, functions mainly by improving patients' hyperglycemia and insulin resistance. However, its mechanism of action is still not well understood. We show here that pharmacological metformin concentration increases mitochondrial respiration, membrane potential, and ATP levels in hepatocytes and a clinically relevant metformin dose increases liver mitochondrial density and complex 1 activity along with improved hyperglycemia in high-fat- diet (HFD)-fed mice. Metformin, functioning through 5' AMP-activated protein kinase (AMPK), promotes mitochondrial fission to improve mitochondrial respiration and restore the mitochondrial life cycle. Furthermore, HFD-fed-mice with liver-specific knockout of AMPKα1/2 subunits exhibit higher blood glucose levels when treated with metformin. Our results demonstrate that activation of AMPK by metformin improves mitochondrial respiration and hyperglycemia in obesity. We also found that supra-pharmacological metformin concentrations reduce adenine nucleotides, resulting in the halt of mitochondrial respiration. These findings suggest a mechanism for metformin's anti-tumor effects.

Keywords: AMPK; Drp1; adenine nucleotides; diabetes; insulin resistance; membrane potential; metformin; mitochondrial respiration/fission.


Conflict of interest statement

DECLARATION OF INTERESTS

The authors declare no competing interests

Figures

Figure 1.
Figure 1.. Supra-pharmacological Metformin Concentrations Reduce Adenine Nucleotides and Mitochondrial Respiration
(A and B) After24 h of planting, primary hepatocytes were treated with different concentrations of metformin for16h in DMEM, and then medium was changed to glucose production medium supplemented with metformin for 6 h (A). After determination of basal oxygen consumption rate (OCR), cells were sequentially treated with oligomycin A (1 μM), carbonyl cyanide 4-(trifluoromethoxy)phenylhydrazone (FCCP; 1 μM), and rotenone (1 μM) plus antimycin A(1 μM) (B) (n = 8–10). (C–E) Primary hepatocytes were treated with 500 and 1,000 μM of metformin as in (A), adenine nucleotides were measured (C), total adenine nucleotides (D), and AMP/ATP ratio (E) (n = 4). (F) The mRNA levels of genes related to the metabolism of adenine nucleotides in primary hepatocytes treated with 1,000 μM metformin for 22 h (n = 5–6). (G) Primary hepatocytes were treated with different concentrations of metformin for 22 h (n = 8). (H) Hepa1–6 cells, C2C12 cells, and Hek293 cells were treated with 75 and 1,000 μM of metformin for 22 h and then stained with tetramethylrhodamine, ethyl ester (TMRE) (n = 6–8). (I and J) Primary hepatocytes were treated with vehicle (I) or 1,000 μM of metformin (J) as in (A); 0.5 and 2.5 mM of ADP were added in the assay buffer during the measurement of OCR (n = 6–8). Each bar represents the mean ± SEM. *p < 0.05.
Figure 2.
Figure 2.. Determination of Metformin Concentrations in Cellular Compartments of Hepatocytes
(A and B) Hepa1–6 cells were treated with different concentrations of metformin as In Figure 1A, and OCR was determined (n = 6–8). (C and D) Metformin concentrations in the large organelles/debris (LO/Deb), mitochondria (Mito), and cytosolic (Cyto) fractions prepared from Hepa1–6 cells treated with 75 μM (C) (n = 4) or 1,000 μM (D) (n = 5) of metformin for 22 h. (E) Indicated concentrations of metformin were used to test metformin’s effect on mitochondrial activity of complex I, complex II+III, complex IV, and complex V (purchased from the abcam) in in vitro assays (n = 6–8). Each bar represents the mean ± SEM. *p < 0.05.
Figure 3.
Figure 3.. Pharmacological Metformin Concentration Augments Mitochondrial Respiration
(A–C) Primary hepatocytes were treated with 75 μM metformin for 16 h and then treated with metformin for 3 h during serum starvation, followed by incubation in glucose production medium supplemented with metformin and/or 10 nM glucagon for another 3 h. Glucose concentrations were measured in the medium (A) (n = 3), cellular ATP levels (B) (n = 4), and mitochondrial membrane potential (C) (n = 8). (D and E) Primary hepatocytes were treated with metformin as in Figure 1A (D), and OCR was determined (E) (n = 10). (F and G) After 24 h of plating, primary hepatocytes were treated with 75 μM metformin for 16 h in substrate-limited medium, and then medium was replaced by fatty acid oxidation assay buffer (palmitate plus BSA) (F), and OCR was determined as above (G) (n = 6–7). Each bar represents the mean ± SEM. *p < 0.05.
Figure 4.
Figure 4.. Metformin Improves Metabolic Parameters in HFD-Fed Mice
HFD-fed C57BL/6 mice were divided into 5 groups and treated with indicated amounts of metformin by drinking water for 16 weeks (n = 5–8). (A) Body weight gain of mice during 16 weeks of metformin treatment. (B) Food consumption was measured during Comprehensive Lab Animal Monitoring System (CLAMS) (n = 4). (C) After 9 weeks of metformin treatment, a pyruvate tolerance test was conducted (16 h fast) (n = 5–8). (D) Fasting blood glucose (16 h fast) in mice after 12 weeks of metformin treatment. (E–I) Serum levels of insulin (E), leptin (F), GIP (G), ghrelin (H), and glucagon (I) in mice treated with metformin for 16 weeks (n = 5–8). (J–L) Mitochondrial complex 1 activity (J) (n = 5–8), mitochondrial numbers in the liver (K) (Scale bar, 500 nm), and relative mitochondrial density (L) in HFD-fed mice treated with metformin (50 mg/kg/day) for 16 weeks (n = 4). Each bar represents the mean ± SEM. *p < 0.05.
Figure 5.
Figure 5.. Metformin Promotes Mitochondrial Fission
(A and B)The protein and phosphorylation levels of genes related to mitochondrial biogenesis, fusion, and fission (A) (n = 5), and densitometric analysis of pAMPK (T172), pMff (S155/172), and Opa1 (B). (C) Liver lysates from HFD-fed mice treated with vehicle and 50 mg/kg/day of metformin were incubated with antibody against Mff (16 h, 4°C) (n = 3). (A and C) Each lane represents an individual mouse sample. (D–F) After 24 h of plating, primary hepatocytes prepared from floxed AMPK α1/2 mice were treated with or without 75 uM of metformin for 16 h, medium was changed to glucose production medium supplemented with metformin for 6 h, and then mitochondria were stained with MitoTracker Red (D); relative numbers of cells with indicated mitochondrial morphology (long or short) (E) (n = 119–127); and fluorescence intensity (mitochondrial mass) from 35 cells were measured from each group (F). (G and H) After 24 h of plating, primary hepatocytes prepared from floxed and liver-specific AMPK α1/2 knockout (L- α1/2 KO) mice were incubated with DMEM for 16 h, medium was changed to glucose production medium for 6 h, and then cells were stained with MitoTracker Red (G); fluorescence intensity (mitochondrial mass) was determined (H) (n = 37). (I and J) Primary hepatocytes prepared from floxed and L-α1/2 KO mice were stained with TMRE (I) to determine mitochondrial membrane potential (J) (n = 20~26). (K and L) After 36 h of plating, cellular respiration (K), basal OCR, ATP-linked respiration, maximal respiration, and non-mitochondrial respiration (L) were determined in primary hepatocytes prepared from floxed and L- α1/2 KO mice (n = 5–6). Scale bar, 10 μm. Each bar represents the mean ± SEM. *p < 0.05.
Figure 6.
Figure 6.. Metformin Stimulation of Mitochondrial Respiration Is AMPK Dependent
(A–C) Primary hepatocytes prepared from L- α1/2 KO mice were treated with metformin as in Figure 5D (A), fluorescence intensity of 40 cells were measured (B), and mitochondrial membrane potential was determined (C) (n = 6). Scale bar, 10 μm. (D and E) Primary hepatocytes prepared from liver-specific AMPK α1/2 KO mice were treated with vehicle and 75 μM metformin as in Figure 3D (D); OCR was determined (E) (n = 8–10). (F) OCRs were determined in primary hepatocytes prepared from floxed or liver-specific Drp1 KO mice as above (n = 6). (G) After 48 h of the planting, primary hepatocytes were stained with Oil Red O, and lipid droplets were measured (n = 91). Scale bar, 50 μM. (H and I) For measurement of ATP (H) (n = 4) and membrane potential (I) (n = 8), primary hepatocytes were treated as in Figures 3B and 3C. NS, not significant. Each bar represents the mean ± SEM. *p < 0.05.
Figure 7.
Figure 7.. The Critical Role of AMPKα1/2 in Metformin’s Control of Liver Glucose Metabolism
(A) Male (n = 9–10) and female (n = 5) mice were fed an HFD for 4 weeks and then treated with metformin (50 mg/kg/day) for12 weeks; 12-h fasting blood glucose levels. The y axis has been broken and begins at 50 mg/dL. (B and C) HFD-fed male mice were treated with metformin (50 mg/kg/day) for7–9 weeks; pyruvate tolerance test (B) and insulin tolerance test (C) were conducted (n = 6–9). (D–H) Male floxed AMPKα1/2 mice were fed an HFD for4weeks, AAV-TBG vectors were injected, and then mice were treated with metformin (50 mg/kg/day) for 3 weeks (D). (E and F) Pyruvate tolerance test (E) and hepatic mRNA levels of G6pc and Pck1 (F) (n = 5–6). (G and H) PCA (G) and Volcano plots (H) were used to depict differential expression of liver genes. Data shown are replicated from 2 independent experiments. (I–K) Primary hepatocytes were isolated from the liver of mice as in (D) and were treated with 10 nM glucagon (n = 3) (I). (J and K) The mRNA levels of G6pc (J) and Pck1 (K) (n = 3). (L and M) Male homozygous floxed AMPKα1/2 mice were fed an HFD for 4 weeks, and mice were injected with AAV vectors as described in the STAR Methods. Mice were reated with metformin (50 mg/kg/day) for 3 weeks. Immunoblots of AMPK subunits (L), and a pyruvate tolerance test was conducted (M) (n = 4–5). (D and L) Each lane represents an individual mouse liver sample. Each bar represents the mean ± SEM. *p < 0.05.

Comment in

References

    1. Adeyemo MA, McDuffie JR, Kozlosky M, Krakoff J, Calis KA, Brady SM, and Yanovski JA (2015). Effects of metformin on energy intake and satiety in obese children. Diabetes Obes. Metab 17, 363–370. - PMC - PubMed
    1. Bridges HR, Jones AJ, Pollak MN, and Hirst J (2014). Effects of metformin and other biguanides on oxidative phosphorylation in mitochondria. Biochem. J 462, 475–487. - PMC - PubMed
    1. Cao J, Meng S, Chang E, Beckwith-Fickas K, Xiong L, Cole RN, Radovick S, Wondisford FE, and He L (2014). Low concentrations of metformin suppress glucose production in hepatocytes through AMP-activated protein kinase (AMPK). J. Biol. Chem 289, 20435–20446. - PMC - PubMed
    1. Cao J, Peng J, An H, He Q, Boronina T, Guo S, White MF, Cole PA, and He L (2017). Endotoxemia-mediated activation of acetyltransferase P300 impairs insulin signaling in obesity. Nat. Commun 8, 131. - PMC - PubMed
    1. Cereghetti GM, Stangherlin A, Martins de Brito O, Chang CR, Blackstone C, Bernardi P, and Scorrano L (2008). Dephosphorylation by calcineurin regulates translocation of Drp1 to mitochondria. Proc. Natl. Acad. Sci. USA 705, 15803–15808. - PMC - PubMed

Publication types

MeSH terms