. 2019 Nov 5;29(6):1568-1578.e4.
doi: 10.1016/j.celrep.2019.09.085.

AMIGO2 Scales Dendrite Arbors in the Retina

Affiliations

AMIGO2 Scales Dendrite Arbors in the Retina

Florentina Soto et al. Cell Rep. .

Abstract

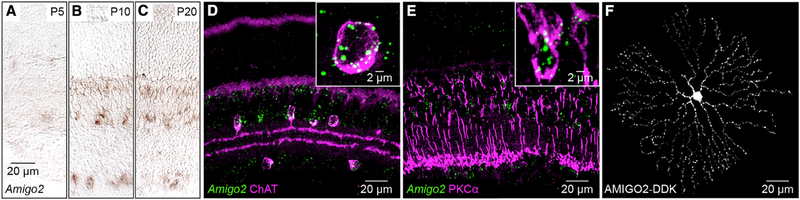
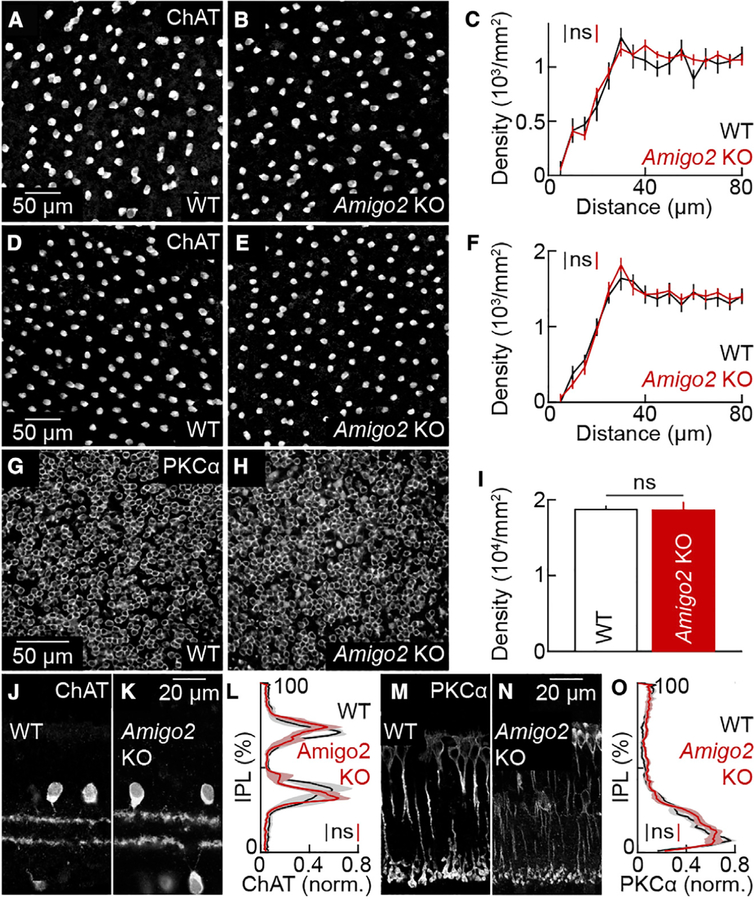
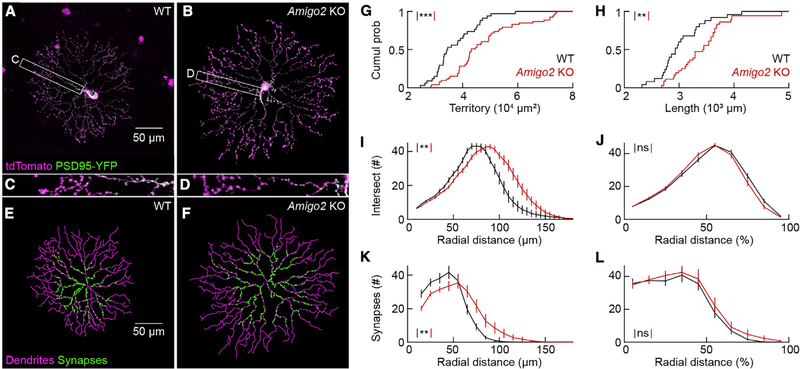
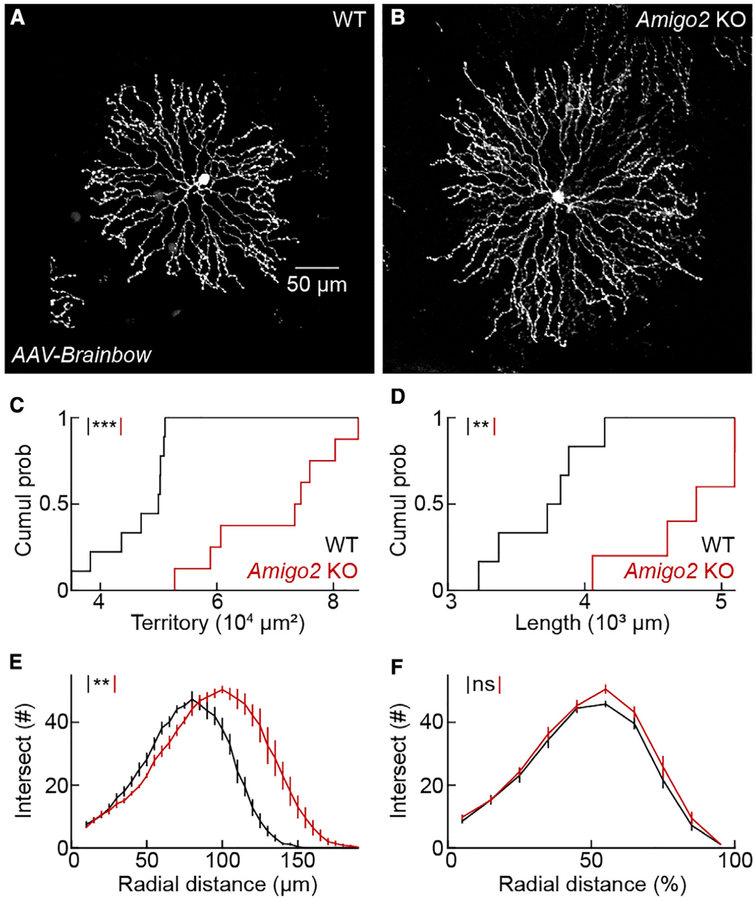
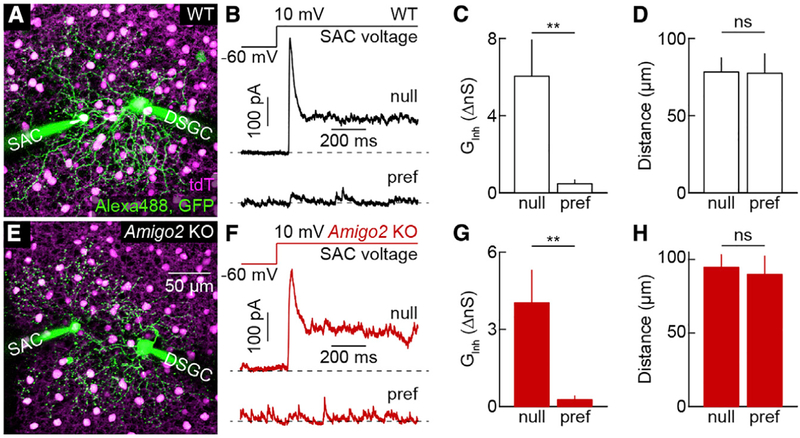
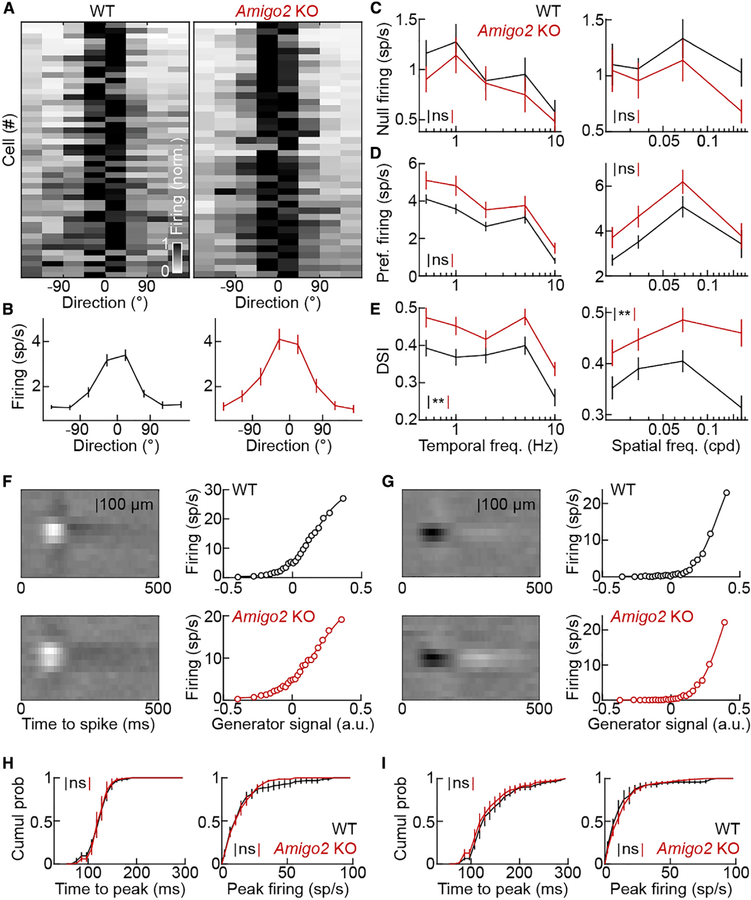
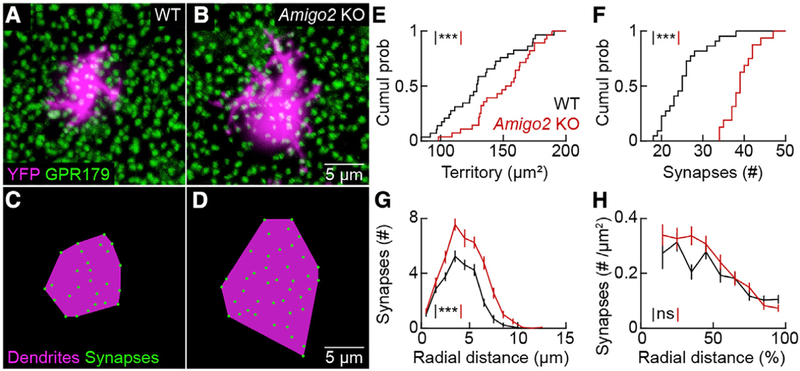
The size of dendrite arbors shapes their function and differs vastly between neuron types. The signals that control dendritic arbor size remain obscure. Here, we find that in the retina, starburst amacrine cells (SACs) and rod bipolar cells (RBCs) express the homophilic cell-surface protein AMIGO2. In Amigo2 knockout (KO) mice, SAC and RBC dendrites expand while arbors of other retinal neurons remain stable. SAC dendrites are divided into a central input region and a peripheral output region that provides asymmetric inhibition to direction-selective ganglion cells (DSGCs). Input and output compartments scale precisely with increased arbor size in Amigo2 KO mice, and SAC dendrites maintain asymmetric connectivity with DSGCs. Increased coverage of SAC dendrites is accompanied by increased direction selectivity of DSGCs without changes to other ganglion cells. Our results identify AMIGO2 as a cell-type-specific dendritic scaling factor and link dendrite size and coverage to visual feature detection.

Keywords: LRR; dendrites; development; direction selectivity; leucine-rich repeat protein; retina; rod bipolar cell; starburst amacrine cell.


Conflict of interest statement

DECLARATION OF INTERESTS

The authors declare no competing interests.

Figures

Figure 1.
Figure 1.. Amigo2 Expression in the Retina
(A–C) In situ hybridization for Amigo2 in postnatal day 5 (P5; A), P10 (B), and P20 (C) retinas. (D and E) Combined in situ hybridization for Amigo2 (green) with immunohistochemistry for ChAT (D; magenta) and PKCɑ (E; magenta) in sections of P20 retinas. (F) Representative SAC biolistically labeled with AMIGO2-DDK in a flat-mounted P20 retina. The cell was digitally isolated in Amira for visual clarity See also Figure S1.
Figure 2.
Figure 2.. Soma and Neurite Distributions of SACs and RBCs in Wild-Type and Amigo2 KO Mice
(A and B) Images of the ganglion cell layer in retinal flat mounts from wild-type (A) and Amigo2 KO (B) retinas stained for ChAT. (C) Density recovery profiles (mean ± SEM) of SACs in the ganglion cell layer of wild-type (n = 7 retinas) and Amigo2 KO (n = 12 retinas) mice; p = 0.74 by bootstrapping. The overall density of SACs in the ganglion cell layer was not significantly different between wild-type (1,143 ± 70 cells mm−2) and Amigo2 KO retinas (1,108 ± 38 cells mm−2; p = 0.89 by Mann-Whitney U test. (D and E) Images of the inner nuclear layer in retinal flat mounts from wild-type (D) and Amigo2 KO (E) retinas stained for ChAT. (F) Density recovery profiles (mean ± SEM) of SAC cell bodies in the inner nuclear layer of wild-type (n = 8 retinas) and Amigo2 KO (n = 11 retinas) mice; p = 0.98 by bootstrapping. The overall density of SACs in the nuclear layer was not significantly different between wild-type (1,472 ± 108 cells mm−2) and Amigo2 KO retinas (1,453 ± 79 cells mm−2; p = 0.97 by Mann-Whitney U test. (G and H) Images of the inner nuclear layer in retinal flat mounts from wild-type (G) and Amigo2 KO (H) retinas stained for PKCɑ. (I) Density (mean ± SEM) of RBCs in wild-type (18,738 ± 435 cells mm−2, n = 4 retinas) and Amigo2 KO (18,629 ± 1,036 cells mm−2, n = 5 retinas) mice; p = 0.91 by Mann-Whitney U test. (J and K) Sections of P20 wild-type (J) and Amigo2 KO (K) retinas stained for ChAT. (L) Lines (shaded areas) indicate the mean (± SEM) ChAT lamination patterns in the inner plexiform layer (IPL) in wild-type (n = 4 retinas) and Amigo2 KO (n = 8 retinas) mice; p = 0.43 by bootstrapping. (M and N) Sections of P20 wild-type (M) and Amigo2 KO (N) retinas stained for PKCɑ. (O) Lines (shaded areas) indicate the mean (± SEM) PKCɑ lamination patterns in the IPL in wild-type (n = 8 retinas) and Amigo2 KO (n = 9 retinas) mice; p = 0.40 by bootstrapping. Throughout the figure, ns indicates no significant differences for statistical comparisons. See also Figure S2.
Figure 3.
Figure 3.. ON SAC Arbors Expand but Maintain Branching Patterns and Subcellular Compartmentalization in Amigo2 KO Mice
(A and B) ON SACs biolistically labeled with cytosolic tdTomato (magenta) and PSD95-YFP (green), a marker of excitatory synapses, in flat-mounted P20 wild-type (A) and Amigo2 KO (B) retinas. Cells were digitally isolated in Amira for visual clarity. (C and D) Higher magnification view of the insets in (A) (shown in C) and (B) (shown in D). (E and F) Dendrite tracings (magenta) and output of synapse identification (green) for the ON SACs in (A) (shown in E) and in (B) (shown in F). (G) Cumulative distributions of ON SAC dendrite territories in wild-type (37,259 ± 1,361 μm2, n = 34 cells, n = 12 retinas) and Amigo2 KO (47,584 ± 1,712 μm2, n = 53 cells, n = 16 retinas) mice; p = 5.5 3 10−5 by Mann-Whitney U test. (H) Cumulative distributions of ON SAC dendrite lengths in wild-type (3,028 ± 86 μm, n = 25 cells, n = 12 retinas) and Amigo2 KO (3,422 ± 85 μm, n = 36 cells, n = 16 retinas) retinas; p = 0.0021 by Mann-Whitney U test. (I and J) Summary data of Sholl analyses for ON SAC branching patterns in wild-type (n = 16 cells, n = 10 retinas) and Amigo2 KO (n = 18 cells, n = 10 retinas) retinas. Distributions of branches as a function of absolute distance from the soma; p = 0.0056 by bootstrapping (I). (J) Distributions of branches as a function of normalized radial distance; p = 0.21 by bootstrapping (J). (K and L) Summary data of the radial distribution of excitatory synapses in ON SAC dendrites in wild-type (n = 16 cells, n = 10 retinas) and Amigo2 KO (n = 16 cells, n = 9 retinas) retinas. Distributions of synapses as a function of absolute distance from the soma; p = 0.012 by bootstrapping (K). Distributions of synapses as a function of normalized radial distance; p = 0.79 by bootstrapping (L). Throughout the figure, ***p < 0.001, **p < 0.01, and ns indicates no significant differences for statistical comparisons.
Figure 4.
Figure 4.. OFF SAC Arbors Expand but Maintain Branching Patterns in Amigo2 KO Mice
(A and B) OFF SACs labeled by AAV-Brainbow injections into the vitreous of ChAT-Cre mice on a wild-type (A) or Amigo2 KO (B) background. (C) Cumulative distributions of OFF SAC dendrite territories in wild-type (46,283 ± 2,003 μm2,n =9 cells, n = 3 retinas) and Amigo2 KO (70,070 ± 3,972 μm2, n = 8 cells, n = 3 retinas) mice; p = 8.2 3 10−5 by Mann-Whitney U test. (D) Cumulative distributions of OFF SAC dendrite lengths in wild-type (3,696 ± 139 μm, n = 6 cells, n = 3 retinas) and Amigo2 KO (4,733 ± 193 μm, n = 5 cells, n = 3 retinas) mice; p = 0.0087 by Mann-Whitney U test. (E and F) Summary data of Sholl analyses for OFF SAC branching patterns in wild-type (n = 6 cells, n = 3 retinas) and Amigo2 KO (n = 5 cells, n = 3 retinas) mice. Distributions of branches as a function of absolute distance from the soma; p = 0.0051 by bootstrapping (E). Distributions of branches as a function of normalized radial distance; p = 0.32 by bootstrapping (F). Throughout the figure, ***p < 0.001, **p < 0.01, and ns indicates no significant differences for statistical comparisons.
Figure 5.
Figure 5.. Asymmetric Connectivity between SACs and DSGCs in Wild-Type and Amigo2 KO Mice
(A) Maximum intensity projection of a two-photon image stack acquired at the end of a paired recording from a DSGC and a null-side SAC in a ChAT-Cre Ai9 DRD4-EGFP mouse on a wild-type background. (B) Representative inhibitory postsynaptic currents (IPSCs) elicited in DSGCs by depolarizing SACs on the null (top trace) and preferred side (bottom trace) in a wild-type background. (C and D) Summary data (mean ± SEM) comparing the inhibitory conductances activated in DSGCs by stimulation of SACs on the null versus preferred side (C; null side: 6.0 ± 1.9 nS, n = 6 pairs, n = 4 retinas; preferred side: 0.47 ± 0.20 nS n = 4 pairs, n = 4 retinas; p = 0.0095 by Mann-Whitney U test) and the soma-soma distance of SAC-DSGC pairs (D, null side: 78 ± 9.2 μm; preferred side: 78 ± 13 μm; p = 0.91 by Mann-Whitney U test) in a wild-type background. (E) Maximum intensity projection of a two-photon image stack acquired at the end of a paired recording from a DSGC and a null-side SAC in a ChAT-Cre Ai9 DRD4-EGFP mouse on an Amigo2 KO background. (F) Representative IPSCs elicited in DSGCs by depolarizing SACs on the null (top trace) and preferred side (bottom trace) in an Amigo2 KO background. (G and H) Summary data (mean ± SEM) comparing the inhibitory conductances activated in DSGCs by stimulation of SACs on the null versus preferred side (G; null side: 4.0 ± 1.3 nS, n = 7 pairs, n = 4 retinas; preferred side: 0.26 ± 0.15 nS, n = 6 pairs, n = 4 retinas; p = 0.0012 by Mann-Whitney U test) and the soma-soma distance of SAC-DSGC pairs (H; null side: 94.7 ± 8.6 μm; preferred side: 90 ± 13 μm; p = 1 by Mann-Whitney U test) in an Amigo2 KO background. Inhibitory conductances activated by stimulation of individual null-side SACs were not significantly different between wild-type and Amigo2 KO backgrounds (p = 0.37). Throughout the figure, **p < 0.01 and ns indicates no significant differences for statistical comparisons.
Figure 6.
Figure 6.. Response Selectivity of DSGCs Is Enhanced in Amigo2 KO Retinas
(A) Grayscale plots of the DSGC responses in wild-type (left panel) and Amigo2 KO (right panel) mice to drifting grating stimuli. Each row depicts average responses of one cell to 0.023–0.034 cycles per degree (cpd) gratings drifting at 1–2 cycles s−1 (wild-type: n = 46 cells, n = 6 retinas; Amigo2 KO: n = 40 cells, n = 8 retinas). Responses of each cell were centered on the direction eliciting the maximal response and its highest-response neighbor. (B) Summary data (mean ± SEM) of DSGC responses in (A) for wild-type (left panel) and Amigo2 KO (right panel) mice. (C) Responses of DSGCs (mean ± SEM) to null-direction drifting grating stimuli of varying temporal (left panel) and spatial (right panel) frequencies in wild-type (n = 46 cells, n = 6 retinas) and Amigo2 KO (n = 40 cells, n = 8 retinas) mice. Null-direction firing rates tended to be lower in Amigo2 KO compared to wild-type mice, but this trend did not reach statistical significance; p = 0.39 (left panel) and p = 0.52 (right panel) by bootstrapping. (D) Responses of DSGCs (mean ± SEM) to preferred-direction drifting grating stimuli of varying temporal (left panel) and spatial (right panel) frequencies in wild-type (n = 46 cells, n = 6 retinas) and Amigo2 KO (n = 40 cells, n = 8 retinas) mice. Preferred-direction firing rates tended to be higher in Amigo2 KO compared to wild-type mice, but this trend did not reach statistical significance; p = 0.15 (left panel) and p = 0.056 (right panel) by bootstrapping. (E) Direction selectivity indices (DSIs; mean ± SEM) of DSGC responses to drifting grating stimuli of varying temporal (left panel) and spatial (right panel) frequencies in wild-type (n = 46 cells, n = 6 retinas) and Amigo2 KO (n = 40 cells, n = 8 retinas) mice. DSIs were consistently higher in Amigo2 KO compared to wild-type mice; p = 0.0032 (left panel) and p = 0.0085 (right panel) by bootstrapping. (F and G) Spatiotemporal receptive field maps (left panels) and static nonlinearities (right panels) of representative ON (F) and OFF (G) ganglion cells in wild-type (top panels) and Amigo2 KO (bottom panels) mice. (H) Cumulative distributions of time to peak sensitivity (left panel) and peak firing rates (right panel) of ON ganglion cells in wild-type (n = 143 cells, n = 5 retinas) and Amigo2 KO (n = 156 cells, n = 6 retinas) mice; p = 0.94 for time to peak sensitivity and p = 0.54 for peak firing rates by bootstrapping. (I) Cumulative distributions of time to peak sensitivity (left panel) and peak firing rates (right panel) of OFF ganglion cells in wild-type (n = 185 cells, n = 5 retinas) and Amigo2 KO (n = 233 cells, n = 6 retinas) mice; p = 0.67 for time to peak sensitivity and p = 0.59 for peak firing rates by bootstrapping. Throughout the figure, **p < 0.01 and ns indicates no significant differences for statistical comparisons. See also Figures S3 and S6.
Figure 7.
Figure 7.. RBC Dendrites Expand and Form More Synapses in Amigo2 KO Mice
(A and B) Maximum intensity projections of confocal image stacks of the outer plexiform layer of wild-type (A) and Amigo2 KO (B) retinas. RBC dendrites are labeled by AAV-Grm6-YFP and postsynaptic specializations are marked by GPR179 clusters. (C and D) Schematic representation of dendrite territories (magenta) and synapses (green) of the RBCs in (A) (shown in C) and (B) (shown in D), respectively. (E) Cumulative distributions of RBC dendrite territories in wild-type (131.4 ± 5.2 μm2,n= 29 cells, n =5 retinas) and Amigo2 KO (149.9 ± 4.5 μm2, n = 28 cells, n = 4 retinas) mice; p = 0.0075 by Mann-Whitney U test. (F) Cumulative distributions of RBC dendritic synapses in wild-type (25.2 ± 1.1, n = 22 cells, n = 5 retinas) and Amigo2 KO (39.13 ± 0.89, n = 16 cells, n = 4 retinas) mice; p = 6.1 3 10−7 by Mann-Whitney U test. (G) Summary data (mean ± SEM) of the distribution of synapses onto RBCs as a function of the absolute distance from the center of their dendritic territory in wild-type (n = 22 cells, n = 5 retinas) and Amigo2 KO (n = 16 cells, n = 4 retinas) mice; p = 1.0 3 10−5 by bootstrapping. (H) Summary data (mean ± SEM) of the synapse density across RBC dendrite territories as a function of the relative distance from the center of the territory in wild-type (n = 22 cells, n = 5 retinas) and Amigo2 KO (n = 16 cells, n = 4 retinas) mice; p = 0.16 by bootstrapping. Throughout the figure, ***p < 0.001 and ns indicates no significant differences for statistical comparisons. See also Figures S4 and S5.

Similar articles

Cited by

References

    1. Bleckert A, Schwartz GW, Turner MH, Rieke F, and Wong ROL (2014). Visual space is represented by nonmatching topographies of distinct mouse retinal ganglion cell types. Curr. Biol 24, 310–315. - PMC - PubMed
    1. Briggman KL, Helmstaedter M, and Denk W (2011). Wiring specificity in the direction-selectivity circuit of the retina. Nature 471, 183–188. - PubMed
    1. Brombas A, Kalita-de Croft S, Cooper-Williams EJ, and Williams SR (2017). Dendro-dendritic cholinergic excitation controls dendritic spike initiation in retinal ganglion cells. Nat. Commun 8, 15683. - PMC - PubMed
    1. Brown SP, He S, and Masland RH (2000). Receptive field microstructure and dendritic geometry of retinal ganglion cells. Neuron 27, 371–383. - PubMed
    1. Cai D, Cohen KB, Luo T, Lichtman JW, and Sanes JR (2013). Improved tools for the Brainbow toolbox. Nat. Methods 10, 540–547. - PubMed

Publication types

MeSH terms