. 2019 Nov 5;29(6):1675-1689.e9.
doi: 10.1016/j.celrep.2019.09.071.

Genomic Profiling of Childhood Tumor Patient-Derived Xenograft Models to Enable Rational Clinical Trial Design

Jo Lynne Rokita  1 Komal S Rathi  2 Maria F Cardenas  3 Kristen A Upton  4 Joy Jayaseelan  3 Katherine L Cross  5 Jacob Pfeil  6 Laura E Egolf  7 Gregory P Way  8 Alvin Farrel  9 Nathan M Kendsersky  10 Khushbu Patel  9 Krutika S Gaonkar  2 Apexa Modi  11 Esther R Berko  4 Gonzalo Lopez  12 Zalman Vaksman  9 Chelsea Mayoh  13 Jonas Nance  14 Kristyn McCoy  14 Michelle Haber  13 Kathryn Evans  13 Hannah McCalmont  13 Katerina Bendak  13 Julia W Böhm  13 Glenn M Marshall  15 Vanessa Tyrrell  16 Karthik Kalletla  2 Frank K Braun  17 Lin Qi  18 Yunchen Du  18 Huiyuan Zhang  18 Holly B Lindsay  18 Sibo Zhao  18 Jack Shu  18 Patricia Baxter  18 Christopher Morton  19 Dias Kurmashev  20 Siyuan Zheng  20 Yidong Chen  20 Jay Bowen  21 Anthony C Bryan  21 Kristen M Leraas  21 Sara E Coppens  21 HarshaVardhan Doddapaneni  3 Zeineen Momin  3 Wendong Zhang  22 Gregory I Sacks  4 Lori S Hart  4 Kateryna Krytska  4 Yael P Mosse  4 Gregory J Gatto  23 Yolanda Sanchez  24 Casey S Greene  25 Sharon J Diskin  12 Olena Morozova Vaske  26 David Haussler  27 Julie M Gastier-Foster  28 E Anders Kolb  29 Richard Gorlick  22 Xiao-Nan Li  30 C Patrick Reynolds  14 Raushan T Kurmasheva  20 Peter J Houghton  20 Malcolm A Smith  31 Richard B Lock  16 Pichai Raman  2 David A Wheeler  3 John M Maris  32
Affiliations

Genomic Profiling of Childhood Tumor Patient-Derived Xenograft Models to Enable Rational Clinical Trial Design

Jo Lynne Rokita et al. Cell Rep. .

Abstract

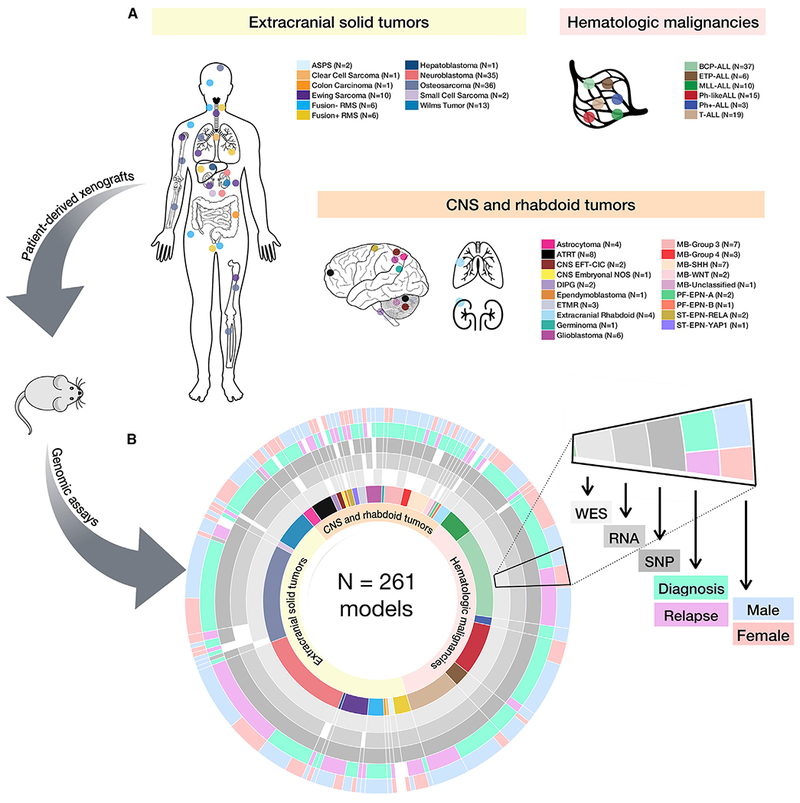
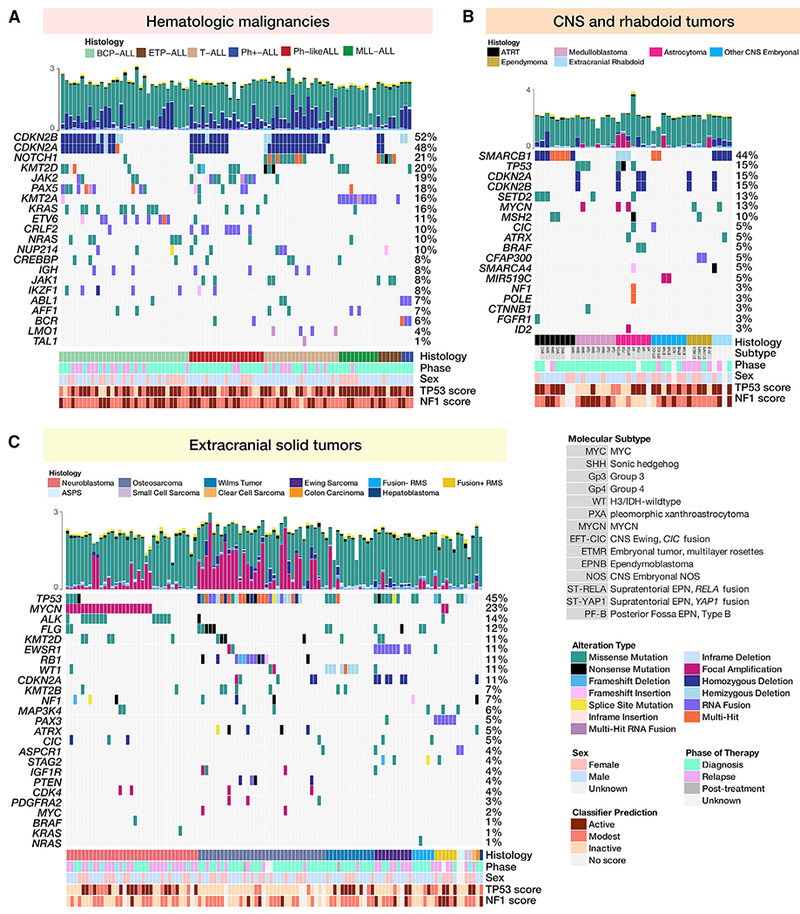
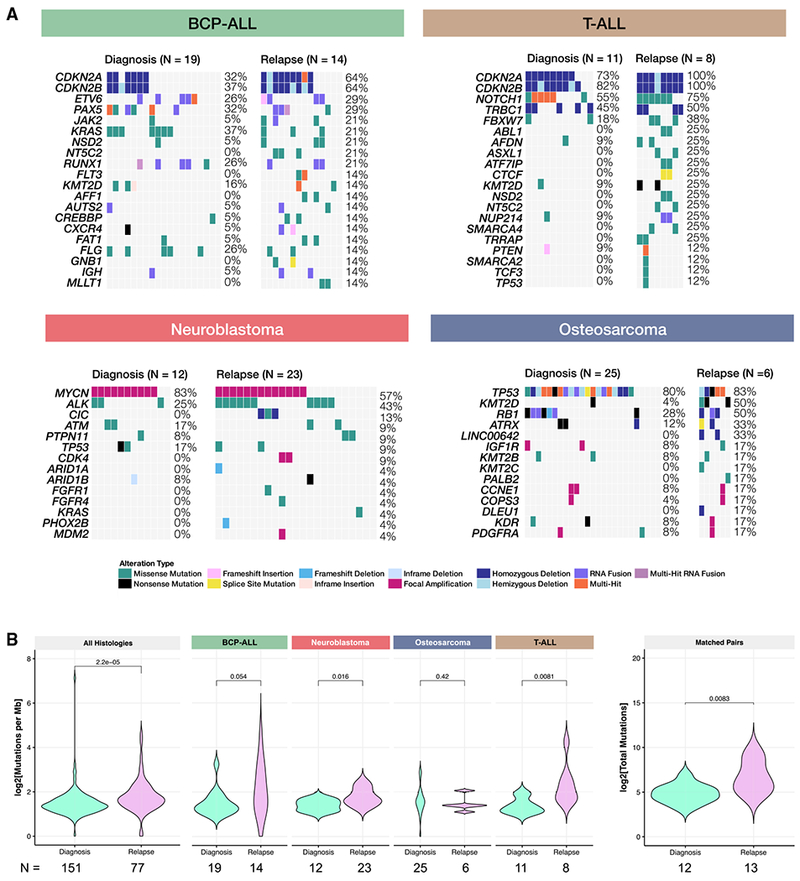
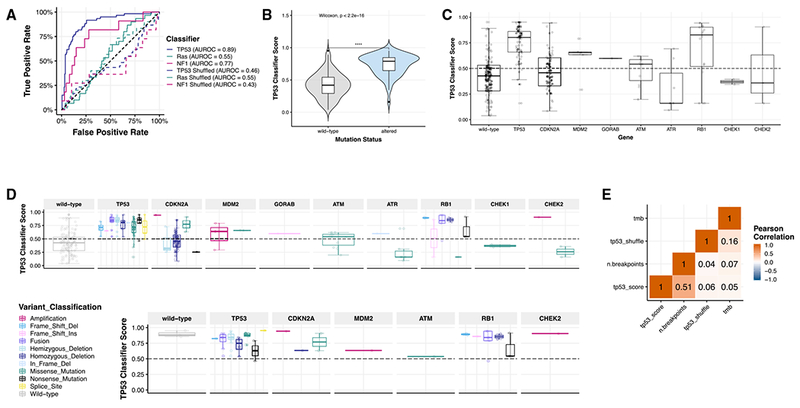
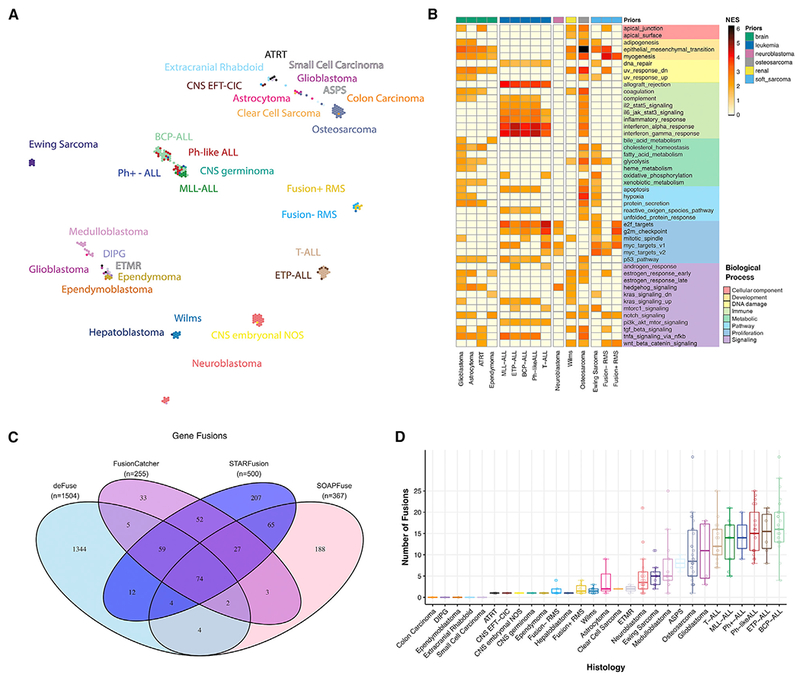
Accelerating cures for children with cancer remains an immediate challenge as a result of extensive oncogenic heterogeneity between and within histologies, distinct molecular mechanisms evolving between diagnosis and relapsed disease, and limited therapeutic options. To systematically prioritize and rationally test novel agents in preclinical murine models, researchers within the Pediatric Preclinical Testing Consortium are continuously developing patient-derived xenografts (PDXs)-many of which are refractory to current standard-of-care treatments-from high-risk childhood cancers. Here, we genomically characterize 261 PDX models from 37 unique pediatric cancers; demonstrate faithful recapitulation of histologies and subtypes; and refine our understanding of relapsed disease. In addition, we use expression signatures to classify tumors for TP53 and NF1 pathway inactivation. We anticipate that these data will serve as a resource for pediatric oncology drug development and will guide rational clinical trial design for children with cancer.

Keywords: classifier; copy number profiling; patient-derived xenograft; pediatric cancer; preclinical testing; relapse; transcriptome sequencing; whole-exome sequencing.


Conflict of interest statement

DECLARATION OF INTERESTS

The authors declare no competing interests.

Figures

Figure 1.
Figure 1.. Study and Sample Overview
(A and B) Diversity of the 261 childhood tumors collected (A) and demographics and genomic assays performed by histology (B). Assays performed were whole-exome sequencing (n = 240), whole transcriptome (n = 244), and SNP array copy number analysis (n = 252). Each genomic assay was performed once per biological tumor sample. See Figure S1 for analysis pipelines, Table S1 for model metadata, and Table S2 for STR profiles.
Figure 2.
Figure 2.. PDX Models Recapitulate the Mutational Landscape of Childhood Cancers
(A–C) Oncoprints of somatic alterations (homozygous deletions, amplifications, SNVs, and fusions) in hallmark driver genes for PDX models for which exome sequencing was performed (n = 240, top 20 genes per histology shown). Oncoprints are grouped by acute lymphoblastic leukemias (A), CNS and rhabdoid tumors (B) and extracranial solid tumors (C). (A) From left to right are B cell precursor ALLs (n = 33), T cell ALLs (n = 25), Philadelphia chromosome positive (Ph+) ALLs (n = 3), mixed lineage leukemias (MLL, n = 10), early T cell precursor (ETP) ALLs (n = 6), and Philadelphia chromosome-like (Ph-like) ALLs (n = 19). (B) From left to right are atypical teratoid rhabdoid tumors (ATRTs; n = 8), medulloblastomas (MBs; n = 8), astrocytomas (n = 7), non-MB/non-ATRT CNS embryonal tumors (n = 7), ependymomas (n = 5), and extracranial rhabdoid tumors (n = 4). (C) From left to right are neuroblastomas (n = 35), osteosarcomas (n = 34), Wilms tumors (n = 13), Ewing sarcomas (n = 10), fusion negative rhabdomyosarcomas (n = 6), fusion positive rhabdomyosarcomas (n = 6), and rare solid tumors (n = 7). Clinical annotations for all models include histology, patient phase of therapy from which PDX was derived, and sex. CNS tumors were also annotated with molecular subtype. Hemizygous deletions in TP53 are annotated for osteosarcoma models, in CDKN2A for leukemia models, and in WT1 for Wilms tumor models. Focal homozygous deletions correspond to loss of expression (FPKM < 1) in models for which RNA was available. For fusions, only the 5′ partner is shown. Total mutations (log 10) per model are plotted above each oncoprint and colored by mutation type. Each genomic assay was performed once per biological tumor sample.
Figure 3.
Figure 3.. Mutational Landscape of Models Derived from Tumors at Relapse
(A) For BCP-ALL, T-ALL, neuroblastoma, and osteosarcoma (histologies with N ≥ 6 models and multiple phases of therapy), oncoprints comparing hallmark alterations in models derived from diagnosis tumors to models derived from relapse tumors. (B) Tumor mutation burden (TMB) is significantly (or near significantly) higher in relapse models, compared to models established at diagnosis for all histologies collapsed (ndx = 151, nrel = 77, Wilcoxon p = 2.2e–5), BCP-ALL (ndx = 19, nrel = 14, Wilcoxon p = 0.051), neuroblastoma (ndx = 12, nrel = 23, Wilcoxon p = 0.016), and T-ALL (ndx =11, nrel = 8, Wilcoxon p = 0.0081). There was no difference between osteosarcoma models established at diagnosis and relapse (ndx = 25, nrel = 6, Wilcoxon p = 0.42). For patients in which models were established at both diagnosis and relapse, there was a significant increase in mutational burden upon relapse (ndx = 12, nrel = 13, p = 0.0083). All n’s denote biological replicates.
Figure 4.
Figure 4.. Expression and Mutational Signatures Classify Pediatric PDX Models for TP53 and NF1 Inactivation
(A) Only TP53 and NF1 classifiers performed well in our dataset (AUROCTP53 = 0.89, AUROCNF1 = 0.77, AUROCRas = 0.55). Solid lines represent real scores, and dotted lines represent shuffled scores. Forthe samples measured (n = 244), 60 had TP53 alterations (24.6%); 30 had KRAS, HRAS, or NRAS alterations (12.3%); and 11 had NF1 alterations (4.5%). (B) TP53 scores are significantly higher (nWT = 120, nALT = 124, Wilcoxon p < 2.2 e–16) in models with genetic aberrations in TP53 (mean score = 0.790) compared to those without alterations (mean score = 0.419). (C) Classifier scores are plotted based on the TP53 pathway gene alteration present (nWT = 120, nTP53 = 72, nCDKN2A = 63, nMDM2 = 5, nGORAB = 1, nATM = 11, nATR = 7, nRB1 = 16, nCHEK1 = 2, nCHEK2 = 3) or variant classification (n = 244 total samples). (D) TP53 classifier scores across all histologies broken down by TP53 pathway gene (n = 240). (E) In osteosarcoma models (n = 30), all scores, regardless of variant type or gene, were high and predicted pathway inactivation. Overall copy number burden (number of breakpoints calculated from SNP array data; STAR Methods) correlates significantly with TP53 classifier score (R = 0.51, p = 1.8e–17, n = 239). All n’s denote biological replicates.
Figure 5.
Figure 5.. Expression Profiles of PDX Models Cluster by Histology and Contain Driver Fusions
(A) TumorMap rendition of PDX RNA-seq expression matrices by histology. (B) Gene set enrichment analysis for Hallmark pathways for histologies with n ≥ 4 samples demonstrates histology-specific biologic processes significantly altered (adjusted p < 0.05 and NES > 2.0, N = 221). Samples were grouped by prior before GSEA (nbone sarcoma = 10, nbrain = 58, nleukemia = 90, nneuroblastoma = 35, nosteosarcoma = 36, nrenal = 14, nsoft sarcoma = 18). (C and D) Venn diagram of RNA fusion overlap among four algorithms (C) and high-confidence fusion totals (D) demonstrates a higher overall number of fusions in hematologic malignancies (boxplots are graphed as medians with box edges as first and third quartiles; detailed Ns in Table S3). n = 244 RNA samples used as input, and all n’s represent biological replicates.

References

    1. Alcoser SY, Kimmel DJ, Borgel SD, Carter JP, Dougherty KM, and Hollingshead MG (2011). Real-time PCR-based assay to quantify the relative amount of human and mouse tissue present in tumor xenografts. BMC Biotechnol. 11, 124. - PMC - PubMed
    1. American Childhood Cancer Organization (2014). Special Section: Cancer in Children & Adolescents In Cancer Facts and Figures 2014 (The American Cancer Society), pp. 25–42.
    1. Anders S, Pyl PT, and Huber W (2015). HTSeq–a Python framework to work with high-throughput sequencing data. Bioinformatics 31, 166–169. - PMC - PubMed
    1. Bainbridge MN, Wang M, Wu Y, Newsham I, Muzny DM, Jefferies JL, Albert TJ, Burgess DL, and Gibbs RA (2011). Targeted enrichment beyond the consensus coding DNA sequence exome reveals exons with higher variant densities. Genome Biol. 12, R68. - PMC - PubMed
    1. Baker SC, Bauer SR, Beyer RP, Brenton JD, Bromley B, Burrill J, Causton H, Conley MP, Elespuru R, Fero M, et al. ; External RNA Controls Consortium (2005). The External RNA Controls Consortium: a progress report. Nat. Methods 2, 731–734. - PubMed

Publication types

MeSH terms