. 2019 Nov 5;29(6):1718-1727.e8.
doi: 10.1016/j.celrep.2019.09.082.

DoubletDecon: Deconvoluting Doublets from Single-Cell RNA-Sequencing Data

Affiliations

DoubletDecon: Deconvoluting Doublets from Single-Cell RNA-Sequencing Data

Erica A K DePasquale et al. Cell Rep. .

Abstract

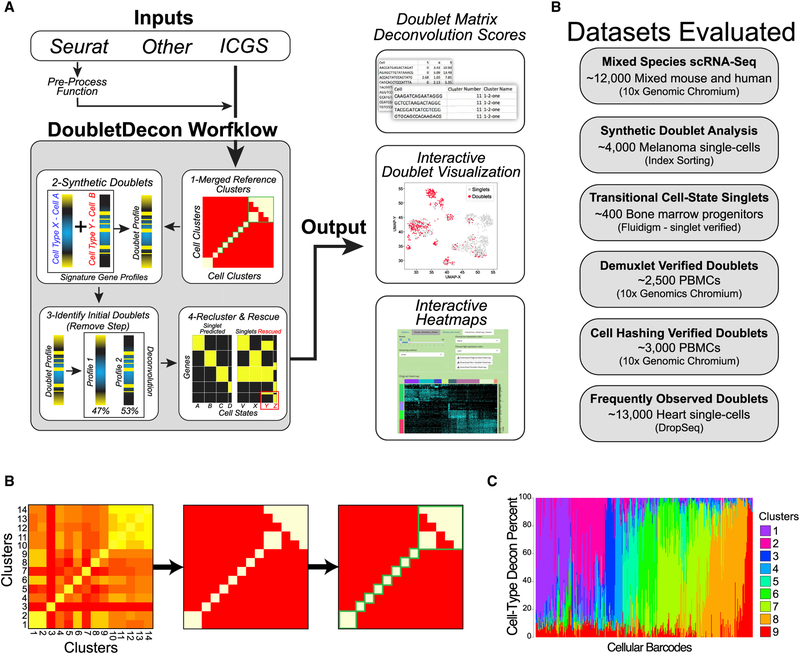
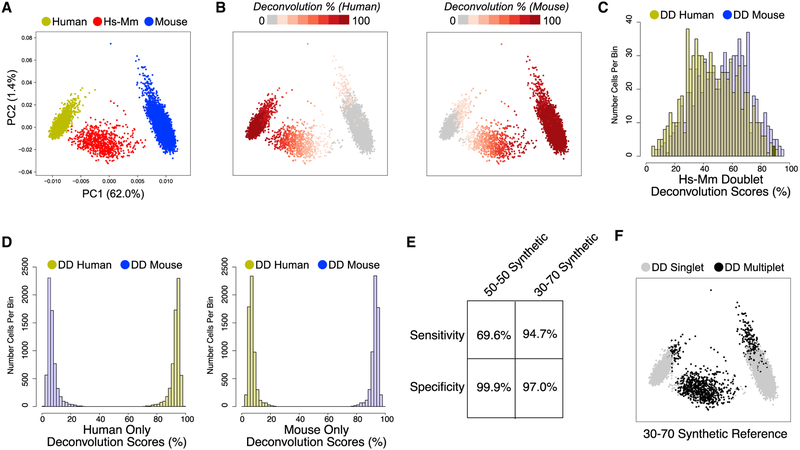
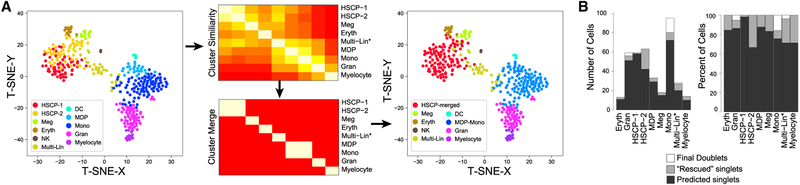
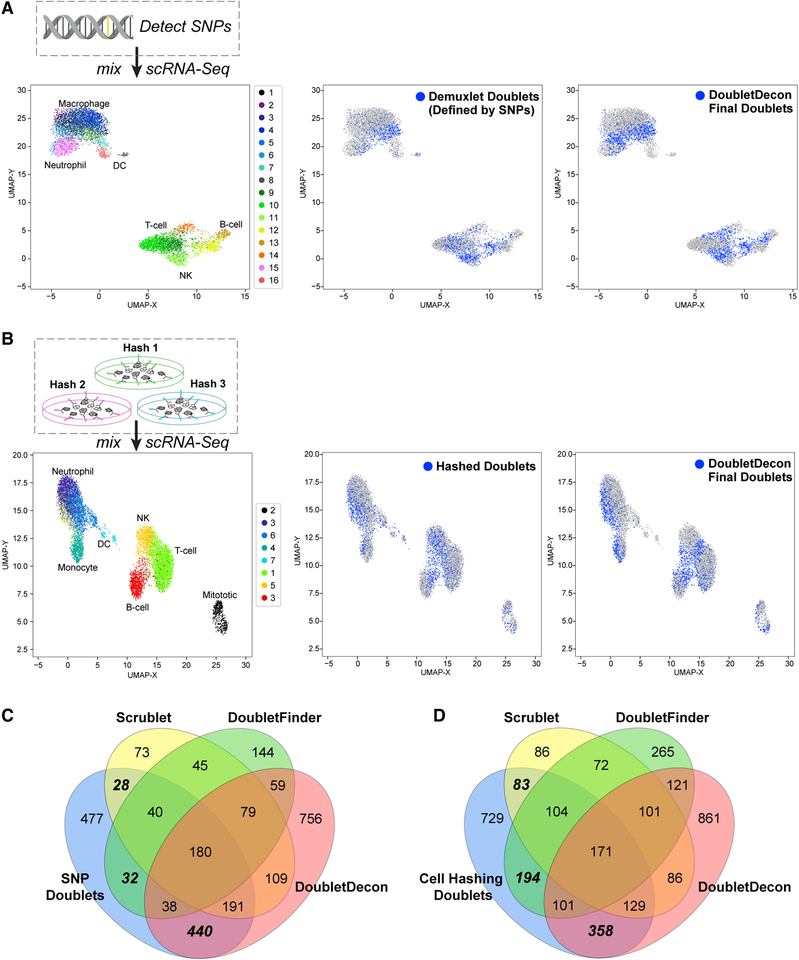
Methods for single-cell RNA sequencing (scRNA-seq) have greatly advanced in recent years. While droplet- and well-based methods have increased the capture frequency of cells for scRNA-seq, these technologies readily produce technical artifacts, such as doublet cell captures. Doublets occurring between distinct cell types can appear as hybrid scRNA-seq profiles, but do not have distinct transcriptomes from individual cell states. We introduce DoubletDecon, an approach that detects doublets with a combination of deconvolution analyses and the identification of unique cell-state gene expression. We demonstrate the ability of DoubletDecon to identify synthetic, mixed-species, genetic, and cell-hashing cell doublets from scRNA-seq datasets of varying cellular complexity with a high sensitivity relative to alternative approaches. Importantly, this algorithm prevents the prediction of valid mixed-lineage and transitional cell states as doublets by considering their unique gene expression. DoubletDecon has an easy-to-use graphical user interface and is compatible with diverse species and unsupervised population detection algorithms.

Keywords: RNA-seq; artifact detection; bioinformatics; deconvolution; doublet; multiplet; single-cell RNA-seq.


Conflict of interest statement

DECLARATION OF INTERESTS

The authors declare no competing interests.

Figures

Figure 1.
Figure 1.. Deconvolution and Detection of Cell Doublets with DoubletDecon
(A) Outline of the broad steps employed by DoubletDecon, including cluster merging, synthetic doublet generation, deconvolution, and rescue of initially predicted doublets through unique gene expression identification. The principal file inputs and sources are indicated along with distinct tabular and graphical outputs from the DoubletDecon package in R or through an easy-to-use graphical interface. (B) Illustration of cluster similarity determination from DoubletDecon to determine the threshold for cluster merging prior to synthetic doublet creation and deconvolution. Each centroid is calculated from the average gene expression of each separate cell state for all algorithm-selected cell-state marker genes (e.g., Seurat, ICGS). Initially, a centroid or medoid correlation matrix is created (left). Next, a threshold for centroid or medoid similarity is defined by the formula for ρ (outlined in the STAR Methods), with the user-defined value of ρ′ used to set the level of similarity required for a cluster to be considered correlated (middle). Finally, this new binary correlation matrix is visualized with a heatmap and Markov clustering is used to determine which sets of clusters should be merged for multiplet detection (right). (C) The frequency of cell-state deconvolution profiles is shown for a dataset without doublets (microscopy validated) (Olsson et al., 2016). Each column represents a different cell, in which each color indicates the percentage contribution of a reference cell type for that cell. Note, the majority are predicted to be composed principally of a single-cell-type reference. (D) Datasets evaluated to assess DoubletDecon’s accuracy on gene expression evidenced doublets with the number of cells and method of single-cell capture.
Figure 2.
Figure 2.. DoubletDecon Readily Distinguishes Experimentally Validated Doublets in Species-Mixing scRNA-Seq
(A) Separation of mouse, human, and mixed-species doublet scRNA-seq profiles by principal-component analysis (PCA) of ICGS variable genes. Species assignments are defined by the total number of aligned reads to either human (yellow), mouse (blue), or both (red) genomes. (B) Projection of species-specific deconvolution results (against human or mouse ICGS clusters) are displayed along the same PCA plot. Cells in gray indicate <10% identify to the indicated cluster, >90% in dark red, and lighter shades of red indicating intermediate scores. (C) Histogram of the mouse (blue) and human (yellow) DCP results (x axis) for known species mixed cells, indicating a bi-modal distribution for deconvolution scores peaking at 30% and 70%. (D) The same histogram is shown for deconvolution scores in only human cells (left) and only mouse cells (right), indicating a skewed distribution toward the correct species. (E) The accuracy of DoubletDecon doublet predictions using synthetic reference doublets derived from either a 50/50 equal contribution of cell transcriptomes (“only50” parameter) or from weighted averages of 30/70 and 70/30, in addition to the 50/50 synthetic doublets. (F) Projection of final called doublets (black) in the PCA, using 30/70 synthetic doublets.
Figure 3.
Figure 3.. Recovery of Rare Transitional Cell States through Singlet Rescue
Evaluation of a scRNA-seq dataset of mouse hematopoietic progenitors, with rare transitional states, is shown. All initially detected multiplets were removed through a microscopy validation step to selectively evaluate specificity for doublet detection. (A) Identification of highly related clusters for DoubletDecon reference creation from the original ICGS unsupervised population predictions (Olsson et al., 2016). (Left) Highlighted ICGS cell populations within a t-Distributed Stochastic Neighbor Embedding (t-SNE) before cluster merging. (Middle) DoubletDecon cluster similarity heatmaps indicating similarity and clustering merging. (Right) t-SNE plot of the merged cell populations. (B) Bar graph displaying number of cells within each cluster that were never removed (dark gray, “predicted singlets”), removed during the “remove” step but were subsequently rescued (light gray, “rescued singlets”), and removed during the “remove” step and were not rescued (white, “final doublets) per total cells in each cluster (left) and percentage of cells in each cluster (right).
Figure 4.
Figure 4.. Detection of Experimentally Validated Doublets from Peripheral Blood Mononuclear Cells (PBMCs)
(A and B) The analysis schema is shown for the evaluation of DoubletDecon on in silico identified doublet cell profiles obtained from the (A) Dexmulet software and (B) the Cell Hashing protocol. Demuxlet identifies cells with a combination of genomic variants associated with the eight profiled single-cell donors to find cellular bar codes with hybrid genotype profiles, whereas Cell Hashing selectively labels all cells from a single sample (donor) using different oligonucleotides conjugated to a common antibody. (Left) A Uniform Manifold Approximation and Projection (UMAP) plot of the de novo clusters obtained from analysis with ICGS. (Middle) UMAP projection of Demuxlet called doublets are indicated in blue. (Right) UMAP projections of DoubletDecon-classified doublets are highlighted in blue. Labels for each cell population were independently derived through ICGS version 2.0 using a published database of hematopeotic and immune markers via GO-Elite gene set enrichment analysis (Hay et al., 2018). (C and D) Venn diagrams representing the number of overlapping doublet predictions from the software packages DoubletDecon, Scrublet, and DoubletFinder on two previously published datasets of overloaded donor PBMCs using the (C) Demuxlet or (D) Cell Hashing protocols using the same filtered datasets described above. Hashing doublets, doublets defined from distinct hashtag oligo (HTO). If two or more HTOs had >20% of the total hashtag reads, they were considered multiplets (4,200 out of the initial total 12,000 cellular bar codes). Demuxlet doublets, doublets identified by Kang et al. (2018) using the software Demuxlet.
Figure 5.
Figure 5.. Empirical Removal of Confounding Doublet-Cell Populations for Unsupervised Subtype Detection
(A) t-SNE visualization of the predominant cell populations identified from Seurat of ~13,000 heart cells collected via Drop-Seq. (Left panel) Cell-type predictions are based on established heart marker genes (literature) and gene set enrichment in the software GO-Elite (cellular biomarker database). (Right panel) DoubletDecon doublet predictions overlaid on top of the Seurat t-SNE plot, localized to the periphery of the major Seurat clusters. The dashed circle highlights endothelial-specific predicted doublets adjacent to fibroblasts. (B and C) Secondary analysis of all Seurat-identified endothelial cells with (B) all doublets included and (C) doublets excluded with DoubletDecon prior to clustering. The left panel indicates distinct endothelial cell clusters with the doublet-enriched fibroblast cells highlighted (dashed circle), while the right panel visualizes expression of a fibroblast-specific marker. (D) Venn diagram of DoubletDecon doublet predictions with three sepearte Seurat clustering resolutions of the entire heart dataset. The numbers of doublets identified were 1,251 (5 clusters), 1,170 (8 clusters), and 1,189 (11 clusters), with 790 (63%) in common.

References

    1. Butler A, Hoffman P, Smibert P, Papalexi E, and Satija R (2018). Integrating single-cell transcriptomic data across different conditions, technologies, and species. Nat. Biotechnol 36, 411–420. - PMC - PubMed
    1. Chen H, Albergante L, Hsu JY, Lareau CA, Lo Bosco G, Guan J, Zhou S, Gorban AN, Bauer DE, Aryee MJ, et al. (2019). Single-cell trajectories reconstruction, exploration and mapping of omics data with STREAM. Nat. Commun 10, 1903. - PMC - PubMed
    1. Churko JM, Lee J, Ameen M, Gu M, Venkatasubramanian M, Diecke S, Sallam K, Im H, Wang G, Gold JD, et al. (2017). Transcriptomic and epigenomic differences in human induced pluripotent stem cells generated from six reprogramming methods. Nat. Biomed. Eng 1, 826–837. - PMC - PubMed
    1. DePasquale EAK, Schnell D, Dexheimer P, Ferchen K, Hay S, Chetal K, Valiente-Alandí Í , Blaxall BC, Grimes HL, and Salomonis N (2019). cellHarmony: cell-level matching and holistic comparison of single-cell transcriptomes. Nucleic Acids Res. gkz789. 10.1093/nar/gkz789. - DOI - PMC - PubMed
    1. Duan Q, McMahon S, Anand P, Shah H, Thomas S, Salunga HT, Huang Y, Zhang R, Sahadevan A, Lemieux ME, et al. (2017). BET bromodomain inhibition suppresses innate inflammatory and profibrotic transcriptional networks in heart failure. Sci. Transl. Med 9, eaah5084. - PMC - PubMed

Publication types