

Genome-wide analysis, transcription factor network approach and gene expression profile of GH3 genes over early somatic embryogenesis in Coffea spp
- PMID: 31694532
- PMCID: PMC6836404
- DOI: 10.1186/s12864-019-6176-1
Genome-wide analysis, transcription factor network approach and gene expression profile of GH3 genes over early somatic embryogenesis in Coffea spp
Abstract
Background: Coffee production relies on plantations with varieties from Coffea arabica and Coffea canephora species. The first, the most representative in terms of coffee consumption, is mostly propagated by seeds, which leads to management problems regarding the plantations maintenance, harvest and processing of grains. Therefore, an efficient clonal propagation process is required for this species cultivation, which is possible by reaching a scalable and cost-effective somatic embryogenesis protocol. A key process on somatic embryogenesis induction is the auxin homeostasis performed by Gretchen Hagen 3 (GH3) proteins through amino acid conjugation. In this study, the GH3 family members were identified on C. canephora genome, and by performing analysis related to gene and protein structure and transcriptomic profile on embryogenic tissues, we point a GH3 gene as a potential regulator of auxin homeostasis during early somatic embryogenesis in C. arabica plants.
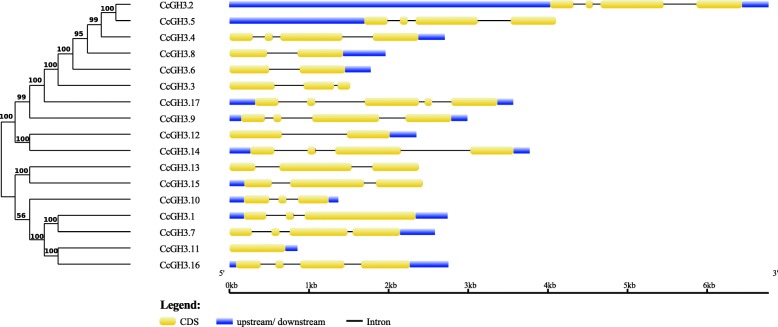
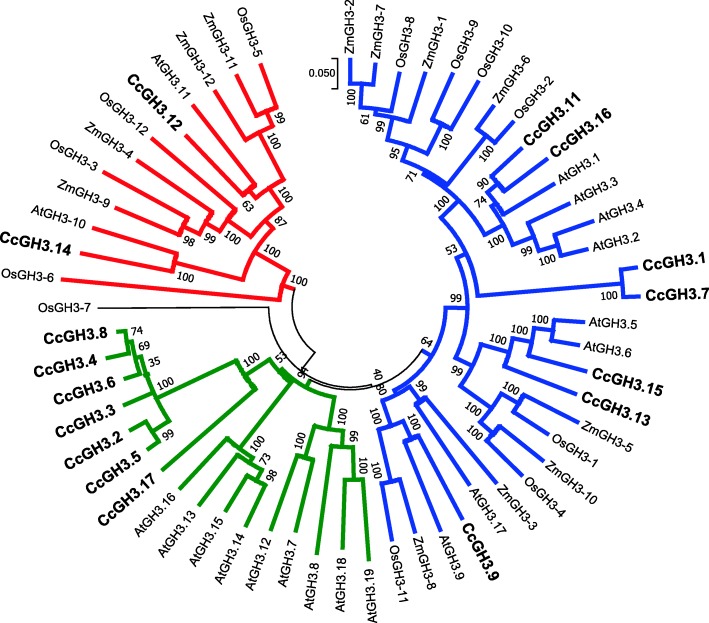
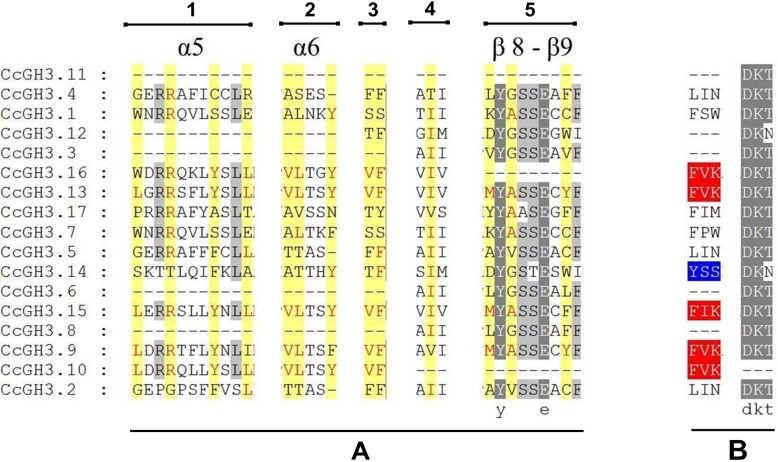
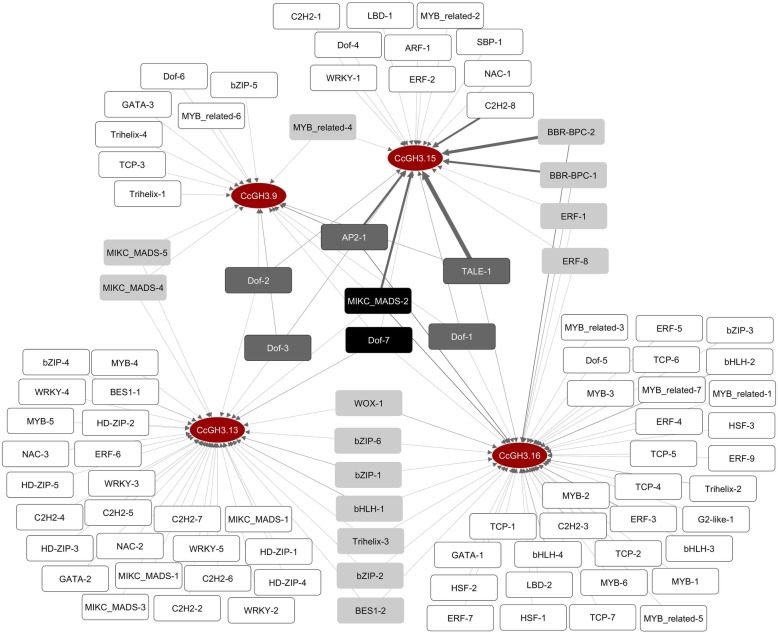
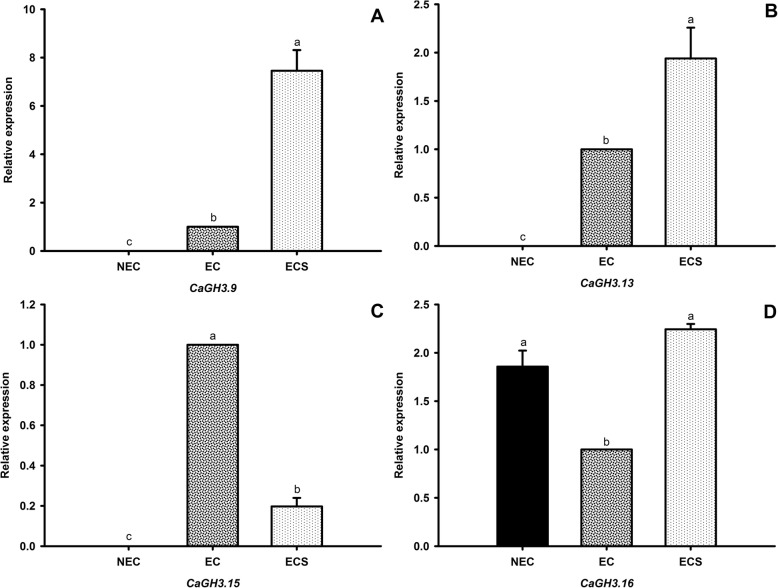
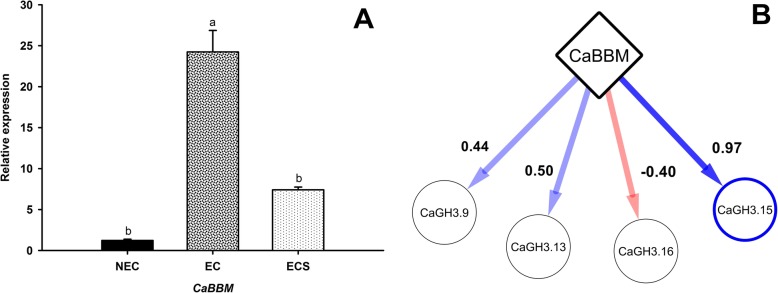
Results: We have searched within the published C. canephora genome and found 17 GH3 family members. We checked the conserved domains for GH3 proteins and clustered the members in three main groups according to phylogenetic relationships. We identified amino acids sets in four GH3 proteins that are related to acidic amino acid conjugation to auxin, and using a transcription factor (TF) network approach followed by RT-qPCR we analyzed their possible transcriptional regulators and expression profiles in cells with contrasting embryogenic potential in C. arabica. The CaGH3.15 expression pattern is the most correlated with embryogenic potential and with CaBBM, a C. arabica ortholog of a major somatic embryogenesis regulator.
Conclusion: Therefore, one out of the GH3 members may be influencing on coffee somatic embryogenesis by auxin conjugation with acidic amino acids, which leads to the phytohormone degradation. It is an indicative that this gene can serve as a molecular marker for coffee cells with embryogenic potential and needs to be further studied on how much determinant it is for this process. This work, together with future studies, can support the improvement of coffee clonal propagation through in vitro derived somatic embryos.
Keywords: Auxin homeostasis; Baby Boom; Coffee clonal propagation; Gretchen Hagen 3; Phylogenetics.
Conflict of interest statement
The authors declare that they have no competing interests.
Figures
References
-
- International Coffee Organization: Total production by all exporting countries. http://www.ico.org/prices/po-production.pdf (2018). Accessed 25 Feb 2019.
-
- Georget F, Courtel P, Garcia EM, Hidalgo M, Alpizar E, Breitler JC, Bertrand B, Etienne H. Somatic embryogenesis-derived coffee plantlets can be efficiently propagated by horticultural rooted mini-cuttings: a boost for somatic embryogenesis. Sci Hort. 2017;216:177–185. doi: 10.1016/j.scienta.2016.12.017. - DOI
-
- Etienne H, Bertrand B, Dechamp E, Maurel P, Geroget F, Guyot R, Breitler JC. Are genetics and epigenetic instabilities of plant embryogenic cells a fatality? The experience of coffee somatic embryogenesis. Human Genet Embryol. 2016;6:136. doi: 10.4172/2161-0436.1000136. - DOI
MeSH terms
Substances
LinkOut - more resources
Full Text Sources
Miscellaneous
