. 2019 Nov 6;20(1):815.
doi: 10.1186/s12864-019-6147-6.

The role of nitric oxide during embryonic wound healing

Affiliations

The role of nitric oxide during embryonic wound healing

Pavel Abaffy et al. BMC Genomics. .

Abstract

Background: The study of the mechanisms controlling wound healing is an attractive area within the field of biology, with it having a potentially significant impact on the health sector given the current medical burden associated with healing in the elderly population. Healing is a complex process and includes many steps that are regulated by coding and noncoding RNAs, proteins and other molecules. Nitric oxide (NO) is one of these small molecule regulators and its function has already been associated with inflammation and angiogenesis during adult healing.

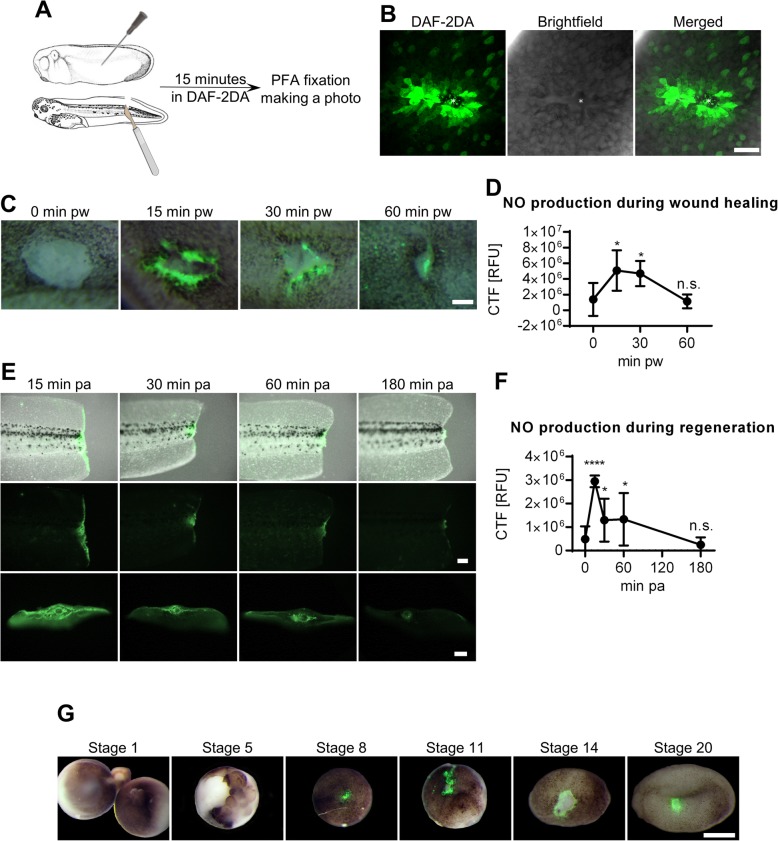
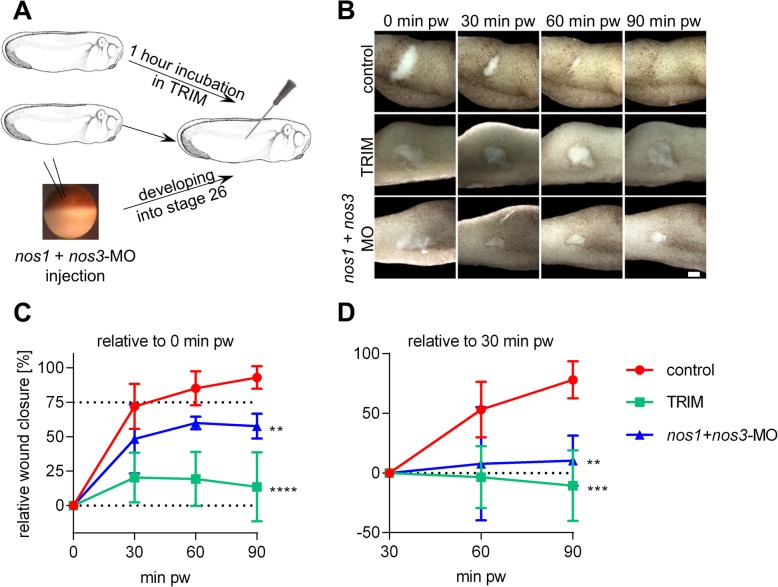
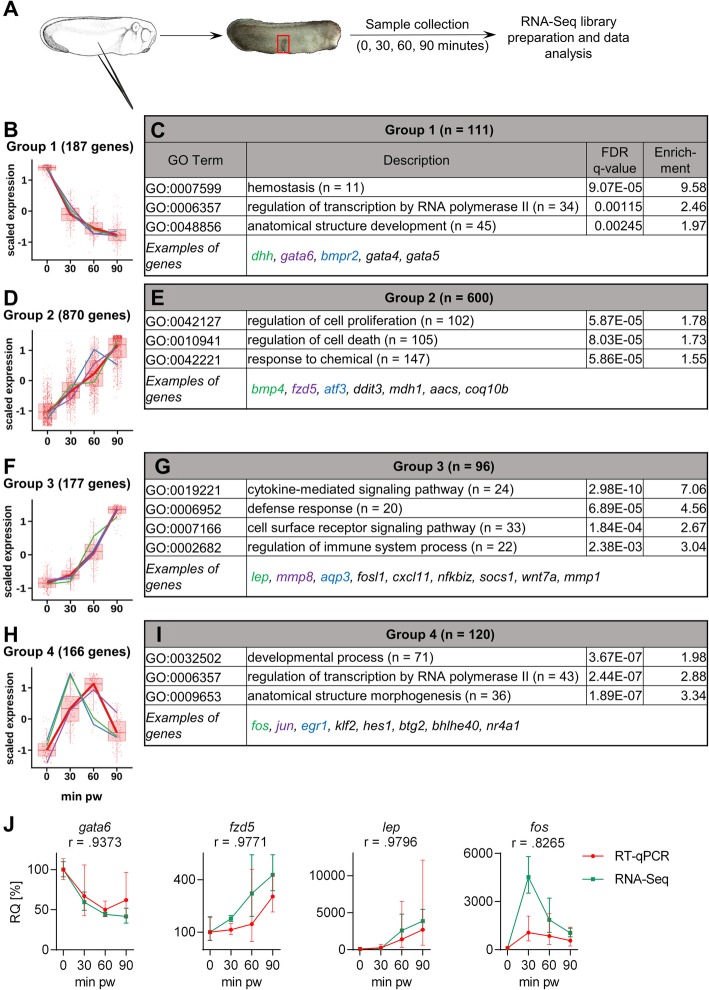
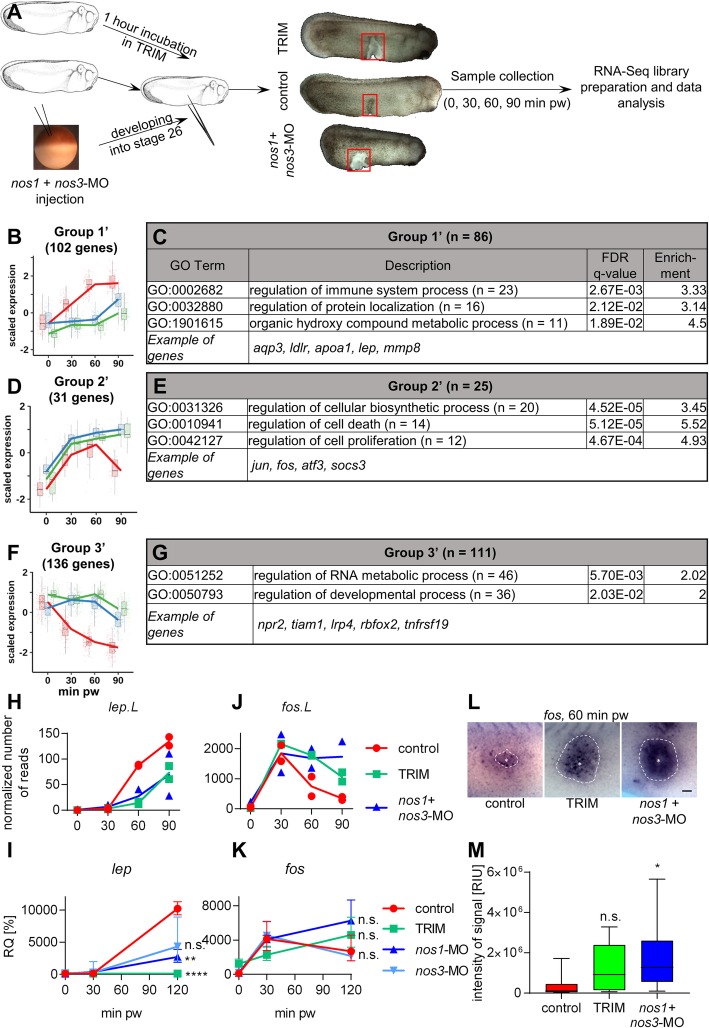
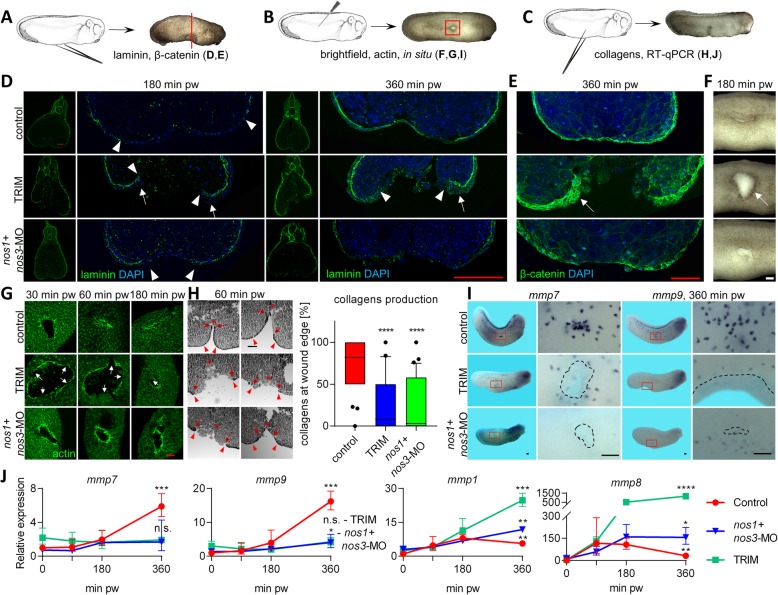
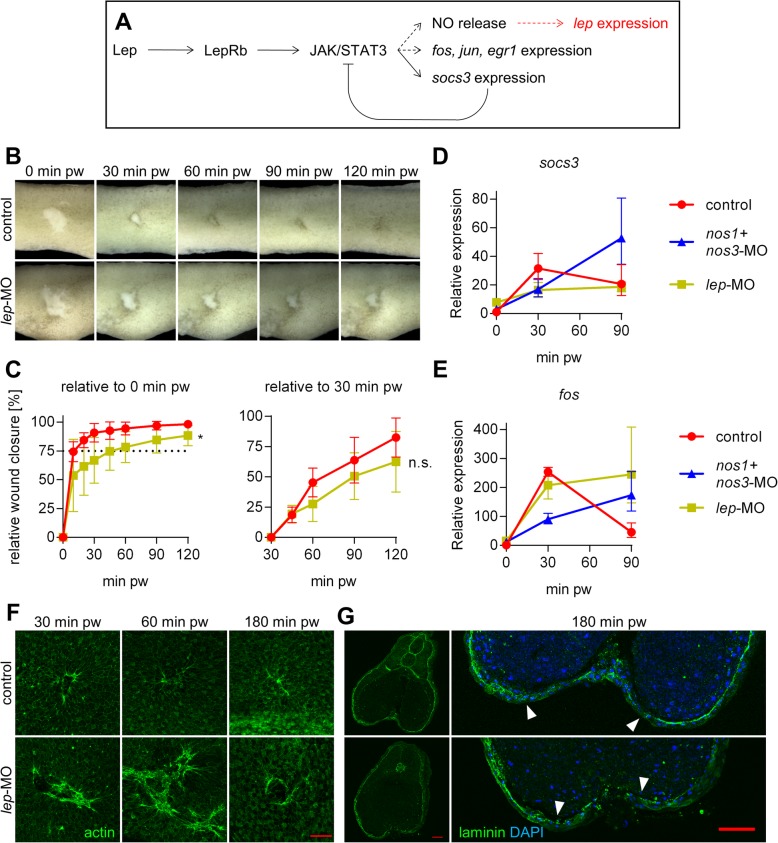
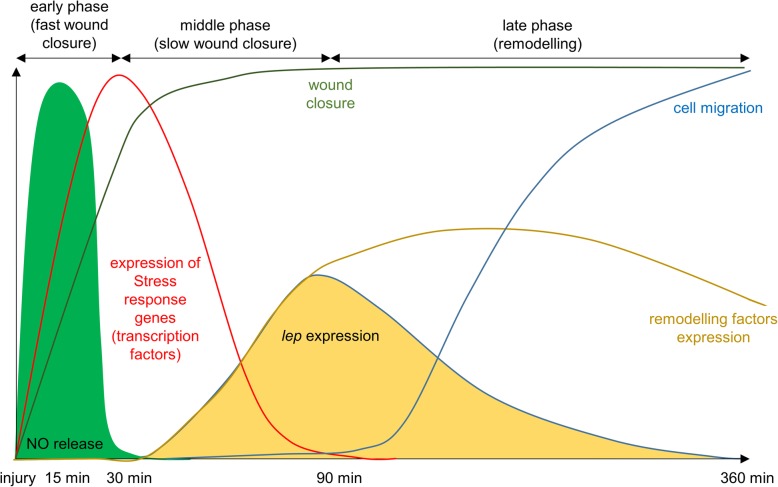
Results: Our results showed that NO is also an essential component during embryonic scarless healing and acts via a previously unknown mechanism. NO is mainly produced during the early phase of healing and it is crucial for the expression of genes associated with healing. However, we also observed a late phase of healing, which occurs for several hours after wound closure and takes place under the epidermis and includes tissue remodelling that is dependent on NO. We also found that the NO is associated with multiple cellular metabolic pathways, in particularly the glucose metabolism pathway. This is particular noteworthy as the use of NO donors have already been found to be beneficial for the treatment of chronic healing defects (including those associated with diabetes) and it is possible that its mechanism of action follows those observed during embryonic wound healing.

Conclusions: Our study describes a new role of NO during healing, which may potentially translate to improved therapeutic treatments, especially for individual suffering with problematic healing.

Keywords: AP-1; Leptin; Nitric oxide; RNA-sequencing; Transcriptome; Wound healing; Xenopus laevis.


Conflict of interest statement

The authors declare that they have no competing interests.

Figures

Fig. 1
Fig. 1
Production of NO during wound healing and regeneration. (a) Control embryos at stage 26 were injured using a needle, or tails of tadpoles at stage 41 were amputated and incubated in media with DAF-2DA solution for 15 minutes, fixed and imaged. (b) NO is produced in the first two layers of cells around wound edge (Scale bar = 20 μm). (c, d) NO is produced mainly during first 15 minutes after injury in embryos at stage 26 (Scale bar = 100 μm, five replicates, mean with standard deviation, One-way ANOVA Dunnett’s multiple comparisons test) (e, f) and after amputation in embryos at stage 41. (Scale bars = 200 μm, three replicates, mean with standard deviation, One-way ANOVA Dunnett’s multiple comparisons test) (g) NO is not produced after injury at stage 1 and stage 5, but NO is produced after injury at stage 8 (blastula), stage 11 (gastrula), stage 14 (early neurula) and stage 20 (late neurula) (Scale bar = 500 μm). CTF – corrected total fluorescence, RFU – relative fluorescent unit, pw – post wounding, pa – post amputation **** - p < .0001, * - p < .05, n.s. - p > .05
Fig. 2
Fig. 2
Monitoring of wound closing after inhibition of NO production. (a) Control embryos, embryos with inhibited production of NO using TRIM 1 hour before injury and embryos injected with the mixture of nos1 + nos3- MO were injured using a needle (stage 26). (b) Wound closing was documented using brightfield imaging on stereomicroscope (Scale bar = 100 μm). (c) Relative wound closure was calculated as ratio between the size of the wound in 0 minutes (d) or 30 minutes pw (at least three replicates per condition, mean with standard deviation, the statistical difference between the groups is derived from two linear mixed models). pw – post wounding **** - p < .0001, *** - p < .001, ** - p < .01
Fig. 3
Fig. 3
Global gene expression profiles during embryonic wound healing. (a) Control embryos at stage 26 were injured using forceps and healing tissues were dissected (only the part marked by red rectangle) and collected for RNA-Seq analysis. (b-i) DEGs were grouped based on their expression profile relatively to 0 minutes and GO analysis was performed. (b, d, f, h) Expression profiles of genes are representative of the log transformed data, average gene expression is shown in red and expression of three representative genes are shown in green, purple and blue. (c, e, g, i) Genes, which have an annotation and human homolog, were used for GO analysis. Numbers of analysed genes are in the table together with the representative GO terms for each group. (j) Validation of RNA-Seq data by RT-qPCR using representative genes from each Group was performed using RT-qPCR and the Pearson r correlation coefficient was calculated from the geometric mean values. (RNA-Seq – three replicates, RT-qPCR – six replicates, geometric mean with geometric standard deviation). DEGs – differentially expressed genes, pw – post wounding
Fig. 4
Fig. 4
Changes in gene expression during wound healing after inhibition of NO production. (a) Graphical description of RNA-Seq experiment comparing control and NO inhibited embryonic wound healing. Only the part marked by red rectangle was collected and used for RNA isolation and sequencing. (b-g) DEGs, which were identified in RNA-Seq, were grouped based on their expression profile relatively to 0 minutes and GO analysis was performed. (b, d, f) Expression profiles of genes are representative of the z-score of the regularized log transformation of the normalized counts. (c, e, g) Genes with annotation and human homolog were used for GO analysis. Numbers of analysed genes are in the table together with the representative GO terms for each group. (h) RNA-Seq result of lep expression was verified (i) using RT-qPCR, separately for nos1-MO and nos3-MO. (j) Similarly, RNA-Seq result of fos expression was verified using (k) RT-qPCR (data are normalized to 0 minutes pw in controls, three replicates, geometric mean with geometric standard deviation, two-sided t-test from log2 values of relative expression between inhibited samples and control in 120 minutes pw), and (l) in situ hybridization. Site of injury is marked with a star and the signal where fos is expressed is circled by dot line (Scale bar = 100 μm) (M) Intensity of blue signal around site of injury were measured (one-way Anova, Dunnett’s multiple comparisons test, minimum 8 replicates). **** - p < .0001, ** - p < .01, * - p < .05, n.s. - p > .05 DEGs – differentially expressed genes, pw – post wounding, RIU – relative intensity unit
Fig. 5
Fig. 5
Monitoring of phenotype changes during wound healing in embryos with inhibited NO production. (a, b, c) Control embryos, embryos with inhibited production of NO using TRIM 1 hour before injury and embryos injected with mixture of nos1 + nos3- MO were injured at stage 26 using forceps or needle in the middle and ventral side. (d) Laminin layer was visualized at 180 minutes and 360 minutes pw and ends of the laminin layer are marked by a triangle. Formation of “blob” in TRIM embryos is marked by arrow (Scale bar = 100 μm). (e) Staining of β- catenin 360 minutes pw (Scale bar = 100 μm). (f) Brightfiled image of wound site in 180 minutes pw (Scale bar = 100 μm). (b, g) Actin at 30, 60 and 180 minutes pw visualized using green fluorescent phalloidin. Breaks in actin layer are marked by arrow (Scale bar = 100 μm). (c, h) Collagen staining at 60 minutes pw. The beginning of the wound is marked by a red triangle. A red arrow marks the end of the collagen layer, while the end of the wound site is marked by a red star. (Scale bar = 100 μm, measurement of coverage of collagen in wound was made from at least six embryos per condition and at least five slices per embryo, one-way anova, Dunnett’s multiple comparisons test). (i) Spatial expression of two matrix metalloproteinases mmp7 and mmp9 was visualized by in situ hybridization in time 360 minutes pw (Scale bars = 500 μm). (j) RT-qPCR comparison of temporal expression profiles of mmp1, mmp8, mmp7 and mmp9 (data are normalized to 0 minutes pw in controls, three replicates, geometric mean with geometric standard deviation, two-sided ttest from log2 values of relative expression between 360 minutes and 0 minutes). **** - p < .0001, *** - p < .001, ** - p < .01, n.s. - > .05 pw – post wounding
Fig. 6
Fig. 6
Monitoring of processes during wound healing after inhibition of lep expression. (a) In general, Lep is described as an activator of NO release, but inhibition of NO production leads to decreased expression of lep during wound healing. (b) Wound closing was documented using brightfield imaging on stereomicroscope. (c) Relative wound closure was calculated as the ratio between the size of the wound at 0 minute pw and 30 minutes pw (at least four replicates per condition, mean with standard deviation, the statistical difference between the groups is derived from two linear mixed models). (d) RT-qPCR comparison of temporal expression profiles of socs3 and (e) fos (data are normalized to 0 minutes pw in controls, three replicates, geometric mean with geometric standard deviation). (f) Actin at 30, 60 and 180 minutes pw visualized using green fluorescent phalloidin (Scale bar = 100 μm). (g) Laminin layer was visualized at 180 minutes pw and ends of the laminin layer are marked by a triangle (Scale bar = 100 μm). * - p < .05, n.s. – p > .05 pw – post wounding
Fig. 7
Fig. 7
Interpretation of our results – description of processes during embryonic wound healing. NO release appears very early after injury. The level of NO is the highest at 15 minutes pw and the physiological level is restored at 30 minutes pw (early phase of healing). De novo expression of injury response genes starts shortly after injury and the level of expression is the highest 30 minutes pw. Level of expression of injury response genes is restored to physiological level 90 minutes pw. De novo expression of interesting NO dependent candidate lep and remodelling factors starts around 30 minutes pw. At the same time around 80 % of injury is already closed (middle phase of healing). The injury is closed 90 minutes pw and remodelling phase is initiated. Cell migration appears and the expression of remodelling factors changes (late phase of healing)

References

    1. Kim DJ, Mustoe T, Clark RA. Cutaneous wound healing in aging small mammals: a systematic review. Wound Repair Regen. 2015;23(3):318–339. doi: 10.1111/wrr.12290. - DOI - PubMed
    1. Guo S, Dipietro LA. Factors affecting wound healing. J Dent Res. 2010;89(3):219–229. doi: 10.1177/0022034509359125. - DOI - PMC - PubMed
    1. Gupta MA, Pur DR, Vujcic B, Gupta AK. Suicidal behaviors in the dermatology patient. Clin Dermatol. 2017;35(3):302–311. doi: 10.1016/j.clindermatol.2017.01.006. - DOI - PubMed
    1. Sonnemann KJ, Bement WM. Wound repair: toward understanding and integration of single-cell and multicellular wound responses. Annu Rev Cell Dev Biol. 2011;27:237–263. doi: 10.1146/annurev-cellbio-092910-154251. - DOI - PMC - PubMed
    1. Thiruvoth F, Mohapatra D, Sivakumar D, Chittoria R, Nandhagopal V. Current concepts in the physiology of adult wound healing. Plastic and Aesthetic Research. 2015;2(5):250–256. doi: 10.4103/2347-9264.158851. - DOI