. 2019 Nov 7;11(1):68.
doi: 10.1186/s13073-019-0675-1.

From cytogenetics to cytogenomics: whole-genome sequencing as a first-line test comprehensively captures the diverse spectrum of disease-causing genetic variation underlying intellectual disability

Affiliations

From cytogenetics to cytogenomics: whole-genome sequencing as a first-line test comprehensively captures the diverse spectrum of disease-causing genetic variation underlying intellectual disability

Anna Lindstrand et al. Genome Med. .

Abstract

Background: Since different types of genetic variants, from single nucleotide variants (SNVs) to large chromosomal rearrangements, underlie intellectual disability, we evaluated the use of whole-genome sequencing (WGS) rather than chromosomal microarray analysis (CMA) as a first-line genetic diagnostic test.

Methods: We analyzed three cohorts with short-read WGS: (i) a retrospective cohort with validated copy number variants (CNVs) (cohort 1, n = 68), (ii) individuals referred for monogenic multi-gene panels (cohort 2, n = 156), and (iii) 100 prospective, consecutive cases referred to our center for CMA (cohort 3). Bioinformatic tools developed include FindSV, SVDB, Rhocall, Rhoviz, and vcf2cytosure.

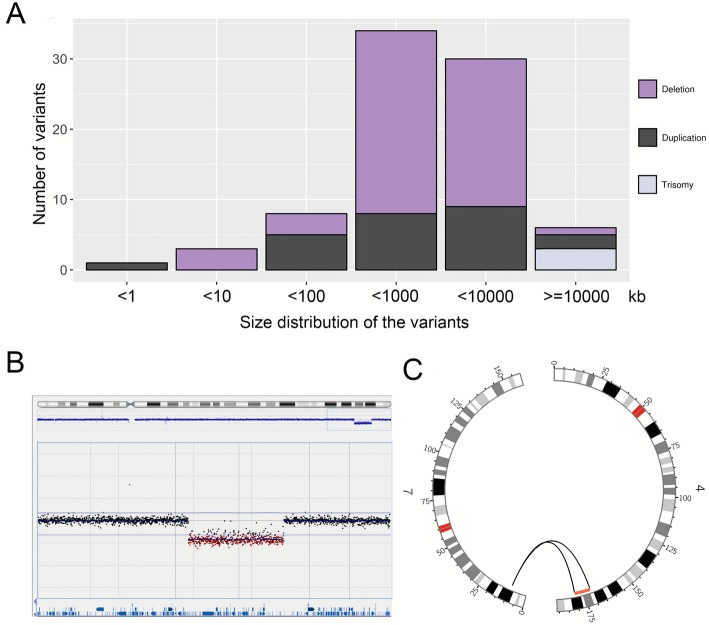
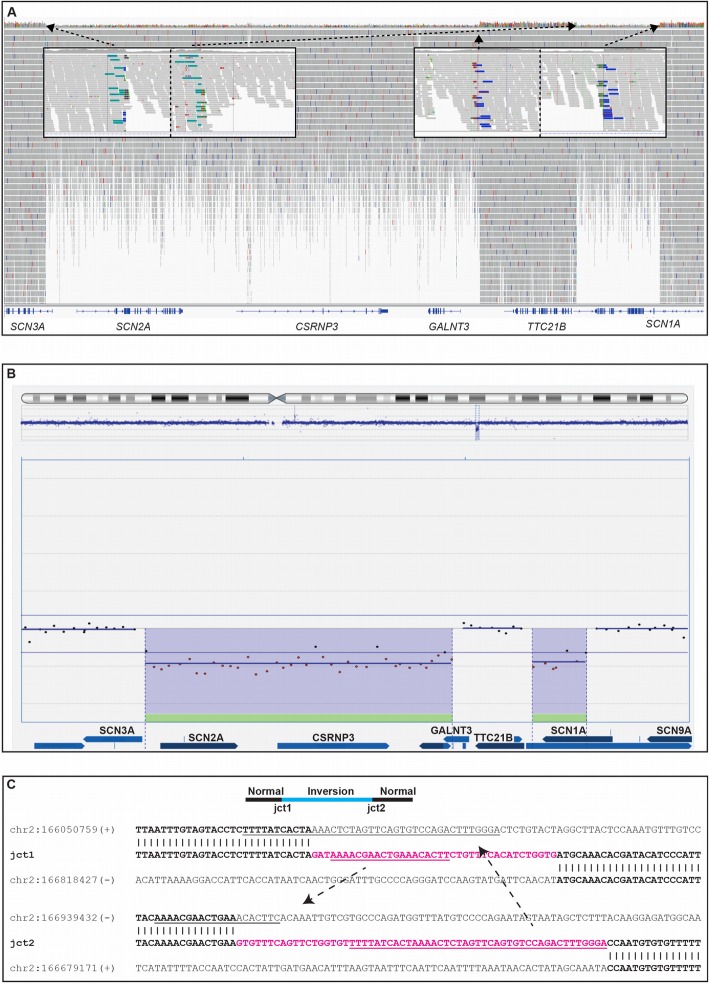
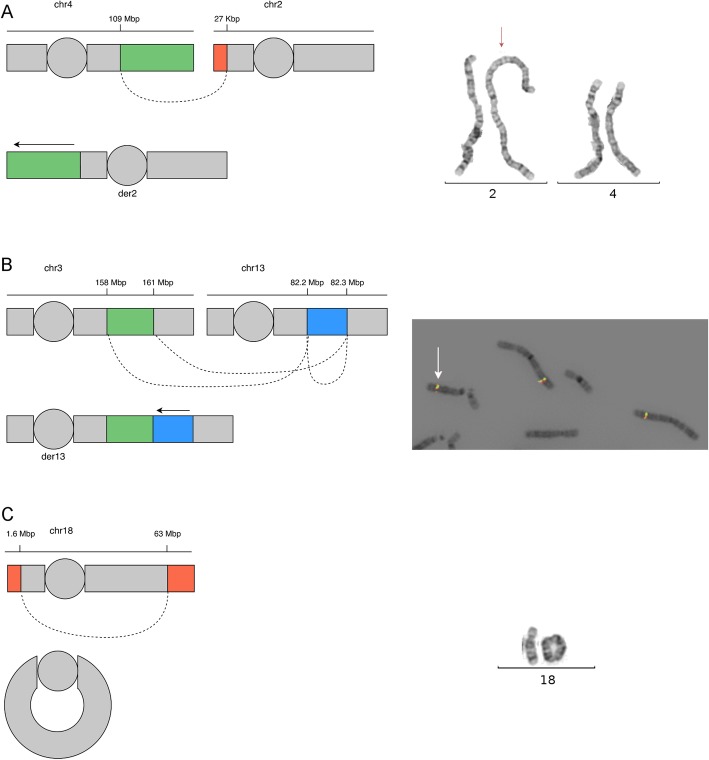
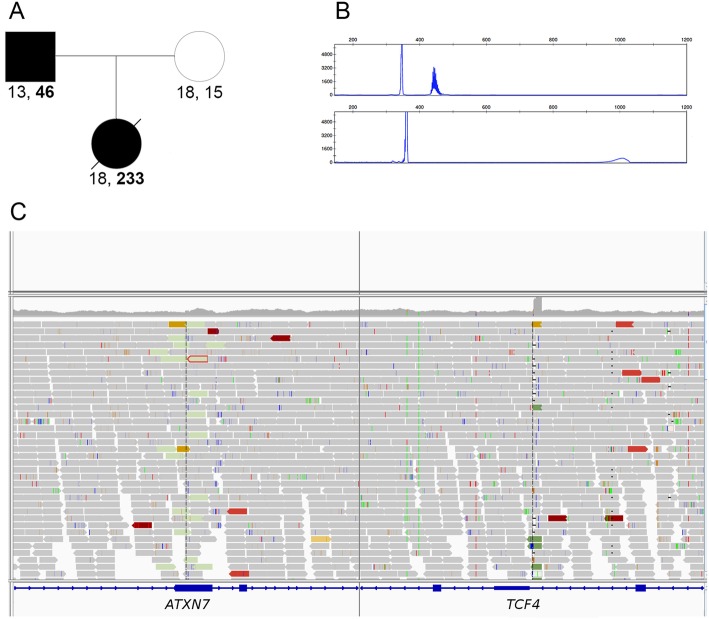
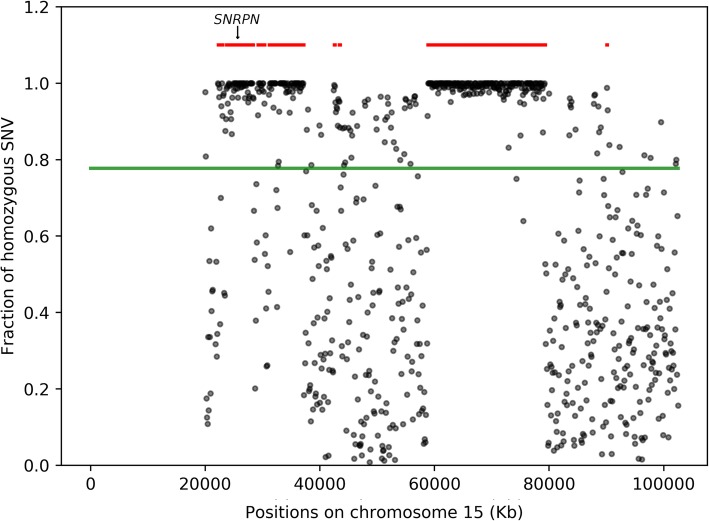
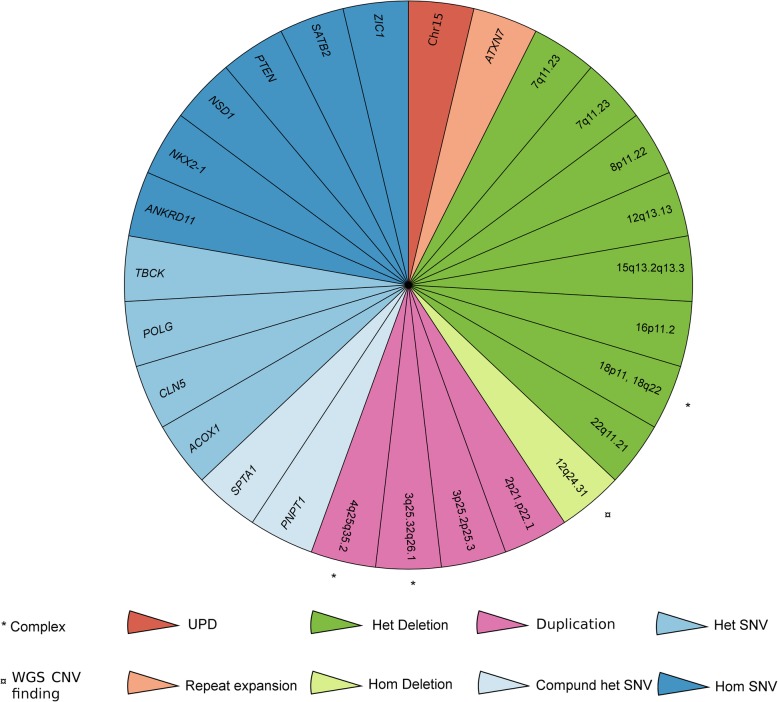
Results: First, we validated our structural variant (SV)-calling pipeline on cohort 1, consisting of three trisomies and 79 deletions and duplications with a median size of 850 kb (min 500 bp, max 155 Mb). All variants were detected. Second, we utilized the same pipeline in cohort 2 and analyzed with monogenic WGS panels, increasing the diagnostic yield to 8%. Next, cohort 3 was analyzed by both CMA and WGS. The WGS data was processed for large (> 10 kb) SVs genome-wide and for exonic SVs and SNVs in a panel of 887 genes linked to intellectual disability as well as genes matched to patient-specific Human Phenotype Ontology (HPO) phenotypes. This yielded a total of 25 pathogenic variants (SNVs or SVs), of which 12 were detected by CMA as well. We also applied short tandem repeat (STR) expansion detection and discovered one pathologic expansion in ATXN7. Finally, a case of Prader-Willi syndrome with uniparental disomy (UPD) was validated in the WGS data. Important positional information was obtained in all cohorts. Remarkably, 7% of the analyzed cases harbored complex structural variants, as exemplified by a ring chromosome and two duplications found to be an insertional translocation and part of a cryptic unbalanced translocation, respectively.

Conclusion: The overall diagnostic rate of 27% was more than doubled compared to clinical microarray (12%). Using WGS, we detected a wide range of SVs with high accuracy. Since the WGS data also allowed for analysis of SNVs, UPD, and STRs, it represents a powerful comprehensive genetic test in a clinical diagnostic laboratory setting.

Keywords: Copy number variation; Intellectual disability; Monogenic disease; Repeat expansion; Single nucleotide variant; Structural variation; Uniparental disomy; Whole-genome sequencing.


Conflict of interest statement

The authors declare that they have no competing interests.

Figures

Fig. 1
Fig. 1
Overview of CNVs and affected individuals included in the validation cohort. a Bar graph showing the size distribution of 79 validated CNVs and three trisomies that were detected with WGS. Deletions are shown in purple, duplications in black, and trisomies in lilac. b Array comparative genomic hybridization plot indicates a heterozygous deletion of 9.3 Mb in individual RD_P77. c Circos plot illustrating the WGS results in the same individual. Discordant read pairs between chromosomes 4 and 7 are shown as gray lines, and the deletion is shown in red
Fig. 2
Fig. 2
A complex DEL-INV-DEL rearrangement identified by WGS causes severe epilepsy. a Screenshot of the deletions and inversion from the Integrative Genomics Viewer (IGV) in individual RD_P393. Short-read whole-genome sequencing (WGS) detected two clustered deletions of 630 kb (SCN3A, SCN2A, CSRNP3, GALNT3) and 121 kb (SCN1A), respectively. The genomic segment of normal copy number state in-between the deletions (139 kb, TTC21B) had been inverted. Both inversion breakpoint junctions are shown with the green and blue bars corresponding to discordant reads with mates located on the other side of the inversion. b Screenshot of DEL-INV-DEL rearrangement confirmed by array comparative genomic hybridization (array-CGH). Screenshot from the Cytosure Interpret Software. The deletions in the rearrangement were confirmed using array-CGH. c Breakpoint junction sequences. Sequence analysis of the breakpoint junctions revealed insertions in both junctions of 38 bp and 59 bp, respectively (pink). Substantial parts of the insertions had been templated from sequences involved in the rearrangement (underlined), suggestive of a replicative error as the underlying mechanism of formation. L1 repetitive elements were present in two of the breakpoints but did not form any fusion L1 elements. Lowercase letters indicate deleted sequences
Fig. 3
Fig. 3
Three cases with complex genomic rearrangements resolved by WGS. a A schematic drawing of the 4q25q35.2 unbalanced translocation in individual RD_P406. The duplicated segment of 81 kb (green) is inserted into the p-arm of chromosome 2 directly before the telomeric sequences. A 27-kb deletion on chromosome 2 (orange) is visible in the WGS data. The dashed line represents the links from chromosome 4 to chromosome 2. To the right, the insertional duplication rearrangement is shown through karyotyping with the derivative chromosome 2 indicated by a red arrow. b A schematic drawing of the 3q25.32q26.1 insertional duplication in individual RD_P405 as in a. The duplicated segment of 2.23 Mb is inserted into chromosome 13, and a genomic segment of 69.6 kb on chromosome 13, adjacent to the insertion, has been inverted. To the right, FISH analysis using probes RP11-209H21SG (green) and RP11-203L15SO (red) located within the rearranged region on chromosome 3. In addition to two signals from chr 3q25.32q26.1, an extra signal is present on chromosome 13 (white arrow) verifying the location of the duplicated segment. c A schematic drawing of the r(18) present in individual RD_P414 as in a. To the right, the ring chromosome is shown through karyotyping
Fig. 4
Fig. 4
A short tandem repeat expansion in ATXN7 is identified by WGS. a The pedigree and number of ATXN7 CAG repeats are illustrated under each individual. b The PCR-amplified CAG-repeat data from the father shows one normal sized allele and one expanded allele (top chromatogram). In the bottom chromatogram, the results from the affected child are shown. c Integrative Genomics Viewer (IGV) screenshot of the data obtained from FindSV shows the first indication of an ATXN7 abnormality. The aberrant signal was initially interpreted by the program as an insertion of sequence from chromosome 18 (right) into ATXN7 (left)
Fig. 5
Fig. 5
Prader-Willi syndrome caused by maternal isodisomy. Homozygosity for SNPs on chromosome 15 from WGS data in individual RD_P432. The fraction of homozygous SNPs is shown on the Y axis and the position on chromosome 15 on the X axis. The position of SNRPN is indicated with an arrow. Each gray dot represents the fraction of homozygous SNVs in 10 kb regions. The green line indicates the fraction of homozygous SNV across the entire chromosome, and red lines indicate autozygous regions predicted by rhocall
Fig. 6
Fig. 6
Genetic architecture of a mixed cohort referred for diagnostic analysis. Each slice of the pie chart represents one individual in the 100 prospective cases analyzed by both chromosomal microarray (CMA) and whole-genome sequencing (WGS) where a causal genetic variant was identified. Type of variants is indicated by colors (UPD, red; repeat expansion, orange; homozygous deletion, light green; heterozygous deletion, dark green; duplication, purple; compound heterozygous SNV, light blue; homozygous SNV, blue; heterozygous SNV, dark blue). Additional complexity is indicated by a * and CNVs detected by WGS first with a ¤

References

    1. Boycott KM, Rath A, Chong JX, Hartley T, Alkuraya FS, Baynam G, et al. International cooperation to enable the diagnosis of all rare genetic diseases. Am J Hum Genet. 2017;100(5):695–705. doi: 10.1016/j.ajhg.2017.04.003. - DOI - PMC - PubMed
    1. Genomes Project C, Abecasis GR, Auton A, Brooks LD, DePristo MA, Durbin RM, et al. An integrated map of genetic variation from 1,092 human genomes. Nature. 2012;491(7422):56–65. doi: 10.1038/nature11632. - DOI - PMC - PubMed
    1. Mills RE, Walter K, Stewart C, Handsaker RE, Chen K, Alkan C, et al. Mapping copy number variation by population-scale genome sequencing. Nature. 2011;470(7332):59–65. doi: 10.1038/nature09708. - DOI - PMC - PubMed
    1. Feuk L, Carson AR, Scherer SW. Structural variation in the human genome. Nat Rev Genet. 2006;7(2):85–97. doi: 10.1038/nrg1767. - DOI - PubMed
    1. Maretty L, Jensen JM, Petersen B, Sibbesen JA, Liu S, Villesen P, et al. Sequencing and de novo assembly of 150 genomes from Denmark as a population reference. Nature. 2017;548(7665):87–91. doi: 10.1038/nature23264. - DOI - PubMed

Publication types

Substances

LinkOut - more resources