. 2020 Jan;182(1):518-533.
doi: 10.1104/pp.19.00212. Epub 2019 Nov 6.

E2FB Interacts with RETINOBLASTOMA RELATED and Regulates Cell Proliferation during Leaf Development

Affiliations

E2FB Interacts with RETINOBLASTOMA RELATED and Regulates Cell Proliferation during Leaf Development

Erika Őszi et al. Plant Physiol. 2020 Jan.

Abstract

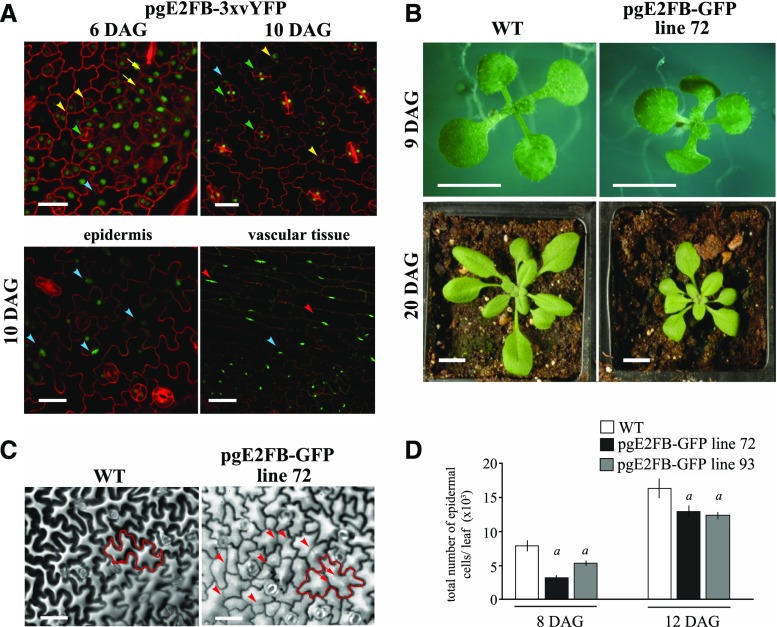
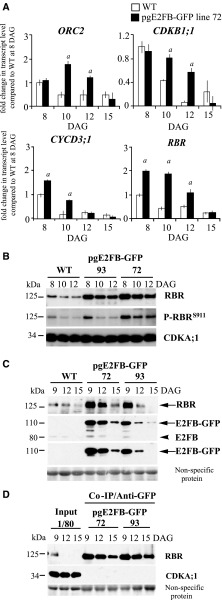
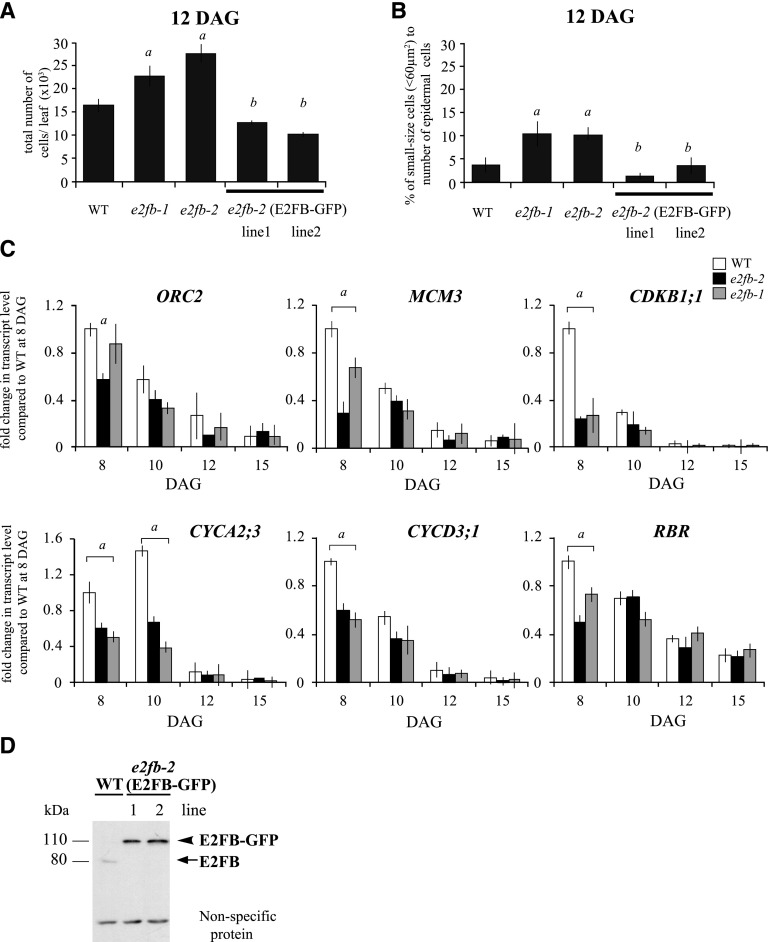
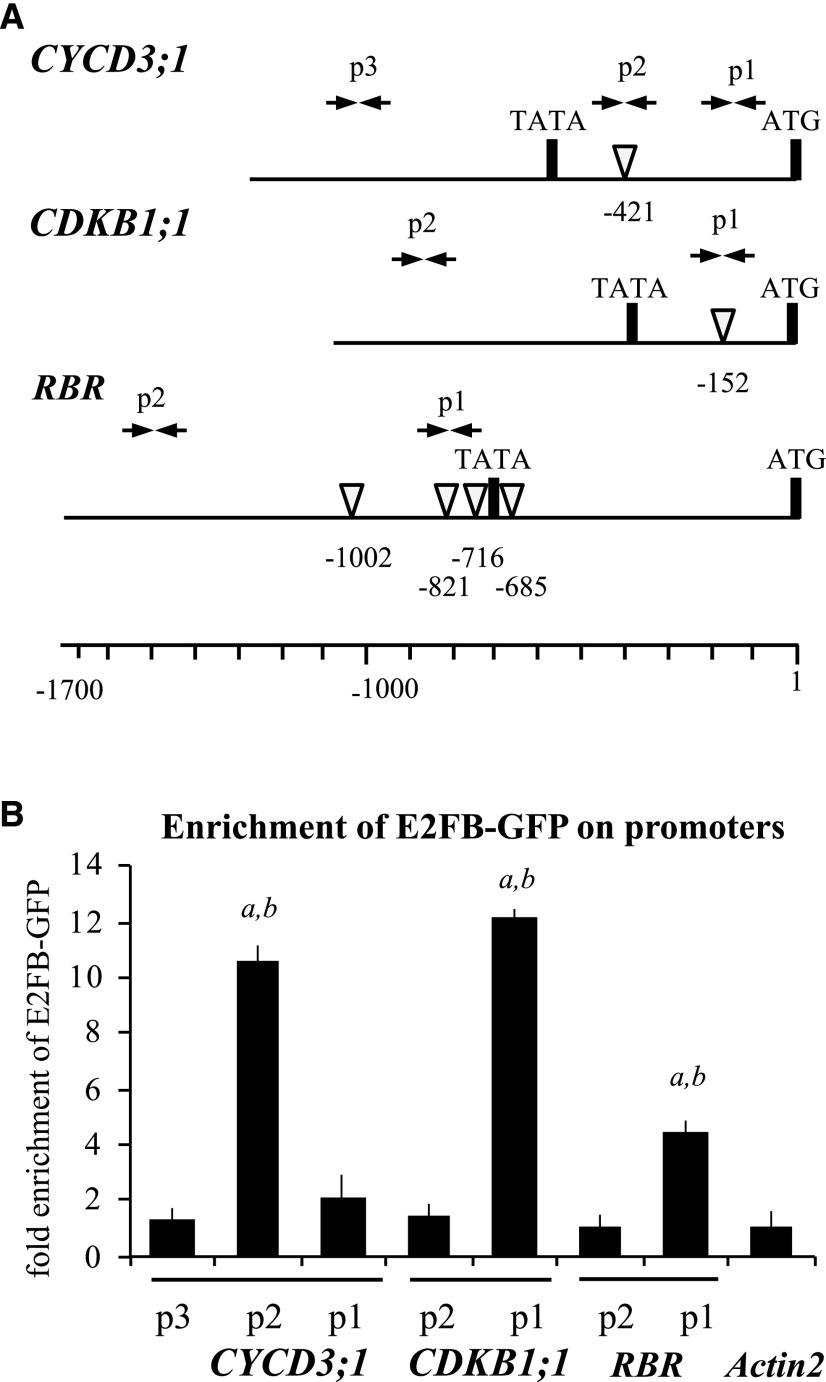
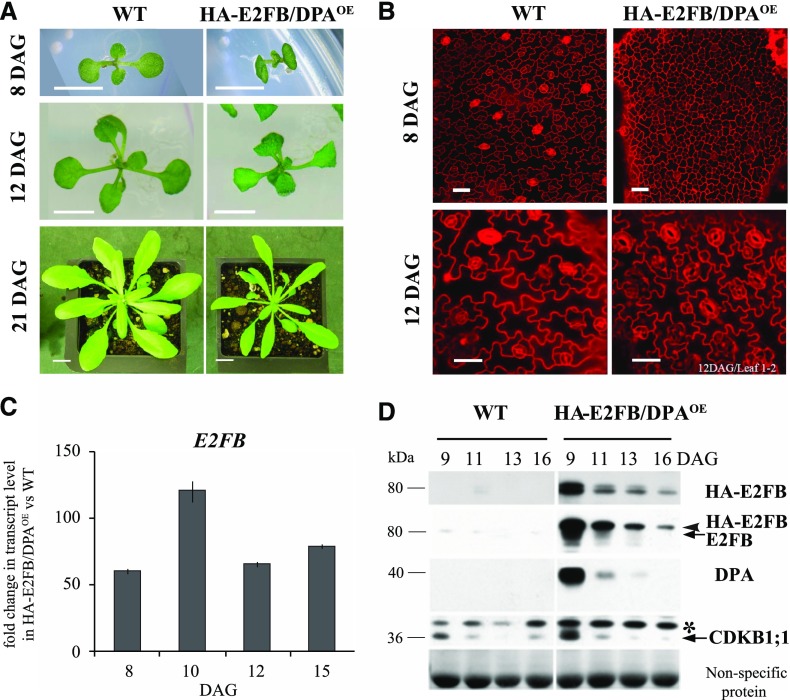
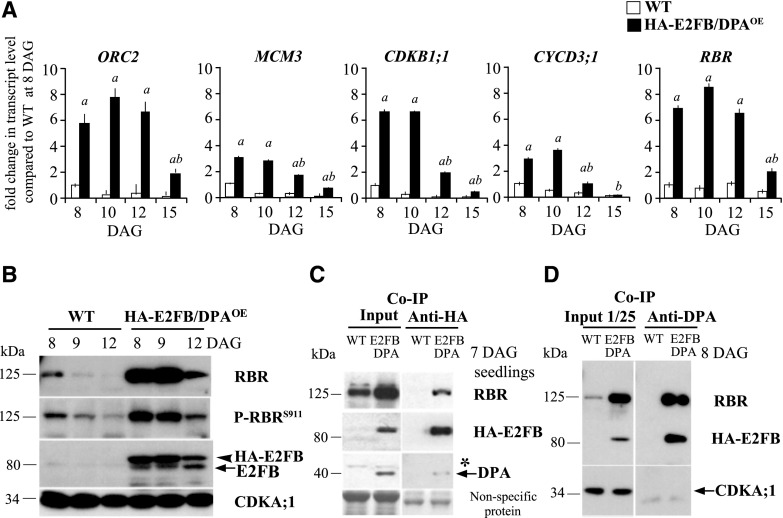
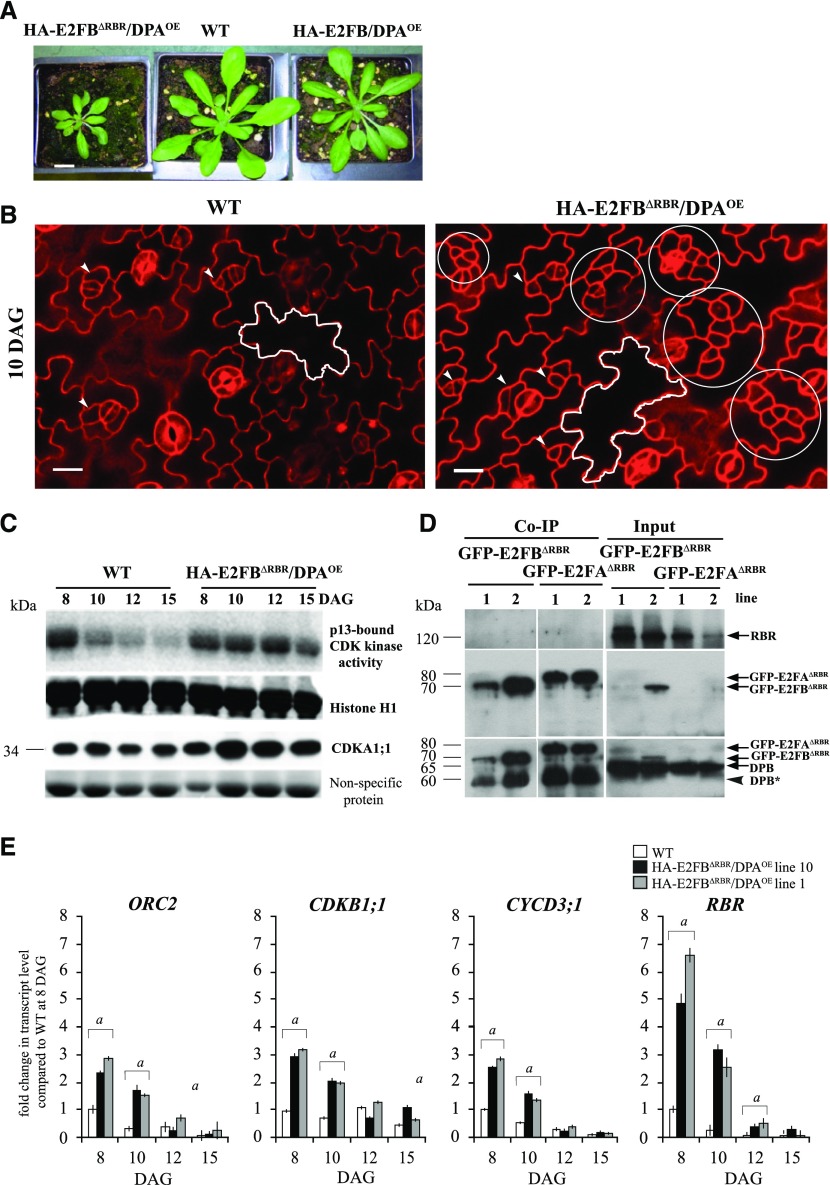
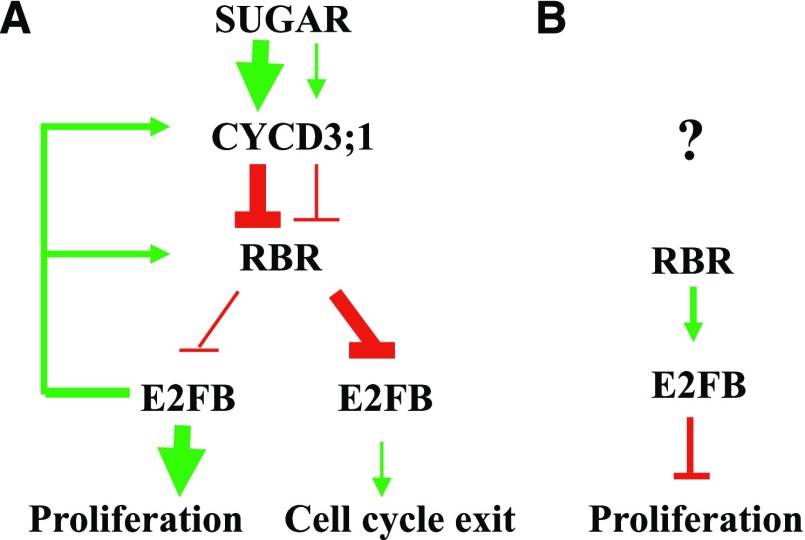
Cell cycle entry and quiescence are regulated by the E2F transcription factors in association with RETINOBLASTOMA-RELATED (RBR). E2FB is considered to be a transcriptional activator of cell cycle genes, but its function during development remains poorly understood. Here, by studying E2FB-RBR interaction, E2F target gene expression, and epidermal cell number and shape in e2fb mutant and overexpression lines during leaf development in Arabidopsis (Arabidopsis thaliana), we show that E2FB in association with RBR plays a role in the inhibition of cell proliferation to establish quiescence. In young leaves, both RBR and E2FB are abundant and form a repressor complex that is reinforced by an autoregulatory loop. Increased E2FB levels, either by expression driven by its own promoter or ectopically together with DIMERIZATION PARTNER A, further elevate the amount of this repressor complex, leading to reduced leaf cell number. Cell overproliferation in e2fb mutants and in plants overexpressing a truncated form of E2FB lacking the RBR binding domain strongly suggested that RBR repression specifically acts through E2FB. The increased number of small cells below the guard cells and of fully developed stomata indicated that meristemoids preferentially hyperproliferate. As leaf development progresses and cells differentiate, the amount of RBR and E2FB gradually declined. At this stage, elevation of E2FB level can overcome RBR repression, leading to reactivation of cell division in pavement cells. In summary, E2FB in association with RBR is central to regulating cell proliferation during organ development to determine final leaf cell number.


Figures

Figure 1.
Figure 1.
Elevated E2FB level in its own expression domain inhibits cell proliferation in young leaves and disturbs quiescence in older leaves. A, Representative confocal laser scanning microscopy images of the abaxial leaf surface from the first leaf pair of the transgenic line pgE2FB-3×vYFP at 6 and 10 DAG (top), and localization in the epidermis and vascular tissues of the same transgenic line at 10 DAG (bottom). The YFP signal (green) is counterstained for cell membrane with PI (red). Yellow arrows point toward dividing protodermal cells, yellow arrowheads indicate stomatal meristemoids, green arrowheads label fully developed stomata guard cells, blue arrowheads mark elongated pavement cells, and red arrowheads show elongated vascular cells with GFP signal in their nucleus. Scale bars = 20 μm (top) and 25 μm (bottom). B, Images of the wild type (WT) and the transgenic line with high E2FB expression (pgE2FB-GFP line 72) grown for 9 DAG in vitro and for 20 DAG on soil. Scale bars = 0.5 cm. C, Representative images of the abaxial epidermal cell layer of the first leaf pair from wild-type and pgE2FB-GFP line 72 seedlings (12 DAG) taken by differential interference contrast microscopy, for which the imprints were made by the gel casting method. An example of an elongated puzzle-formed pavement cell is outlined in red (left). Arrows indicate straight cell walls inside the cell, whereas arrowheads mark newly formed cell walls inside the elongated pavement cells. Scale bars = 20 μm. D, Quantification of the total number of epidermal cells from the first leaf pair of the wild type and two pgE2FB-GFP transgenic lines (lines 72 and 93). Values represent means and error bars indicate the sd. Significance was determined by Student’s t test; a, P < 0.05. n = 3 and n > 600. The quantifications of cellular parameters are summarized in Supplemental Tables S1 and S2 from 8 and 12 DAG leaves, respectively. Data information, n = biological repeat, n = samples per biological repeat, here and in following figure legends.
Figure 2.
Figure 2.
RBR efficiently counteracts excess E2FB accumulation in proliferating, but not in differentiating, first leaf pairs. A, Relative expression levels of ORC2, CDKB1;1, CYCD3;1, and RBR in the wild type (WT) and pgE2FB-GFP line 72 from the developing first leaf pair of seedlings at 8, 10, 12, and 15 DAG. Values represent the mean of fold change normalized to the value of the relevant transcript of the wild type at 8 DAG, which was set arbitrarily at 1. Error bars indicate the sd. a, P < 0.05; statistical significance determined using Student’s t test between the wild type and the transgenic line at a given time point (n = 3, n > 50). Abbreviations of genes and primer sequences are listed in Supplemental Table S3. B, The phosphorylation level of RBR on the conserved Ser site at position 911 (P-RBRS911) was followed in the developing first leaf pairs of two independent pgE2FB-GFP-expressing lines (lines 93 and 72) with different E2FB protein levels and compared to the wild type at the indicated time points (DAG) using anti-RBR and P-RBRS911-specific antibody (anti-P-Rb807/811) in immunoblot analysis. C, To follow RBR accumulation in conjunction with E2FB level, anti-RBR, anti-E2FB, and anti-GFP antibodies were used in immunoblot analysis of proteins in the developing first leaf pairs in the same transgenic lines as in B. In the top set of blots, the antibody labels RBR (arrow); in the second set, the anti-E2FB antibody labels both the E2FB-GFP (arrow) and the endogenous E2FB (arrowhead); and in the third set, the anti-GFP antibody marks the accumulation of the E2FB-GFP fusion protein (arrow). D, Co-IP of RBR in the E2FB-GFP pull-down was labeled on the immunoblot with anti-RBR. On the same gel, 1/80 of the IP from the extract of the pgE2FB-GFP 72 line was loaded as input. For comparison, 1/20 of IP was loaded for all genotypes in C. Nonspecific membrane-bound proteins stained by Coomassie-blue were used as loading controls (C and D). Note: The relative intensities of the protein bands in B and C are quantified in Supplemental Figure S4, A and B (B) and C and D (C), and the measurements related to proteins in C and D are quantified in Supplemental Figure S4E.
Figure 3.
Figure 3.
E2FB restricts cell proliferation in developing first leaf pairs. A and B, Total cell number (A) and ratio of small-sized cells (<60 μm2; B) in the epidermis of the first leaf pairs from the wild type (WT), the e2fb-1 and e2fb-2 mutants, and the e2fb-2 mutant expressing E2FB-GFP under its own promoter (e2fb-2 E2FB-GFP lines 1 and 2) at 12 DAG (n = 3, n > 600). Error bars indicate the sd. a, P < 0.05, statistical significance determined using Student’s t test between the wild type and the two e2fb mutants; b, P < 0.05, statistical significance between the complemented lines and e2fb mutants. C, Comparison of the ORC2, MCM3, CDKB1;1, CYCA2;3, CYCD3;1, and RBR transcript levels in the first leaf pairs of seedlings of the e2fb-2 and e2fb-1 mutants and the wild type at 8, 10, 12, and 15 DAG. Values represent the mean of fold change normalized to the value of the relevant transcript of the wild type at 8 DAG, which was arbitrarily set at 1 (n = 3, n > 50). a, P < 0.05, statistical significance determined using Student’s t test between the wild type and the mutant lines. Error bars indicate the sd. Abbreviations of genes and primer sequences are listed in Supplemental Table S3. D, Endogenous E2FB and transgenic E2FB-GFP proteins were detected in 1-week-old seedlings from the wild type and the two complemented lines [e2fb-2 (E2FB-GFP) lines 1 and 2]. The arrow indicates the position of E2FB, and the arrowhead indicates E2FB-GFP. Nonspecific, cross-reacting proteins are used as loading control.
Figure 4.
Figure 4.
E2FB directly binds to CYCD3;1, CDKB1;1, and RBR promoters. A, Schematic representation of the CYCD3;1, CDKB1;1, and RBR promoters; arrow pairs labeled p1, p2, and p3 indicate the positions of the primer pairs used for qPCR analysis. The position of the canonical E2F elements (white arrowheads) and their distance from the start codon (ATG) are depicted. Primer sequences are listed in Supplemental Table S3. B, ChIP followed by qPCR was carried out on chromatin isolated from complemented e2fb-2 E2FB-GFP seedlings (7 DAG) using polyclonal antirabbit GFP antibody; the graph shows fold enrichment calculated as the ratio of chromatin bound to the numbered section of the CYCD3;1, CDKB1;1, and RBR promoters with or without antibody. Shown is a representative experiment with three biological replicates. a and b, P < 0.01, statistically significant enrichment between the relevant fragment and the neighboring fragments (a) and between the relevant regulatory region and the negative control (Actin2; b) determined by Student’s t test. The values represent the means of three technical replicates. Error bars indicate the sd. The enrichment on the Actin2 promoter was arbitrarily set to 1. The labels p1, p2, and p3 on the x axis refer to the regions indicated in A.
Figure 5.
Figure 5.
Co-overexpression of E2FB and DPA results in reduced leaf and cell size. A, Representative images of wild-type (WT) and p35S::HA-E2FB/DPAOE (HA-E2FB/DPAOE) seedlings grown in vitro (8 and 12 DAG) and on soil (21 DAG). Scale bars = 0.5 cm at 8 and 12 DAG and 1 cm at 21 DAG. B, Representative confocal microscopy images of PI-stained abaxial leaf surfaces taken from the tip to the base of the first leaf pairs from wild-type and HA-E2FB/DPAOE seedlings (8 and 12 DAG). Scale bars = 20 μm. C, Comparison of E2FB expression levels in the developing first leaf pairs of HA-E2FB/DPAOE and wild-type seedlings at 8, 10, 12, and 15 DAG, where the expression of E2FB was set arbitrarily at 1 at each time point. Values represent fold change. Error bars indicate the sd, referring to technical repeats. The data are from one biological replicate (n < 50), and the transcript level correlates well with the HA-E2FB protein accumulation illustrated in D. D, Detection of protein levels of epitope-tagged (HA-E2FB) and endogenous E2FB, DPA, and CDKB1;1 in the first leaf pairs of wild-type and HA-E2FB/DPAOE seedlings at the indicated time points (DAG) using anti-HA, anti-E2FB, anti-DPA, and anti-CDKB1;1 antibodies. The arrowhead indicates the position of HA-tagged E2FB, whereas arrows indicate endogenous E2FB and CDKB1;1 proteins. The asterisk indicates a nonspecific protein cross reaction with the anti-CDKB1;1 antibody. Nonspecific membrane-bound proteins stained by Coomassie-blue were used as loading control.
Figure 6.
Figure 6.
Ectopic E2FB/DPA functions as transcriptional activator on cell cycle genes. A, The expression levels of ORC2, MCM3, CDKB1;1, CYCD3;1, and RBR were determined in wild-type (WT) and HA-E2FB/DPAOE seedlings by RT-qPCR. Developing first leaf pairs were analyzed at each time point, as indicated. Values represent the mean of fold change normalized to values of the relevant transcript from the wild type at 8 DAG, which was set arbitrarily at 1. Error bars indicate the sd; a, P < 0.05, statistical significance between the wild type and the transgenic line at a given time point; b, P < 0.05, significance between two consecutive time points determined using Student’s t test (n = 3, n > 100). Abbreviations of genes and the list of primers used in this study are listed in Supplemental Table S3. B, Protein level of RBR, P-RBRS911, HA-E2FB, and endogenous E2FB in the developing first leaf pairs of wild-type and HA-E2FB/DPAOE seedlings at 8, 9, and 12 DAG detected using anti-RBR, anti-P-RBRS911 (anti-P-Rb807/811), anti-E2FB, and anti-CDKA;1 antibodies in immunoblot assays. Note, the relative intensities of the RBR and P-RBRS911 protein bands are quantified in Supplemental Figure S6, F and G. C and D, Co-IP of HA-E2FB with RBR and DPA proteins in wild-type and HA-E2FB/DPAOE seedlings at 7 DAG (C) and in first leaf pairs at 8 DAG (D). Co-IP of RBR or HA-E2FB proteins with DPA was determined through immunoblot analysis with anti-RBR or anti-E2FB antibodies. One twenty-fifth of the IP from the extract was loaded as input. The asterisk indicates a nonspecific protein cross-reaction with the anti-DPA antibody in the input. In B and D, anti-CDKA;1 antibody was used as control. In C, nonspecific membrane-bound proteins stained by Coomassie-blue were used as loading control. The arrowhead in B indicates HA-E2FB and arrows mark the positions of endogenous E2FB, DPA, and CDKA;1 in B–D, respectively.
Figure 7.
Figure 7.
Coexpression of the mutant HA-E2FBΔRBR with DPA, which is unable to transactivate and bind to RBR, hyperactivates meristematic cell divisions in leaf epidermis. A, Representative images of p35S::HA-E2FBΔRBR/DPA (HA-E2FBΔRBR/DPA), wild-type (WT), and p35S::HA-E2FB/DPA (HA-E2FB/DPAOE) plants grown for 20 d on soil. Scale bar = 1 cm. B, Confocal laser scanning microscopy images of PI-stained abaxial leaf surfaces from the first leaf pairs of wild-type and HA-E2FBΔRBR/DPA seedlings at 10 DAG. The white outline shows a typical puzzle-shaped pavement cell. Arrowheads in both images indicate normally dividing meristemoid cells, whereas white circles illustrate clusters of overproliferated meristemoid cells. Scale bars = 20 μm. C, Total CDK histone H1 kinase activity purified by p13suc1-Sepharose beads is shown and compared to Histone H1 from the first leaf pairs at four different developmental time points (8, 10, 12, and 15 DAG). For comparison, the CDKA;1 protein level is also shown in the same leaf samples. Coomassie-stained nonspecific membrane-bound proteins in the range 50–60 kD were used as loading controls. D, Co-IP of RBR and DPB proteins in the GFP-E2FB∆RBR and GFP-E2FA∆RBR pull-down was labeled with anti-RBR and anti-DPB antibodies. On the same gel, 1/12 of the IP from the extracts of the GFP-E2FB∆RBR and GFP-E2FA∆RBR lines was loaded as input. Arrows point toward the specific proteins. The arrowhead indicates a faster-migrating DPB protein. Molecular weight markers are indicated on the left. E, Expression levels of ORC2, CDKB1;1, CYCD3;1, and RBR were followed in two independent HA-E2FBΔRBR/DPA lines (lines 10 and 1) using RT-qPCR. The developing first leaf pairs were analyzed at each time point, as indicated. Values represent the fold change normalized to values of the relevant transcript from the wild type at 8 DAG, which was set arbitrarily at 1. As the two independent lines show the same tendencies, here, n = 2, n > 50. a, P < 0.05, statistical significance between the wild type and the transgenic line at a given time point determined using Student’s t test.
Figure 8.
Figure 8.
Model explaining the functions of E2FB during leaf development. E2FB has three different activities, and each is dominant at different leaf developmental stages (A) or in different cell types (B). A, Activator E2FB is in its RBR-free form, characteristic of young leaves consisting of mostly proliferating cells. The young meristematic leaf is a nutrient-rich sink tissue, where E2FB is released from the repression of RBR by the CYCD3;1-regulated RBR kinase in a Suc-dependent manner. E2FB controls the activity of RBR by using CYCD3;1 activity to regulate RBR transcriptional and protein level, as well as phosphorylation status. In leaf cells where the growth-promoting signal is weakened, the protein levels of both E2FB and RBR decrease and RBR becomes more active (less phosphorylated) to bind and inhibit E2FB. This repression is important to establish quiescence in leaf cells committed to differentiation. B, In developing leaves, E2FB also forms a repressor complex with RBR in meristemoid leaf cells to corepress their divisions. How this repression is regulated by upstream signal(s) is hitherto unknown.

Similar articles

Cited by

References

    1. Abraham E, Miskolczi P, Ayaydin F, Yu P, Kotogany E, Bako L, Ötvös K, et al. (2011) Immunodetection of retinoblastoma-related protein and its phosphorylated form in interphase and mitotic alfalfa cells. J Exp Bot 62: 2155–2168 - PMC - PubMed
    1. Abraham Z, del Pozo JC (2012) Ectopic expression of E2FB, a cell cycle transcription factor, accelerates flowering and increases fruit yield in tomato. J Plant Growth Regul 31: 11–24
    1. Andriankaja M, Dhondt S, De Bodt S, Vanhaeren H, Coppens F, De Milde L, Mühlenbock P, Skirycz A, Gonzalez N, Beemster GT, et al. (2012) Exit from proliferation during leaf development in Arabidopsis thaliana: A not-so-gradual process. Dev Cell 22: 64–78 - PubMed
    1. Asl LK, Dhondt S, Boudolf V, Beemster GT, Beeckman T, Inzé D, Govaerts W, De Veylder L (2011) Model-based analysis of Arabidopsis leaf epidermal cells reveals distinct division and expansion patterns for pavement and guard cells. Plant Physiol 156: 2172–2183 - PMC - PubMed
    1. Berckmans B, Lammens T, Van Den Daele H, Magyar Z, Bögre L, De Veylder L (2011a) Light-dependent regulation of DEL1 is determined by the antagonistic action of E2Fb and E2Fc. Plant Physiol 157: 1440–1451 - PMC - PubMed

Publication types

MeSH terms

Substances