

A TCR β-Chain Motif Biases toward Recognition of Human CD1 Proteins
- PMID: 31694911
- PMCID: PMC6904517
- DOI: 10.4049/jimmunol.1900872
A TCR β-Chain Motif Biases toward Recognition of Human CD1 Proteins
Abstract
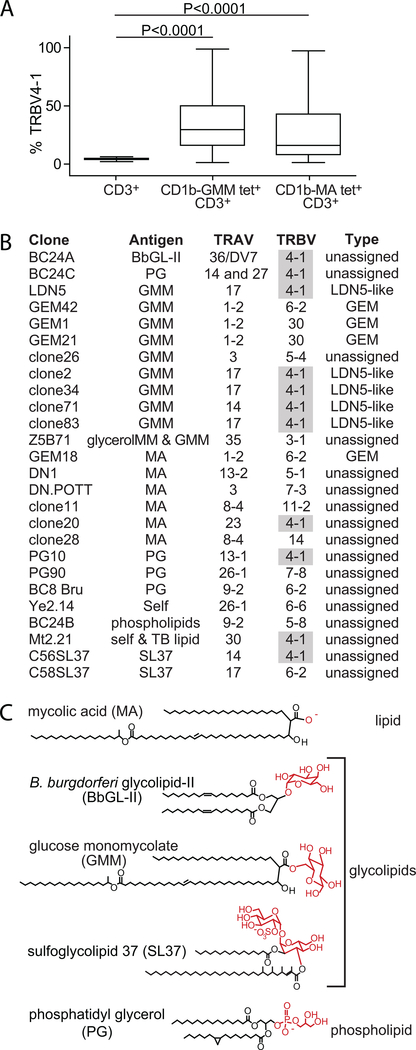
High-throughput TCR sequencing allows interrogation of the human TCR repertoire, potentially connecting TCR sequences to antigenic targets. Unlike the highly polymorphic MHC proteins, monomorphic Ag-presenting molecules such as MR1, CD1d, and CD1b present Ags to T cells with species-wide TCR motifs. CD1b tetramer studies and a survey of the 27 published CD1b-restricted TCRs demonstrated a TCR motif in humans defined by the TCR β-chain variable gene 4-1 (TRBV4-1) region. Unexpectedly, TRBV4-1 was involved in recognition of CD1b regardless of the chemical class of the carried lipid. Crystal structures of two CD1b-specific TRBV4-1+ TCRs show that germline-encoded residues in CDR1 and CDR3 regions of TRBV4-1-encoded sequences interact with each other and consolidate the surface of the TCR. Mutational studies identified a key positively charged residue in TRBV4-1 and a key negatively charged residue in CD1b that is shared with CD1c, which is also recognized by TRBV4-1 TCRs. These data show that one TCR V region can mediate a mechanism of recognition of two related monomorphic Ag-presenting molecules that does not rely on a defined lipid Ag.
Copyright © 2019 by The American Association of Immunologists, Inc.
Conflict of interest statement
Competing interests
The authors declare that they have no competing interests.
Figures


Similar articles
-
Fine specificity of TCR complementarity-determining region residues and lipid antigen hydrophilic moieties in the recognition of a CD1-lipid complex.J Immunol. 2002 Apr 15;168(8):3933-40. doi: 10.4049/jimmunol.168.8.3933. J Immunol. 2002. PMID: 11937549
-
Modeling T cell receptor recognition of CD1-lipid and MR1-metabolite complexes.BMC Bioinformatics. 2014 Sep 26;15(1):319. doi: 10.1186/1471-2105-15-319. BMC Bioinformatics. 2014. PMID: 25260513 Free PMC article.
-
TCR bias and affinity define two compartments of the CD1b-glycolipid-specific T Cell repertoire.J Immunol. 2014 May 1;192(9):4054-60. doi: 10.4049/jimmunol.1400158. Epub 2014 Mar 28. J Immunol. 2014. PMID: 24683194 Free PMC article.
-
The intricacies of self-lipid antigen presentation by CD1b.Mol Immunol. 2018 Dec;104:27-36. doi: 10.1016/j.molimm.2018.09.022. Epub 2018 Nov 3. Mol Immunol. 2018. PMID: 30399491 Review.
-
Antigen specificity of semi-invariant CD1d-restricted T cell receptors: the best of both worlds?Immunol Cell Biol. 2004 Jun;82(3):285-94. doi: 10.1111/j.0818-9641.2004.01257.x. Immunol Cell Biol. 2004. PMID: 15186260 Review.
Cited by
-
SLAMF7 and IL-6R define distinct cytotoxic versus helper memory CD8+ T cells.Nat Commun. 2020 Dec 11;11(1):6357. doi: 10.1038/s41467-020-19002-6. Nat Commun. 2020. PMID: 33311473 Free PMC article.
-
Novel Molecular Insights into Human Lipid-Mediated T Cell Immunity.Int J Mol Sci. 2021 Mar 5;22(5):2617. doi: 10.3390/ijms22052617. Int J Mol Sci. 2021. PMID: 33807663 Free PMC article. Review.
-
CD36 family members are TCR-independent ligands for CD1 antigen-presenting molecules.Sci Immunol. 2021 Jun 25;6(60):eabg4176. doi: 10.1126/sciimmunol.abg4176. Sci Immunol. 2021. PMID: 34172588 Free PMC article.
-
Longitudinal High-Throughput Sequencing of the T-Cell Receptor Repertoire Reveals Dynamic Change and Prognostic Significance of Peripheral Blood TCR Diversity in Metastatic Colorectal Cancer During Chemotherapy.Front Immunol. 2022 Jan 12;12:743448. doi: 10.3389/fimmu.2021.743448. eCollection 2021. Front Immunol. 2022. PMID: 35095836 Free PMC article.
-
Sensing mycobacteria through unconventional pathways.J Clin Invest. 2025 Mar 17;135(6):e190230. doi: 10.1172/JCI190230. J Clin Invest. 2025. PMID: 40091837 Free PMC article.
References
-
- Salio M, Silk JD, Jones EY, and Cerundolo V. 2014. Biology of CD1- and MR1-restricted T cells. Annu. Rev. Immunol 32:323–366. - PubMed
-
- Han M, Hannick LI, DiBrino M, and Robinson MA. 1999. Polymorphism of human CD1 genes. Tissue Antigens 54:122–127. - PubMed
-
- Rossjohn J, Gras S, Miles JJ, Turner SJ, Godfrey DI, and McCluskey J. 2015. T cell antigen receptor recognition of antigen-presenting molecules. Annu. Rev. Immunol 33:169–200. - PubMed
-
- Garcia KC, Degano M, Stanfield RL, Brunmark A, Jackson MR, Peterson PA, Teyton L, and Wilson IA. 1996. An alphabeta T cell receptor structure at 2.5 A and its orientation in the TCR-MHC complex. Science 274:209–219. - PubMed
Publication types
MeSH terms
Substances
Grants and funding
LinkOut - more resources
Full Text Sources
Molecular Biology Databases
Research Materials
