. 2019 Nov 6;11(517):eaax0481.
doi: 10.1126/scitranslmed.aax0481.

Platelet regulation of myeloid suppressor of cytokine signaling 3 accelerates atherosclerosis

Affiliations

Platelet regulation of myeloid suppressor of cytokine signaling 3 accelerates atherosclerosis

Tessa J Barrett et al. Sci Transl Med. .

Abstract

Platelets are best known as mediators of hemostasis and thrombosis; however, their inflammatory effector properties are increasingly recognized. Atherosclerosis, a chronic vascular inflammatory disease, represents the interplay between lipid deposition in the artery wall and unresolved inflammation. Here, we reveal that platelets induce monocyte migration and recruitment into atherosclerotic plaques, resulting in plaque platelet-macrophage aggregates. In Ldlr -/- mice fed a Western diet, platelet depletion decreased plaque size and necrotic area and attenuated macrophage accumulation. Platelets drive atherogenesis by skewing plaque macrophages to an inflammatory phenotype, increasing myeloid suppressor of cytokine signaling 3 (SOCS3) expression and reducing the Socs1:Socs3 ratio. Platelet-induced Socs3 expression regulates plaque macrophage reprogramming by promoting inflammatory cytokine production (Il6, Il1b, and Tnfa) and impairing phagocytic capacity, dysfunctions that contribute to unresolved inflammation and sustained plaque growth. Translating our data to humans with cardiovascular disease, we found that women with, versus without, myocardial infarction have up-regulation of SOCS3, lower SOCS1:SOCS3, and increased monocyte-platelet aggregate. A second cohort of patients with lower extremity atherosclerosis demonstrated that SOCS3 and the SOCS1:SOCS3 ratio correlated with platelet activity and inflammation. Collectively, these data provide a causative link between platelet-mediated myeloid inflammation and dysfunction, SOCS3, and cardiovascular disease. Our findings define an atherogenic role of platelets and highlight how, in the absence of thrombosis, platelets contribute to inflammation.


Figures

Fig. 1.
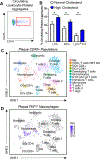
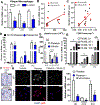
Fig. 1.. Hypercholesterolemia promotes platelet-myeloid interactions.
(A-B) Circulating leukocyte-platelet aggregates (LPA), monocyte-platelet aggregates (MPA), and Ly6Chimonocyte-platelet (Ly6Chi-PA) aggregates as determined via flow cytometry in control and hypercholesterolemic (LDLR ASO treated) mice. Data are expressed as mean ± SEM, n = 5 mice/grp, *P < 0.05 as determined by a two-tailed Student’s t test. (C-D) t-Stochastic neighbor embedding (t-SNE) representation of aligned gene expression data in single cells (n = 2540) extracted from atherosclerotic aortic arches of hypercholesterolemic mice. (C) Identification of CD45+ plaque leukocyte clusters based on transcript expression, and (D) Platelet factor 4 (Pf4) expression projected on leukocyte clusters of t-SNE plots (scale log-fold transformed gene expression).
Fig. 2.
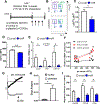
Fig. 2.. Platelets prime monocytes for migration
(A) Experimental overview: Male Ldlr−/− mice were fed a western diet (0.3% cholesterol) for 7 weeks. At week 6, mice were injected with EdU to label circulating monocytes. Mice were then split into groups, and over a 2 week period received 4 injections (3 μg/g, i.p.) of either α-CD42b (α-plt), or α-IgG (α-ctrl). (B) Representative flow cytometry plot to identify circulating monocyte subtypes, (C) ratio of Ly6Chi to Ly6Clo monocytes and (D) monocyte CD11b surface expression in Ldlr−/− mice fed a western diet (0.3% cholesterol) for 7 weeks and subsequent treatment with an IgG control antibody (α-ctrl) or α-CD42b (α-plt). Data are expressed as mean ± SEM, n = 6 mice/grp. (E) Inflammatory transcript expression on monocytes from mice treated as in (A), as determined by FACS sorting and RT-qPCR. Data are expressed as mean ± SEM, n = 4–5 mice/grp, * p < 0.01. (F) Correlation of platelet count with the expression of inflammatory transcripts in circulating monocytes, data are expressed as mean ± SEM, n = 4 mice/grp. (G) Monocyte migration to platelet releasate and (H) chemotaxis quantification, data are expressed as mean ± SEM, n = 3. (I) Migratory capacity towards chemoattractants of monocytes isolated from mice treated as in (A), data are expressed as mean ± SEM, n = 6 mice/grp. * P < 0.05, ** P < 0.005 as determined by a two-tailed Student’s t test.
Fig. 3.
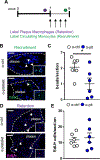
Fig. 3.. Platelets alter monocyte recruitment to atherosclerotic lesions
(A) Experimental overview: Male Ldlr−/− mice were fed a western diet (0.3% cholesterol) for 7 weeks. At week 6, mice were injected with EdU to label circulating monocytes. Mice were then split into groups, and over a 2 week period received 4 injections (3 μg/g, i.p.) of either α-CD42b (α-plt), or α-IgG (α-ctrl). 48 hours prior to harvest mice were injected with green fluorescent beads to track monocyte entry into plaques. At week 9 mice were harvested for plaque analyses. Representative images of (B) macrophage recruitment to the aortic sinus, and (C) quantification of monocyte recruitment in the aortic sinus. (D) Representative image and (E) quantification of macrophage retention to the aortic sinus. Dashed lines highlight plaque area, insert is magnified area. Data are expressed as mean ± SEM, n = 6 mice/grp, * P < 0.05 as determined by a twotailed Student’s t test, one dot per mouse. Scale bar: 100 μm.
Fig. 4.
Fig. 4.. Platelets promote atherosclerosis progression
Male Ldlr−/− mice were fed a western diet (0.3% cholesterol) for 7 weeks. Mice were then split into groups, and over a 2 week period received 4 injections (3 ug/g, i.p.) of either α-CD42b (α-plt) or α-IgG (α-ctrl). At week 9 mice were harvested for plaque analyses. (A) Representative images (scale bar: 500 μm) and (B) quantification of aortic root lesions stained with H&E. (C) Representative images (scale bar: 100 μM) and (D) quantification of aortic root lesions after immunohistochemical staining for the macrophage marker CD68. (E) Representative images (scale bar: 100 μm) and (F) quantification of brachiocephalic arteries stained with H&E and CD68. (G) Representative brightfield (BF) and polarized light images (scale bar: 100 μM) and (H) quantification of aortic root lesions stained with picrosirius red to quantify plaque collagen content, data are expressed as mean ± SEM, n = 6 mice/grp, * P < 0.05 as determined by a two-tailed Student’s t test.
Fig. 5.
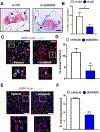
Fig. 5.. Platelets impair macrophage efferocytosis
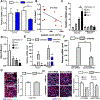
Male Ldlr−/− mice were fed a western diet (0.3% cholesterol) for 7 weeks. Mice were then split into groups, and over a 2 week period received 4 injections (3 μg/g, i.p.) of either α-CD42b (α-plt) or α-IgG (α-ctrl). At week 9 mice were harvested for plaque analyses. (A) Representative images (scale bar: 100 μm) and (B) quantification of aortic root necrotic area, data are expressed as mean ± SEM, n = 6 mice/grp. (C) Representative images and (D) quantification of peritoneal macrophage apoptotic jurkat uptake after treatment with platelets or vehicle control for 6 h, and jurkat exposure for 90 min. (E) Representative images and (F) quantification of peritoneal macrophage FITC-labeled heat inactivated Escherichia (E.) coli uptake after treatment with platelets or vehicle control for 6 h, and subsequent E. coli incubation for 90 min. Macrophages were counterstained with DAPI, and the actin cytoskeleton stained with phalloidin. Data are from one experiment representative of 4 (D, F, mean ± SEM) independent experiments with similar results, * P < 0.05, and ** P < 0.001 as determined by a two-tailed Student’s t test. Scale bar: 50 μm.
Fig. 6.
Fig. 6.. Platelets promote a pro-inflammatory plaque macrophage phenotype
Male Ldlr−/− mice were fed a western diet (0.3% cholesterol) for 7 weeks. Mice were then split into groups, and over a 2 week period received 4 injections (3 μg/g, i.p.) of either α-CD42b (α-plt) or α-IgG (α-ctrl). At week 9 mice were harvested for plaque analyses. Plaque macrophages were isolated by laser capture microdissection, and transcripts analyzed via RT-qPCR. (A) Expression of inflammatory transcripts in plaque macrophages isolated from mice. Correlation between inflammatory transcript expression and (B) circulating platelet count and (C) plaque macrophage area. Data are expressed relative to Hprt and expressed as mean ± SEM, n = 5 mice/grp, * P < 0.05 as determined by a two-tailed Student’s t test. (D) mRNA expression of peritoneal macrophages treated with either platelets or releasate of platelets for 6 h, * P < 0.05 as determined by 1-way ANOVA. (E) Inflammatory cytokine quantification in peritoneal macrophage supernatant after exposure to platelets for 6 hours. Data are expressed relative to Cyclophilin. *** P < 0.002 as determined by a two-tailed Student’s t test. (F) Oil Red O staining of macrophages exposed to acetylated LDL (50 μg/mL) for 6 h in the presence or absence of platelets. (G) Dose-response of inflammatory gene expression of macrophages treated with increasing ratio of platelets to macrophages (0:1, 20:1, 50:1, 100:1). * P < 0.05 as determined by 1-way ANOVA. (H) Macrophage p65 staining as by microscopy, NFkBi = pretreatment of macrophages for 30 min with 10 μM Bay 11–7082 prior to platelet exposure. (I) Expression of proinflammatory genes in macrophages treated with platelets with or without inhibition of NFκB-mediated signaling (10 μM, Bay 11–7082) for 6 h. Data are expressed as mean ± SEM, n = 4 mice/grp, * P < 0.05 as determined by a two-tailed Student’s t test. Scale bar: 20 μm.
Fig. 7.
Fig. 7.. Socs3 induction by platelets enhances the proinflammatory effects of macrophage IL-6-signaling
(A) Socs1 and Socs3 expression of plaque macrophages from platelet competent and deficient mice expressed as mean ± SEM, n = 6 mice/grp, * P < 0.05 as determined by a two-tailed Student’s t test. (B) Correlation of Socs1:Socs3 with circulating platelet count at time of harvest, data are expressed relative to Hprt. (C) Peritoneal macrophage expression of Socs3 and Socs1 after exposure to different doses of platelets. (D) Socs1:Socs3 expression in peritoneal macrophages exposed to increasing platelet to macrophage ratio (0:1, 20:1, 50:1, 100:1) expressed as mean ± SEM, * P < 0.05 relative to the vehicle control as determined by 1-way ANOVA. (E) Socs3 and Il1b expression in macrophages after exposure to platelets with and without inhibition of IL-6 signaling via α-gp130 (2 ug/mL), as mean ± SEM, * P < 0.02 relative to the vehicle control or # P < 0.02 relative to platelet-treated cells as determined by 1-way ANOVA. (F) Macrophage Il1b expression after exposure to platelets with or without knockdown of Socs3 for 6 h. * P < 0.01 relative to siRNA control platelet treated samples as determined by a 2-way ANOVA. Data are from one experiment representative of 3 (C-F mean ± SEM) independent experiments with similar results, data are expressed relative to Cyclophilin. (G) Representative images and quantification of peritoneal macrophage apoptotic jurkat uptake after treatment with α-gp130 and platelets or vehicle control for 6 h, and jurkat exposure for 90 min. (H) Representative images and quantification of peritoneal macrophage apoptotic jurkat uptake after treatment with platelets with or without knockdown of SOCS3 or vehicle control for 6 h, and jurkat exposure for 90 min. Macrophages were counterstained with DAPI, and the actin cytoskeleton stained with phalloidin. Data are from one experiment representative of 4 (C-F, mean ± SEM) independent experiments with similar results, *** P < 0.001, * P < 0.005 as determined by a two-tailed Student’s t test. Scale bar: 50 μm.
Fig. 8.
Fig. 8.. SOCS1:SOCS3 in subjects with CVD correlates with IL1B and platelet activity.
Correlation of whole blood SOCS1:SOCS3 expression to (A) IL1B (n = 99), (B) circulating monocyte-platelet aggregates (MPA) (n = 95), (C) platelet surface P-selectin expression (n = 100), and (D) platelet CD40 expression (n = 99) in subjects with peripheral artery disease.

Comment in

References

    1. Gawaz M, Stellos K, and Langer HF, Platelets modulate atherogenesis and progression of atherosclerotic plaques via interaction with progenitor and dendritic cells. J Thromb Haemost, 2008. 6(2): p. 235–242. - PubMed
    1. Davi G and Patrono C, Platelet activation and atherothrombosis. N Engl J Med, 2007. 357(24): p. 2482–2494. - PubMed
    1. Wagner DD and Burger PC, Platelets in inflammation and thrombosis. Arterioscler Thromb Vasc Biol, 2003. 23(12): p. 2131–2137. - PubMed
    1. Huo Y, Schober A, Forlow SB, Smith DF, Hyman MC, Jung S, Littman DR, Weber C, and Ley K, Circulating activated platelets exacerbate atherosclerosis in mice deficient in apolipoprotein E. Nat Med, 2003. 9(1): p. 61–67. - PubMed
    1. Massberg S, Brand K, Gruner S, Page S, Muller E, Muller I, Bergmeier W, Richter T, Lorenz M, Konrad I, Nieswandt B, and Gawaz M, A critical role of platelet adhesion in the initiation of atherosclerotic lesion formation. J Exp Med, 2002. 196(7): p. 887–896. - PMC - PubMed

Publication types

MeSH terms

LinkOut - more resources