. 2019 Nov 6;11(517):eaaw7852.
doi: 10.1126/scitranslmed.aaw7852.

Identification of DHODH as a therapeutic target in small cell lung cancer

Affiliations

Identification of DHODH as a therapeutic target in small cell lung cancer

Leanne Li et al. Sci Transl Med. .

Abstract

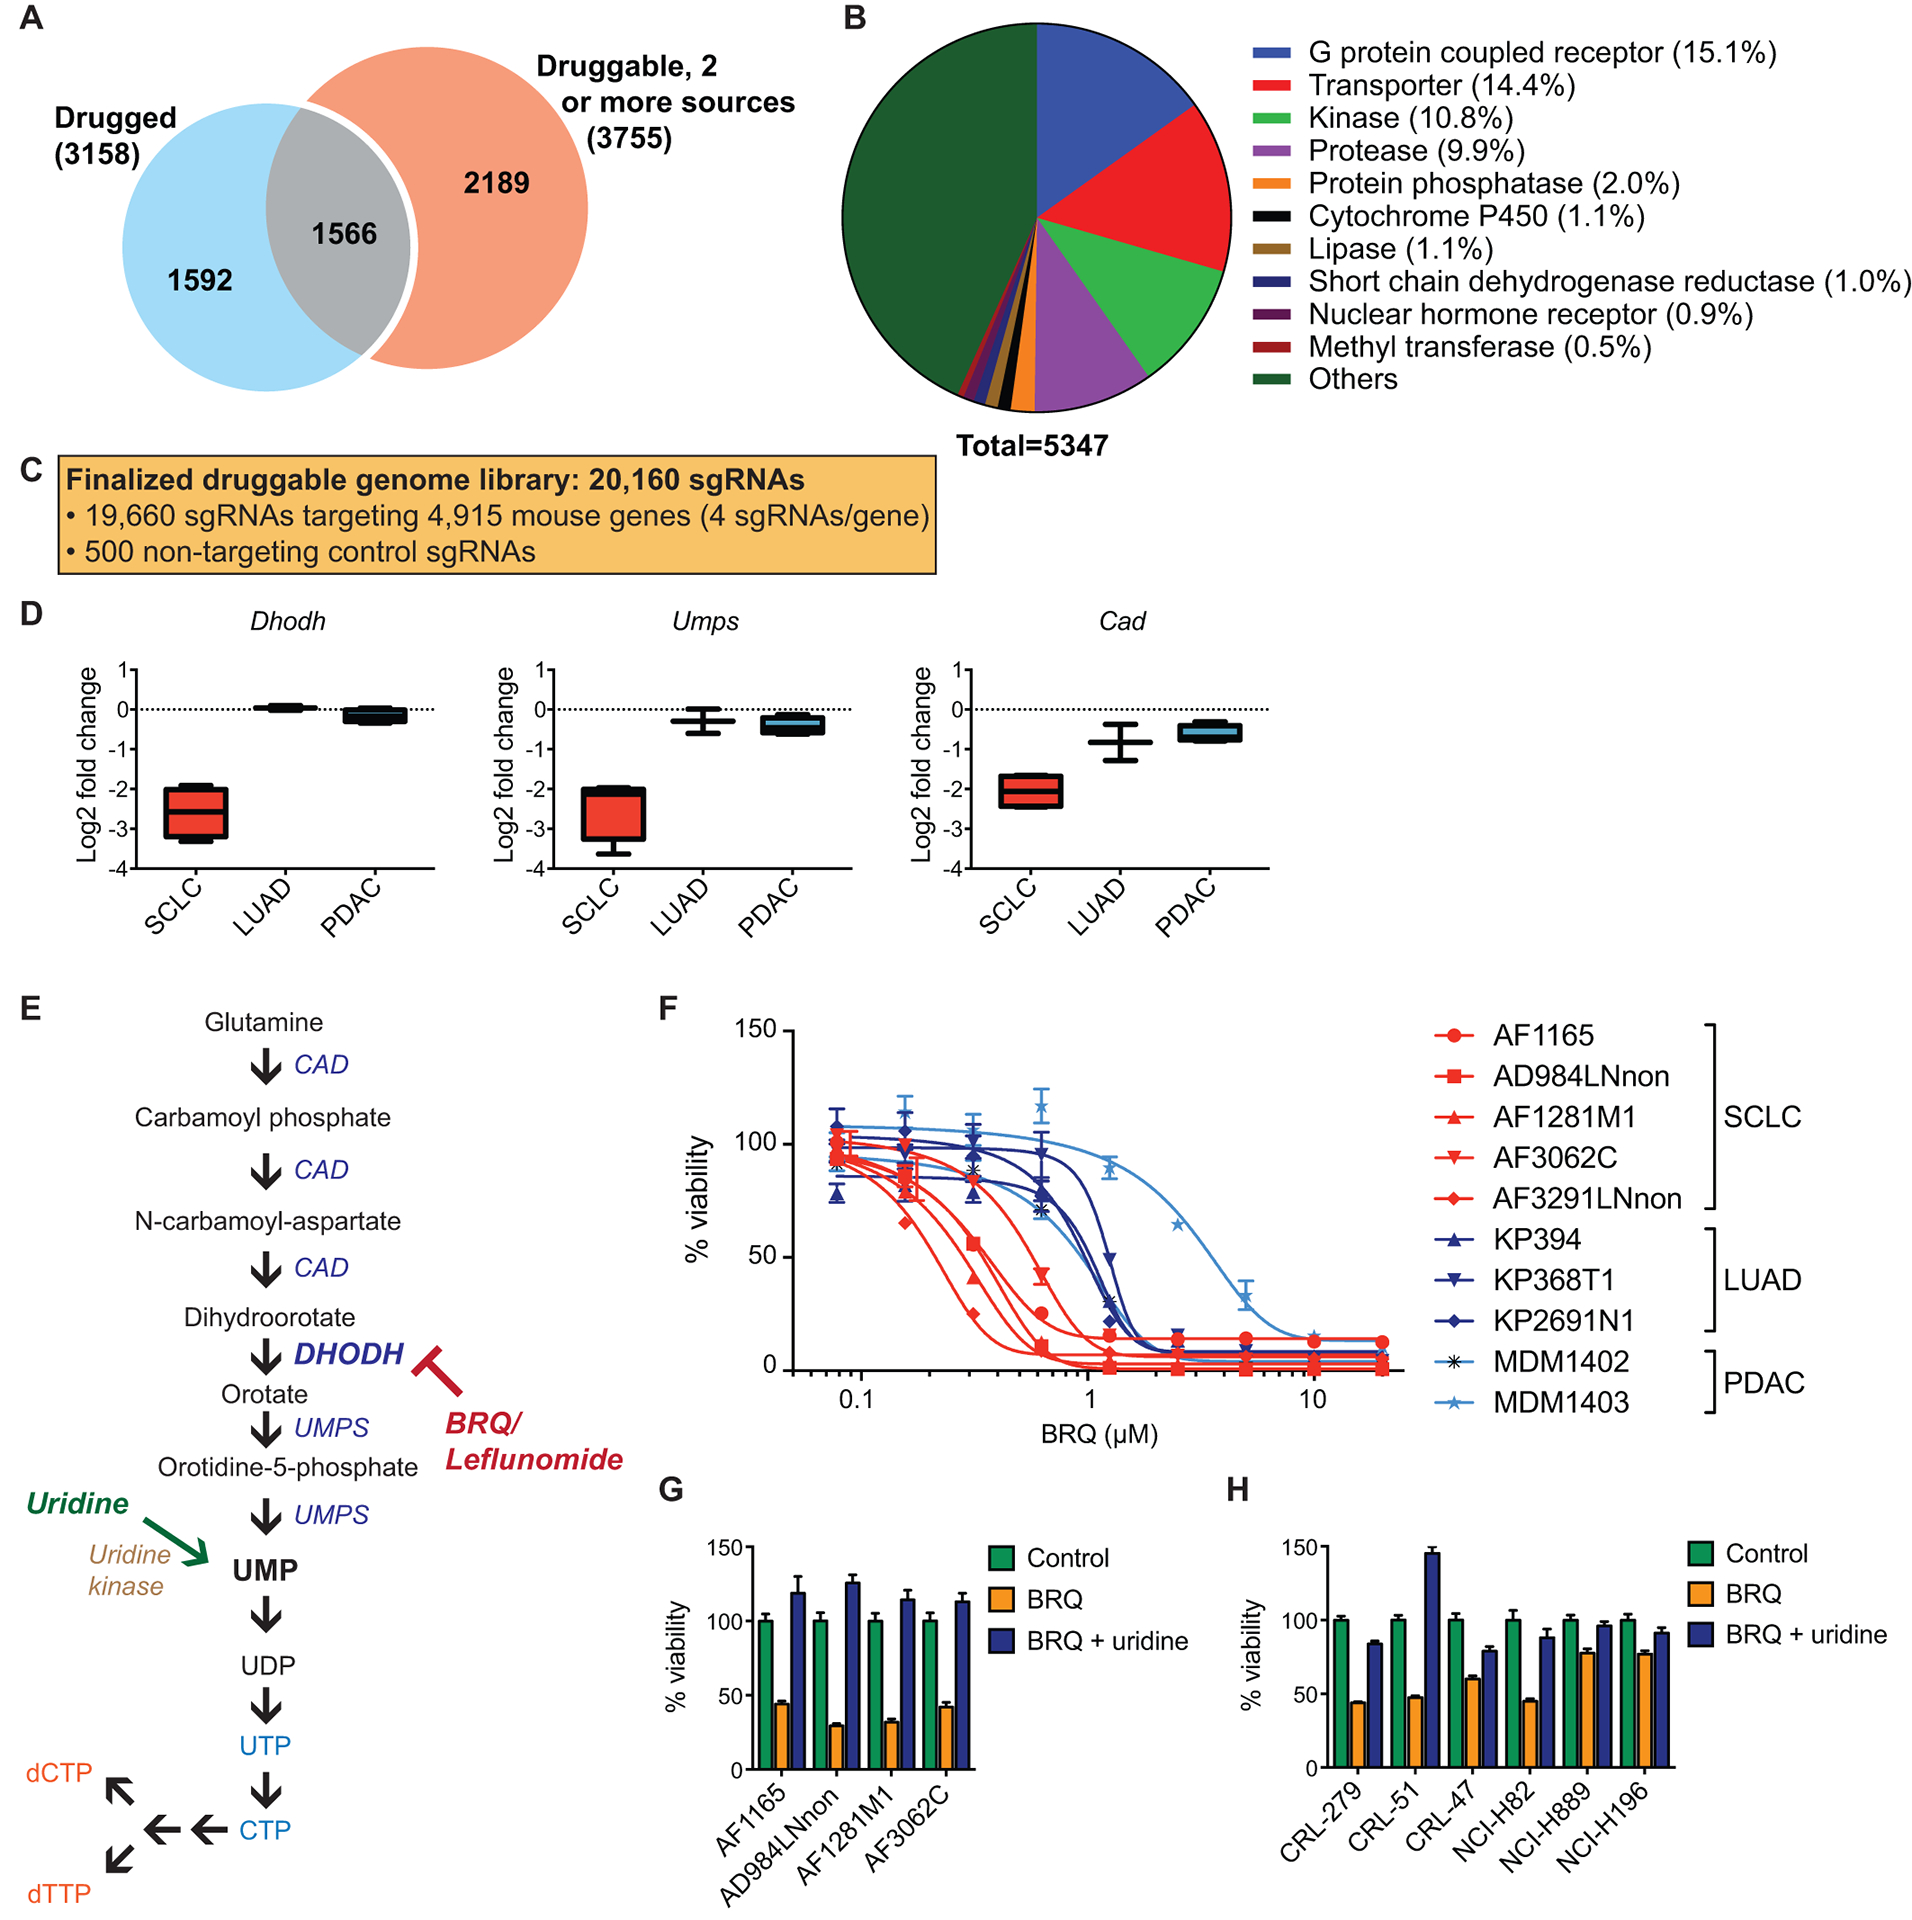
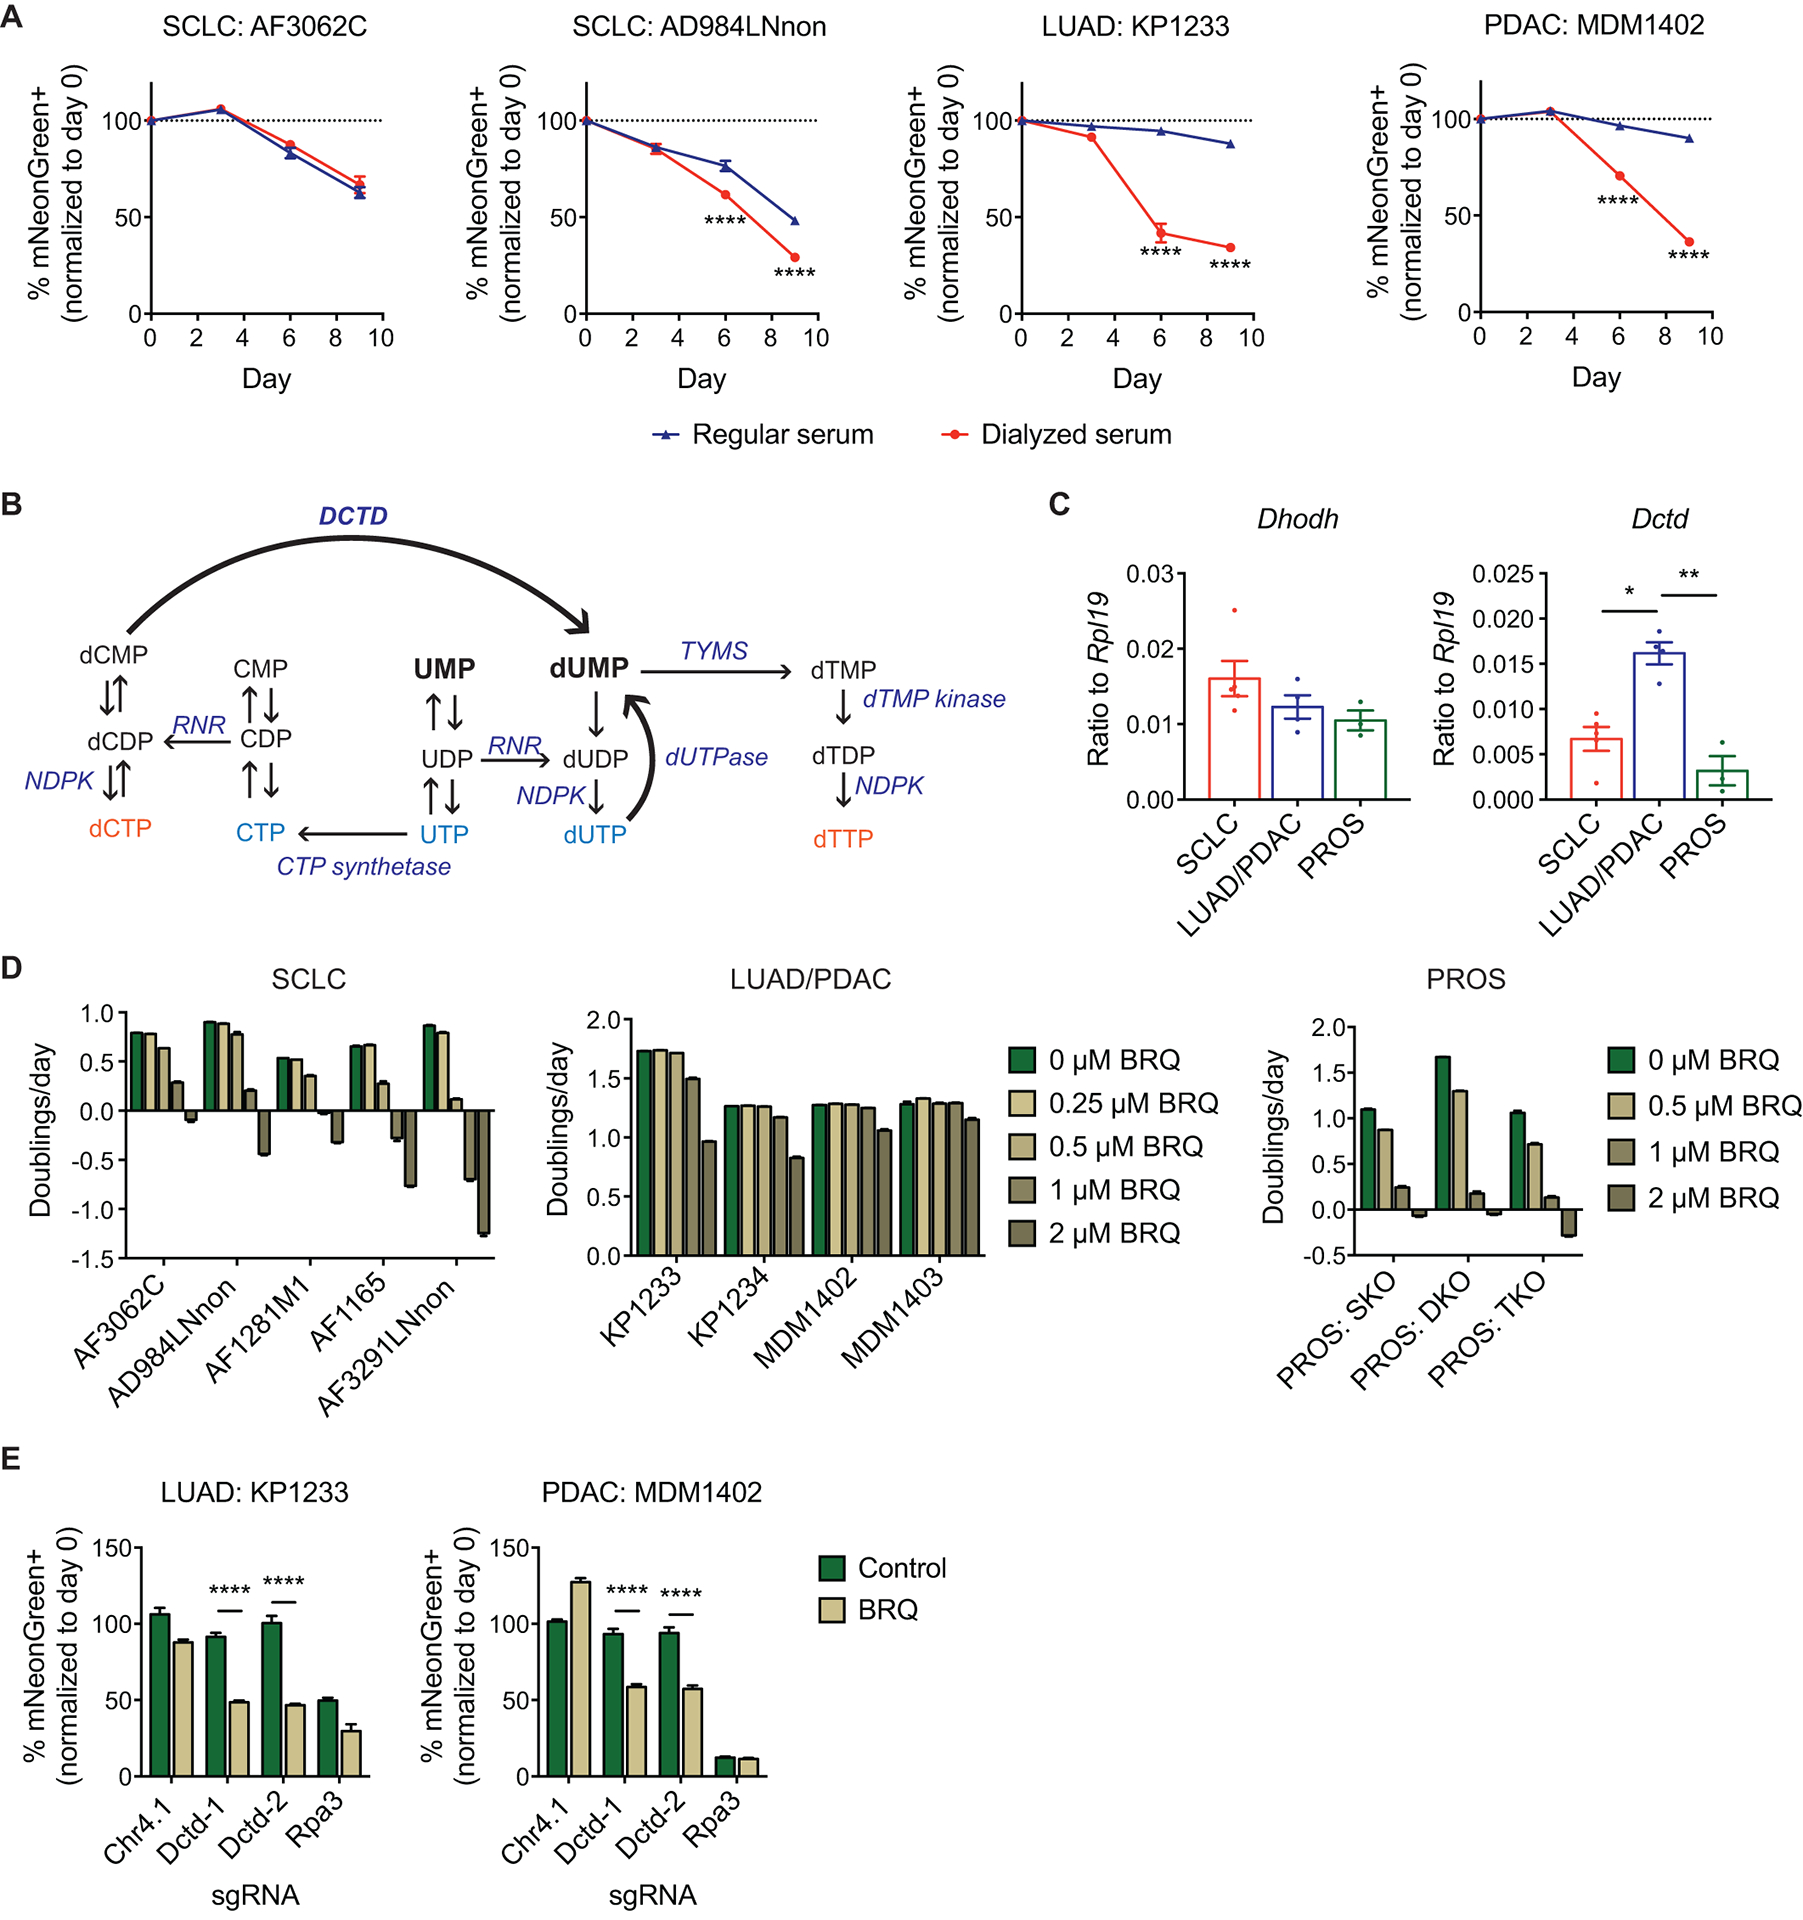
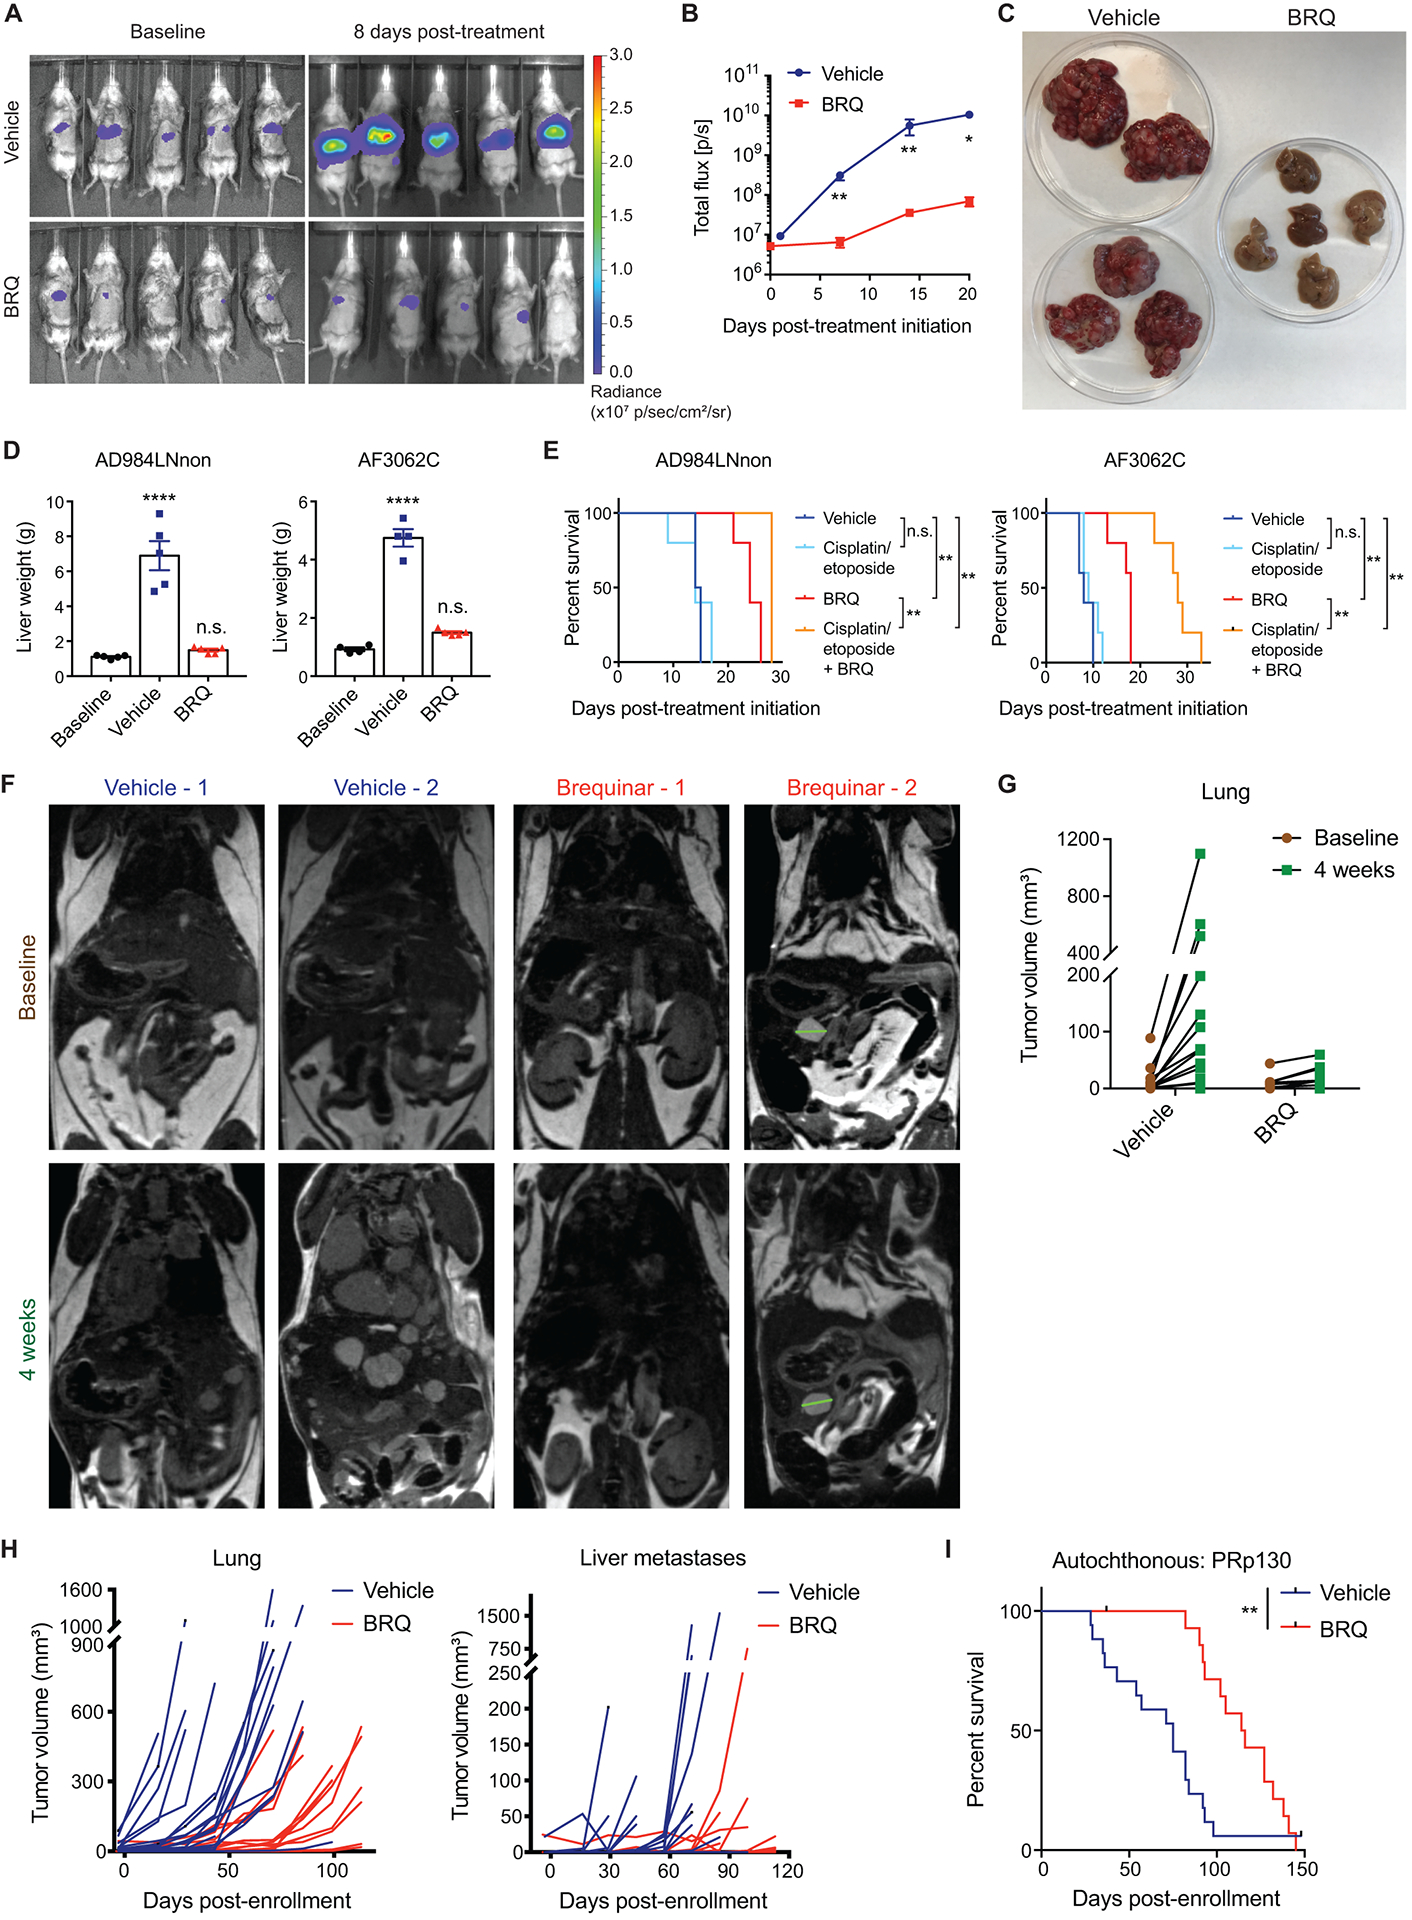
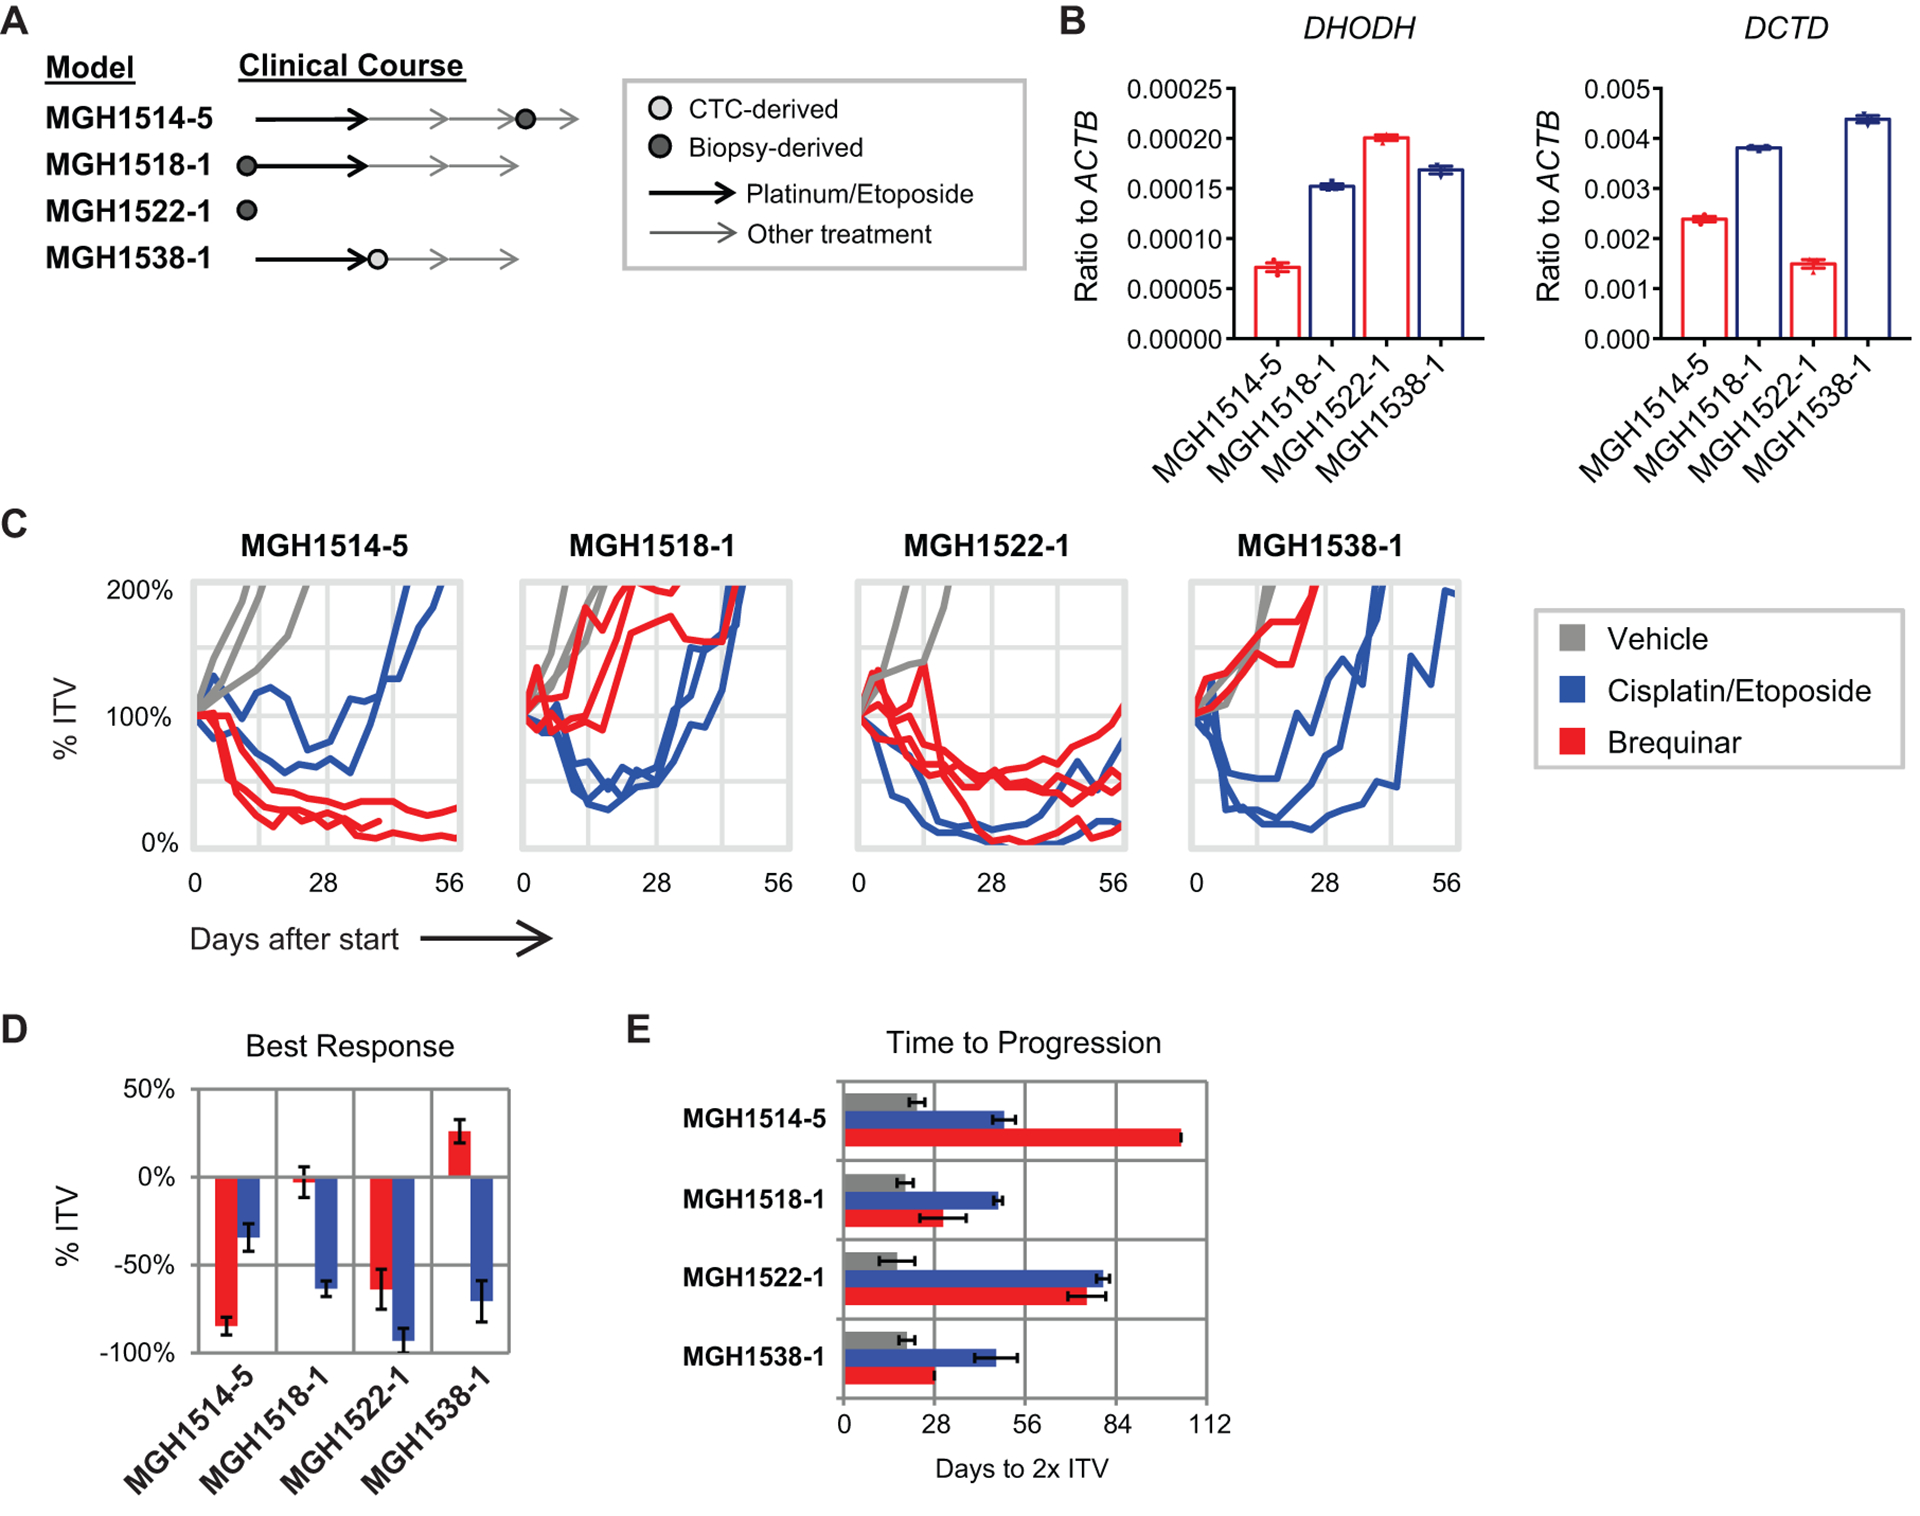
Small cell lung cancer (SCLC) is an aggressive lung cancer subtype with extremely poor prognosis. No targetable genetic driver events have been identified, and the treatment landscape for this disease has remained nearly unchanged for over 30 years. Here, we have taken a CRISPR-based screening approach to identify genetic vulnerabilities in SCLC that may serve as potential therapeutic targets. We used a single-guide RNA (sgRNA) library targeting ~5000 genes deemed to encode "druggable" proteins to perform loss-of-function genetic screens in a panel of cell lines derived from autochthonous genetically engineered mouse models (GEMMs) of SCLC, lung adenocarcinoma (LUAD), and pancreatic ductal adenocarcinoma (PDAC). Cross-cancer analyses allowed us to identify SCLC-selective vulnerabilities. In particular, we observed enhanced sensitivity of SCLC cells toward disruption of the pyrimidine biosynthesis pathway. Pharmacological inhibition of dihydroorotate dehydrogenase (DHODH), a key enzyme in this pathway, reduced the viability of SCLC cells in vitro and strongly suppressed SCLC tumor growth in human patient-derived xenograft (PDX) models and in an autochthonous mouse model. These results indicate that DHODH inhibition may be an approach to treat SCLC.


Conflict of interest statement

Competing interests: T.J. is a member of the Board of Directors of Amgen and Thermo Fisher Scientific. He is also a co-Founder of Dragonfly Therapeutics and T2 Biosystems. T.J. serves on the Scientific Advisory Board of Dragonfly Therapeutics, SQZ Biotech, and Skyhawk Therapeutics. None of these affiliations represent a conflict of interest with respect to the design or execution of this study or interpretation of data presented in this manuscript. Dr. Jacks’s laboratory currently also receives funding from the Johnson & Johnson Lung Cancer Initiative and Calico, but this funding did not support the research described in this manuscript. M.G.V.H. discloses that he is an advisor for Agios Pharmaceuticals, Aeglea Biotherapeutics, and Auron Therapeutics. B.J.D. and N.J.D. receive research funding from Novartis, AstraZeneca, Merck and Abbvie. A.F.F. is consulting for PharmaMar, Abbvie, Loxo, Stemcentrx, Genentech/Roche, Bayer, AstraZeneca, Bristol-Myers Squibb, and Boerhinger Ingelheim, and receives research funding from PharmaMar, AbbVie, AstraZeneca, Bristol-Myers Squibb, Merck, Loxo, Ignyta, Amgen, Genentech/Roche, Bayer and Novartis. P.P.H is a consultant for Auron Therapeutics. M.C.B. is an associate contractor of Anzu Partners. The other authors declare that they have no competing interests.

Figures

Fig. 1.
Fig. 1.. SCLC cells are sensitive to disruption of the de novo pyrimidine synthesis pathway.
(A) Number of genes in each category in the druggable genome library. (B) Composition of genes in the druggable genome library by gene category. (C) Breakdown of the total number of sgRNAs in the druggable genome library. (D) Gene scores (log2 fold change) for the indicated genes for SCLC (n = 4 biological replicates), LUAD (n = 2 biological replicates), and PDAC (n = 4 biological replicates). Data are presented as median gene scores, with boxes denoting the interquartile range and bars denoting the range. (E) The pyrimidine nucleotide synthesis pathway. (F) Dose response curves for brequinar in murine SCLC, LUAD, and PDAC cell lines (n = 4 technical replicates for each sample). Results for each cell line are normalized to control untreated samples. Data are presented as means ± SEM. (G) Quantification of cell viability in murine SCLC cell lines after treatment with 1 μM brequinar ± 500 μM uridine (n = 4 technical replicates). Data are presented as means ± SEM. (H) Quantification of cell viability in human SCLC cell lines after treatment with 1 μM brequinar ± 500 μM uridine (n = 4 technical replicates). Data are presented as means ± SEM.
Fig. 2.
Fig. 2.. SCLC cells exhibit lower flux through the de novo pyrimidine synthesis pathway compared with LUAD/PDAC cells.
(A) Baseline uridine monophosphate (UMP) concentrations in untreated SCLC, LUAD, and PDAC cell lines, as measured by liquid chromatography-mass spectrometry (LC/MS). Data are shown as relative amounts normalized to cell number, after absolute quantification using external UMP standards (n = 3 technical replicates per cell line). (B) Concentrations of newly synthesized UMP (M+1) in untreated SCLC, LUAD, and PDAC cell lines at the indicated time points after the start of 15N-glutamine labeling. Data are shown as relative amounts normalized to pool size/cell (n = 3 technical replicates per condition). (C, D) Dihydroorotate (C) and N-carbamoyl-aspartate (D) concentrations in SCLC, LUAD, and PDAC cell lines 6 hours after treatment with 1 μM brequinar. Data are normalized to untreated controls and adjusted for cell number (n = 3 technical replicates per cell line). (E) Fractions of newly synthesized (M+1) and pre-existing (M+0) uridine triphosphate (UTP) in SCLC, LUAD, and PDAC cell lines treated with 1 μM brequinar, at the indicated time points after the start of 15N-glutamine labeling. Data are normalized to total UTP concentrations in each cell line (n = 3 technical replicates per condition). All data are presented as means ± SEM.
Fig. 3.
Fig. 3.. LUAD/PDAC cells use alternative pathways to replenish cellular pyrimidine pools.
(A) In vitro competition assays for SCLC, LUAD, and PDAC cell lines transduced with sgDhodh, grown in cell culture medium supplemented with either regular (non-dialyzed) serum or dialyzed serum. Data are normalized to the transduction efficiency at day 0 (n = 3 technical replicates for each sample). Data are presented as means ± SEM. **** p<0.0001, 2-way ANOVA with Sidak’s multiple comparison test. (B) The pyrimidine nucleotide synthesis pathway. RNR: ribonucleotide reductase; TYMS: thymidylate synthetase; NDPK: nucleoside-diphosphate kinase. (C) RNA expression of Dhodh (left panel) and Dctd (right panel) in SCLC, LUAD/PDAC, and prostate cancer (PROS) cell lines, as assessed by quantitative PCR. Each point represents the mean of 3 technical replicates for one cell line. n = 5 cell lines for SCLC, n = 4 cell lines for LUAD/PDAC (2 each), n = 3 cell lines for PROS. Data are presented as means ± SEM. * p<0.05, ** p<0.01, Mann-Whitney test. (D) Quantification of population doubling rates for SCLC, LUAD/PDAC, and PROS cell lines treated with the indicated concentrations of brequinar (n = 3 technical replicates per condition). For PROS cell lines, SKO: Pten−/− single knockout prostate adenocarcinoma, DKO: Pten−/−; Rb1−/− double knockout prostate neuroendocrine tumor, TKO: Pten−/−; Rb1−/−; Trp53−/− triple knockout prostate neuroendocrine tumor. Data are presented as means ± SEM. (E) In vitro competition assays for LUAD (left panel) and PDAC (right panel) cell lines transduced with the indicated sgRNAs, in the absence (green bars) and presence (brown bars) of brequinar (1 μM for KP1233; 2 μM for MDM1402). Data are normalized to the transduction efficiency at day 0 (n = 3 technical replicates for each sample). Control cells were analyzed at day 3, and brequinar-treated cells were analyzed at day 4. Different days were chosen due to the decrease in rate of cell proliferation resulting from brequinar treatment (see main text and fig. S5). Data are presented as means ± SEM. **** p<0.0001, 2-way ANOVA with Sidak’s multiple comparison test.
Fig. 4.
Fig. 4.. DHODH inhibition suppresses tumor progression and extends survival in various in vivo models of SCLC.
(A) Representative images from in vivo bioluminescence imaging of tumor-bearing animals before the start of drug treatment (left) and after 8 days of treatment with brequinar or vehicle (right). (B) Quantification of tumor burden (as measured by bioluminescence imaging) at different time points after intrasplenic transplantation of luciferase-expressing AD984LNnon cells (n = 5 for both vehicle-treated and brequinar-treated groups). Data are presented as means ± SEM. * p<0.05, ** p<0.01, two-tailed Student’s t-test. (C) Representative images of livers harvested from animals 3 weeks after initiation of treatment with brequinar or vehicle. Livers are placed in petri dishes with a diameter of 100 mm. Left: vehicle; right: brequinar. (D) Quantification of liver tumor burden in animals transplanted with AD984LNnon cells (left panel) or AF3062C cells (right panel) after the indicated treatments, as measured by liver weight at necropsy. For AD984LNnon, n = 5 for all groups. For AF3062C, n = 4 for baseline, n = 4 for vehicle, n = 5 for brequinar. Baseline data were obtained from a separate cohort of animals that was sacrificed 2 weeks after transplantation, before the start of treatment. Treated animals were sacrificed approximately 3 weeks after the start of treatment. Data are presented as means ± SEM. **** p<0.0001, n.s.: not significant, two-tailed Student’s t-test. (E) Survival analysis in animals transplanted intrasplenically with AD984LNnon cells (left panel) or AF3062C cells (right panel), with the indicated treatments. For AD984LNnon, n = 5 for all treatment groups except for vehicle (n = 4). For AF3062C, n = 5 for all treatment groups. ** p<0.01, log-rank (Mantel-Cox) test. (F) Representative magnetic resonance imaging (MRI) images of autochthonous PRp130 SCLC animals with detectable tumor burden before treatment (top) and after 4 weeks of treatment (bottom) with vehicle or brequinar. (G) Quantification of primary tumor burden (as measured by MRI) in autochthonous PRp130 SCLC animals before treatment and after 4 weeks of treatment with vehicle or brequinar (n = 17 for vehicle, n = 15 for brequinar). (H) Quantification of primary tumor burden (left panel) and metastatic liver tumor burden (right panel) in autochthonous PRp130 SCLC animals throughout the duration of treatment with vehicle or brequinar, as measured by MRI. Each line represents a single animal (n = 17 for vehicle, n = 15 for brequinar). The same cohort of animals was used for survival analysis in (I). (I) Survival analysis in autochthonous PRp130 SCLC animals with the indicated treatments (n = 17 for vehicle, n = 15 for brequinar). ** p<0.01, log-rank (Mantel-Cox) test.
Fig. 5.
Fig. 5.. PDX models of SCLC are sensitive to brequinar treatment.
(A) Clinical time point and source of derivation for four SCLC PDX models treated with brequinar. Two models were derived from chemo-naïve patients and two were derived after ≥1 line of therapy. (B) RNA expression of DHODH (left panel) and DCTD (right panel) in the four PDX models, as assessed by quantitative PCR (n = 3 technical replicates per sample). Data are presented as means ± SEM. (C) Spider plots of xenograft volume versus time after start of treatment with brequinar, cisplatin/etoposide, or vehicle. Each line represents a single animal. % ITV = % initial tumor volume. Cisplatin/etoposide treatment data were obtained from Drapkin et al., 2018 (37). (D) Maximum xenograft regression for each model after day +7. Data are presented as means ± SEM. (E) Time (days) from start of treatment to progression, which is defined as the point at which tumors reach twice of the initial tumor volume (2x ITV). Data are presented as means ± SEM.

References

    1. Califano R, Abidin AZ, Peck R, Faivre-Finn C, Lorigan P, Management of small cell lung cancer: recent developments for optimal care. Drugs 72, 471–490 (2012). - PubMed
    1. Demedts IK, Vermaelen KY, van Meerbeeck JP, Treatment of extensive-stage small cell lung carcinoma: current status and future prospects. Eur Respir J 35, 202–215 (2010). - PubMed
    1. Byers LA, Rudin CM, Small cell lung cancer: where do we go from here? Cancer 121, 664–672 (2015). - PMC - PubMed
    1. Grimm S, The art and design of genetic screens: mammalian culture cells. Nat Rev Genet 5, 179–189 (2004). - PubMed
    1. Meuwissen R et al., Induction of small cell lung cancer by somatic inactivation of both Trp53 and Rb1 in a conditional mouse model. Cancer Cell 4, 181–189 (2003). - PubMed

Publication types

MeSH terms