. 2019 Dec 23;58(1):e00540-19.
doi: 10.1128/JCM.00540-19. Print 2019 Dec 23.

Evaluation of WASPLab Software To Automatically Read chromID CPS Elite Agar for Reporting of Urine Cultures

Affiliations

Evaluation of WASPLab Software To Automatically Read chromID CPS Elite Agar for Reporting of Urine Cultures

Matthew L Faron et al. J Clin Microbiol. .

Abstract

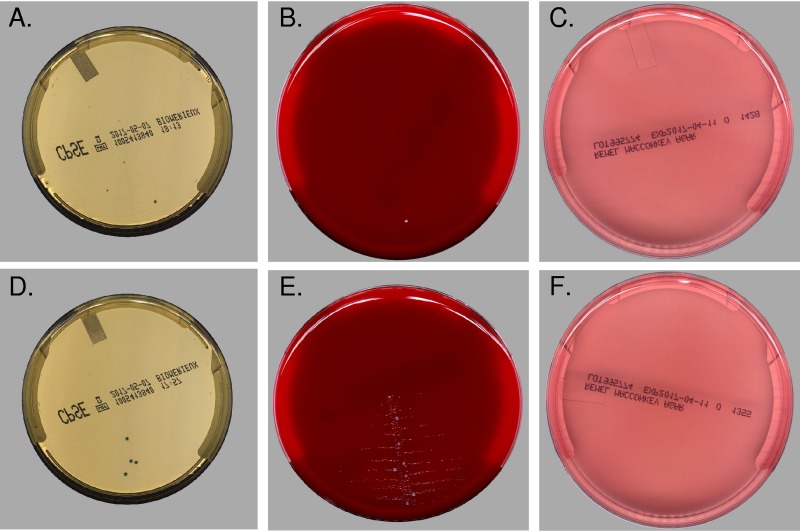
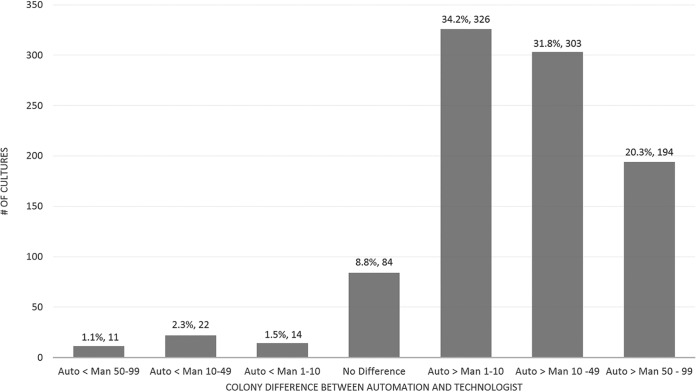
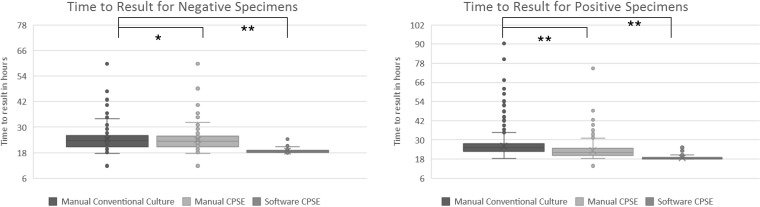
Urine cultures are among the most common specimens received by clinical laboratories and generate a major share of the laboratory workload. Chromogenic agar can expedite culture results, but technologist review is still needed. In this study, we evaluated the ability of the WASPLab software to interpret urine specimens plated onto chromID CPS Elite (CPSE) agar. Urine specimens submitted for bacterial culture were plated onto CPSE agar with a 1-μl loop using the WASP. Each plate was imaged after 0 and 18 h of incubation, and colonies were enumerated by color using the WASPLab software and a technologist's reading from a high-definition (HD) monitor. The results were reported as negative if <10 colonies/plate were detected. Laboratory information system (LIS) time stamps were used to measure the time to result. A total of 1,581 urine cultures were tested. The sensitivity and specificity of the software were 99.8% and 68.5%, respectively, which included 2 manual-positive/automation-negative (MP/AN) results and 170 manual-negative/automation-positive (MN/AP) results. Of the 170 MN/AP specimens, 116 were caused by microcolonies missed by the technologist. The remaining MN/AP results were caused by either count differences near the 10-colony threshold (n = 43) or count differences of >50 CFU (n = 11). The use of both CPSE agar and the WASPLab software improved the time to result for urine culture, reducing the average time to result by 4 h 42 min for negative specimens and 3 h 28 min for positive specimens compared to that with standard-of-care testing. These data demonstrate that the use of CPSE agar and automated plate reading has the potential to improve turnaround time while maintaining high sensitivity and reducing urine culture workload.

Keywords: automation; chromogenic media; urinary tract infection.


Figures

FIG 1
FIG 1
Images of the 2 manual-positive/automation-negative specimens. (A to C) The first specimen (in CPSE, BAP, and MAC agar, respectively) was manually reported as multiple organisms present with 1 pink colony and 100 no-color colonies. Automation reported out 6 colonies, with 2 pink, 2 no color, and 2 microcolonies. Visual reexamination of the images shows 2 pink colonies and 1 white colony. (D to F) The second specimen was manually reported as >100,000 Pseudomonas aeruginosa and 5,000 Gram-positive cocci in chains. Automation reported 2 microcolonies, 2 no-color colonies, and 4 turquoise colonies. The 4 turquoise colonies can be observed in the reexamination of the image, and 7 colonies are seen on the BAP agar (F). When enlarging both the CPSE and BAP plate images, a small dusting of possibly debris or discoloration can be detected, which can also be seen on the time 0 (T0) image (not shown). It is possible that the technologist misinterpreted this as growth. As plates were discarded by discordant analysis, confirmation cannot be confirmed, but the smaller growth is likely the P. aeruginosa, although it is unclear why no growth was observed on the MAC agar. It is possible that the poor growth on the BAP agar reduced the viability on the MAC plate.
FIG 2
FIG 2
Evaluation of the software’s colony count accuracy for specimens containing 1 to 100 CFU. Ranges above 0 indicate higher automation counts. Data do not include specimens reported as >100,000 CFU/ml as the actual manual colony count is unknown. Auto, automated; Man, manual.
FIG 3
FIG 3
Distribution of time of result differences for negative and positive specimens between standard of care, manual CPSE, and software analysis. Significance was determined by a 2-tailed paired Student's t test (*, P = 0.046; **, P < 0.001).

Similar articles

Cited by

References

    1. Foxman B. 2003. Epidemiology of urinary tract infections: incidence, morbidity, and economic costs. Dis Mon 49:53–70. doi:10.1067/mda.2003.7. - DOI - PubMed
    1. Stamm WE, Norrby SR. 2001. Urinary tract infections: disease panorama and challenges. J Infect Dis 183(Suppl 1):S1–S4. doi:10.1086/318850. - DOI - PubMed
    1. Schappert SM, Rechtsteiner EA. 2011. Ambulatory medical care utilization estimates for 2007. Vital Health Stat 13 169:1–38. - PubMed
    1. Foxman B. 2010. The epidemiology of urinary tract infection. Nat Rev Urol 7:653–660. doi:10.1038/nrurol.2010.190. - DOI - PubMed
    1. Wilson ML, Gaido L. 2004. Laboratory diagnosis of urinary tract infections in adult patients. Clin Infect Dis 38:1150–1158. doi:10.1086/383029. - DOI - PubMed