. 2019 Nov 6;11(21):9442-9460.
doi: 10.18632/aging.102395. Epub 2019 Nov 6.

Long noncoding RNA DNM3OS promotes prostate stromal cells transformation via the miR-29a/29b/COL3A1 and miR-361/TGFβ1 axes

Affiliations

Long noncoding RNA DNM3OS promotes prostate stromal cells transformation via the miR-29a/29b/COL3A1 and miR-361/TGFβ1 axes

Ruizhe Wang et al. Aging (Albany NY). .

Abstract

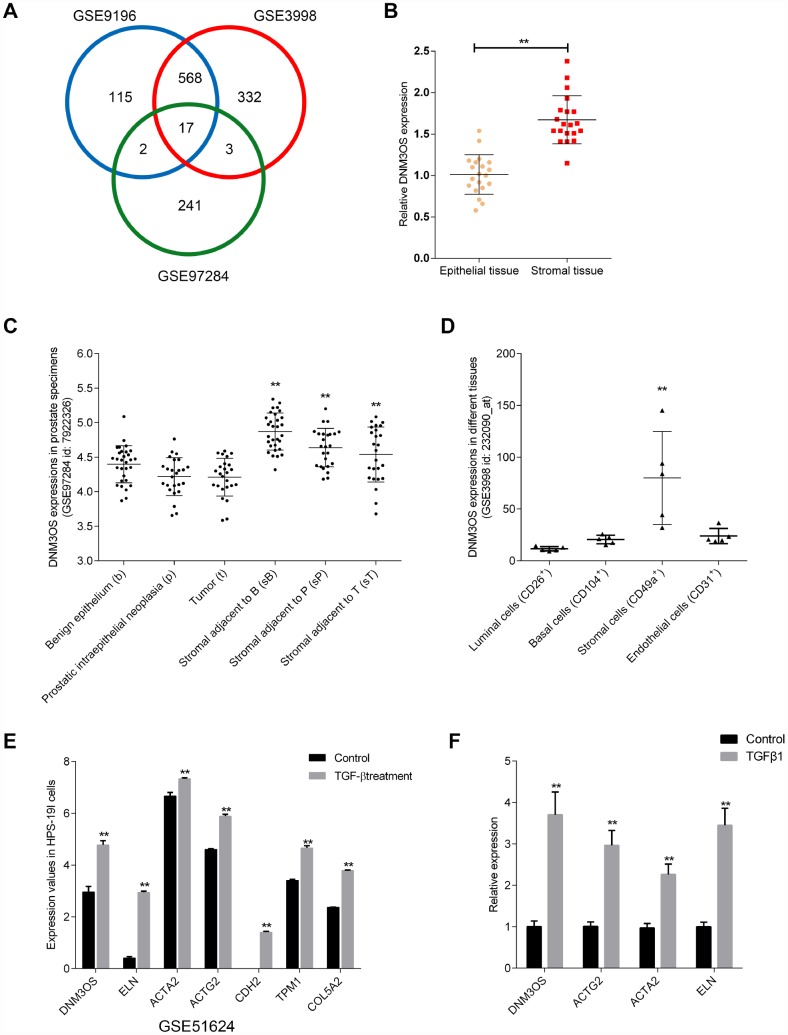
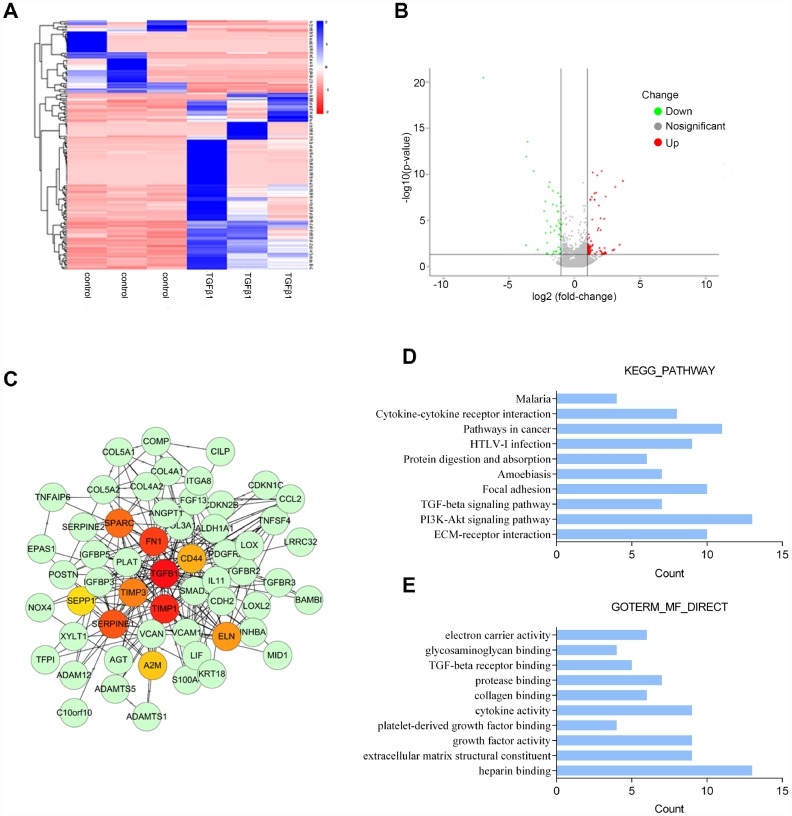
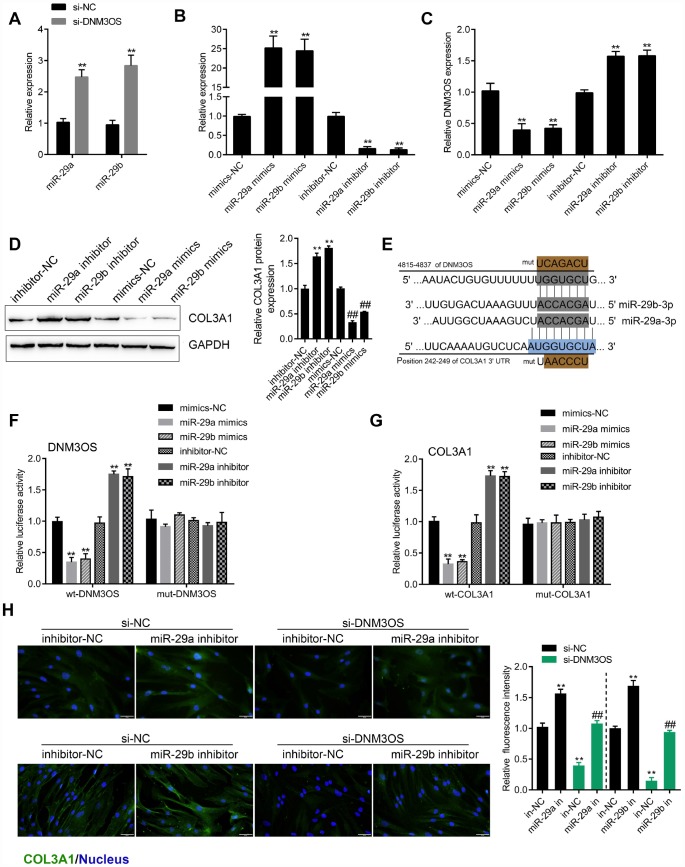
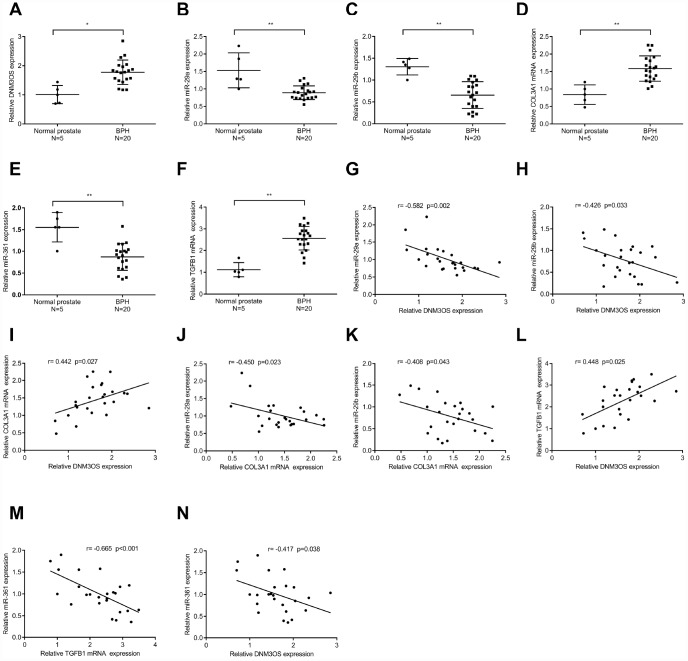
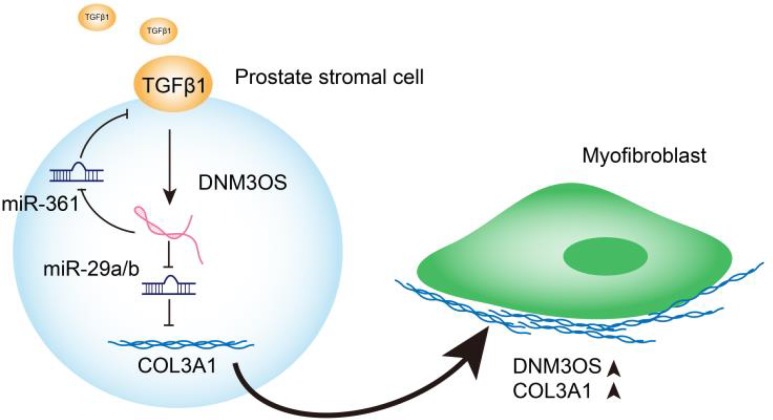
Transforming growth factor-β1 (TGFβ1)-induced differentiation into and the activation of myofibroblasts have been regarded as critical events in benign prostatic hyperplasia (BPH); however, the underlying mechanisms of BPH pathogenesis remain unclear. Microarray profiling, STRING analysis, Kyoto Encyclopedia of Genes and Genomes (KEGG) pathway annotation, and Gene Ontology (GO) enrichment analysis were performed to confirm the candidate genes and long non-coding RNA (lncRNAs) related to BPH. Collagen Type III (COL3A1) was significantly upregulated by TGFβ1 in prostate stromal cells (PrSCs) and might be involved in DNM3OS function in myofibroblasts upon TGFβ1 stimulation. Upon TGFβ1 stimulation, COL3A1 protein was decreased by DNM3OS silencing. miR-29a and miR-29b could directly bind to the DNM3OS and COL3A1 3' untranslated region (UTR)s to negatively regulate their expression, and by serving as a competing endogenous RNAs (ceRNA), DNM3OS competed with COL3A1 for miR-29a/29b binding, therefore counteracting miR-29a/29b-mediated COL3A1 suppression. The effect of DNM3OS silencing on ECM components and TGFβ1 downstream signaling was similar to that of the TGFβ1 inhibitor SB431542. miR-361 could target DNM3OS and TGFβ1; DNM3OS competed for miR-361 binding to counteract miR-361-mediated TGFβ1 suppression. In conclusion, we identified DNM3OS as a specifically-upregulated lncRNA upon TGFβ1 stimulation in PrSCs; by serving as a ceRNA for the miR-29a/29b cluster and miR-361, DNM3OS eliminated miRNA-mediated suppression of COL3A1 and TGFβ1, thereby promoting TGFβ1-induced PrSC transformation into myofibroblasts.

Keywords: COL3A1; TGF-β1; benign prostatic hyperplasia (BPH); lncRNA DNM3OS; miR-29a/29b.


Conflict of interest statement

CONFLICTS OF INTEREST: The authors declare that they have no conflict of interest.

Figures

Figure 1
Figure 1
Selection of lncRNAs associated with benign prostatic hyperplasia (BPH) stroma and highly-expressed in prostate stromal tissues (A) Three microarray profiles reported differentially-expressed lncRNAs in prostate stromal tissues compared to prostatic epithelium (GSE9196, GSE3998, and GSE97284). The expression of lncRNA DNM3OS in (B) epithelial and stroma tissues according to GSE9196; (C) benign epithelium, prostatic intraepithelial neoplasia, tumors, stroma adjacent to benign epithelium, stroma adjacent to prostatic intraepithelial neoplasia, and stromal adjacent to tumor according to GSE97284; and (D) luminal cells, basal cells, stromal cells, and endothelial cells. (E) Differentially- expressed genes in the benign stromal cell line HPS-19I upon TGFβ treatment according to GSE51624. (F) Differentially- expressed genes in primary prostate stromal cells (PrSCs) upon TGFβ treatment. *P<0.05, **P<0.01.
Figure 2
Figure 2
Microarray profile analysis of differentially-expressed genes in PrSCs induced by TGFβ1 analyzed by (A) Hierarchical clustering of gene expression in PrSCs with or without TGFβ1 treatment. (B) Volcano plot showing the differentially- expressed genes. (C) Network diagram of the interaction between upregulated and downregulated genes constructed by STRING analysis and visualized by Cytoscape. (D) KEGG pathway annotation of the differentially-expressed genes. (E) GO enrichment analyses of the differentially-expressed genes.
Figure 3
Figure 3
DNM3OS silencing decreases the protein level of COL3A1 (A) DNM3OS silencing conducted in PrSCs by transfection of si-DNM3OS#1 or si-DNM3OS#2 and confirmed by real-time PCR. PrSCs were transfected with si-DNM3OS in the presence or absence of TGFβ1 and examined for (B) the protein level of COL3A1 by Immunoblotting and (C) the protein content and distribution of COL3A1 by immunofluorescence (IF) staining (scale bar: 20 μM). *P<0.05, **P<0.01 compared to the si-NC group, ## P<0.01 compared to si-NC+TGFβ1 group.
Figure 4
Figure 4
miR-29a and miR-29b directly bind the DNM3OS and COL3A1 3'UTR to negatively regulate their expression (A) PrSCs were transfected with si-DNM3OS and examined for the expression of miR-29a/29b by real-time PCR. (B) miR-29a/29b overexpression or inhibition conducted in PrSCs by transfection of miR-29a/29b mimics or inhibitor and confirmed by real-time PCR. (C) PrSCs were transfected with miR-29a/29b mimics or inhibitor and examined for the expression of DNM3OS by real-time PCR. (D) PrSCs were transfected with miR-29a/29b mimics or inhibitor and examined for the protein levels of COL3A1. (E) A schematic diagram showing the predicted binding sites between miR-29a/29b and DNM3OS or COL3A1. Wild- and mutant-type DNM3OS or COL3A1 3'UTR luciferase reporter vectors were constructed. Mutant-type vectors contained a 7-bp mutation in the predicted miR-29a/29b binding site. (FG) 293T cells were cotransfected with these vectors and miR-29a/29b mimics or inhibitor and examined for luciferase activity. (H) PrSCs were cotransfected with si-DNM3OS and miR-29a/29b inhibitor and examined for the protein content and distribution of COL3A1 by IF staining (scale bar: 50 μM). **P<0.01.
Figure 5
Figure 5
Similar effects of DNM3OS silencing and SB431542 on ECM components and TGFβ1 downstream signaling PrSCs were transfected with si-DNM3OS or treated with the TGFβ1 inhibitor SB431542 and examined for (A) the protein levels of TGFβ1, p-Smad2, and Smad2 by immunoblotting; (BC) the protein content and distribution of α-SMA and Collagen I by IF staining (scale bar: 50 μM) and (D) the protein levels of α-SMA, Collagen I, MMP1, and MMP3 by immunoblotting. **P<0.01.
Figure 6
Figure 6
DNM3OS competes for miR-361 binding to counteract miR-361-mediated TGFβ1 suppression (A) PrSCs were transfected with si-DNM3OS and examined for the expression of miR-361 by real-time PCR. (B) miR-361 overexpression or inhibition conducted in PrSCs by transfection of miR-361 mimics or inhibitor, as confirmed by real-time PCR. (C) PrSCs were transfected with miR-361 mimics or inhibitor and examined for the expression of DNM3OS by real-time PCR. (D) PrSCs were transfected with miR-361 mimics or inhibitor and examined for the protein levels of TGFβ1. (E) A schematic diagram showing the predicted binding sites between miR-361 and DNM3OS or TGFβ1. Wild- and mutant-type DNM3OS or TGFβ1 3'UTR luciferase reporter vectors were constructed. Mutant-type vectors contained a 7- or 10- bp mutation in the predicted miR-361 binding site. (FG) 293T cells were cotransfected with the vectors and miR-361 mimics or inhibitors and examined for luciferase activity. **P<0.01.
Figure 7
Figure 7
The dynamic effects of DNM3OS and miR-361 on TGFβ1 and downstream signaling PrSCs were cotransfected with si-DNM3OS and miR-361 inhibitor and examined for (A) the protein content and distribution of α-SMA by IF staining (scale bar: 50 μM); (B) the protein levels of α-SMA and ACTG2 by immunoblotting and (C) the protein levels of TGFβ1, p-Smad2, and Smad2 by immunoblotting.
Figure 8
Figure 8
The expression and correlation of DNM3OS, miR-29a/29b/361, COL3A1, and TGFβ1 in tissue samples (AF) The expression of DNM3OS, miR-29a/29b/361, COL3A1, and TGFβ1 in normal prostate and BPH tissue samples (n = 20) determined by real-time PCR. (GN) The correlation of DNM3OS, miR-29a/29b/361, COL3A1, and TGFβ1 in tissue samples analyzed by Pearson’s correlation analyses.
Figure 9
Figure 9
Graphical abstract: A schematic diagram of the proposed mechanisms of LncRNA DNM3OS-mediated TGFβ1-induced PrSC transformation into myofibroblasts.

References

    1. Isaacs JT, Coffey DS. Etiology and disease process of benign prostatic hyperplasia. Prostate Suppl. 1989; 2:33–50. 10.1002/pros.2990150506 - DOI - PubMed
    1. Yin Z, Yang JR, Rao JM, Song W, Zhou KQ. Association between benign prostatic hyperplasia, body mass index, and metabolic syndrome in Chinese men. Asian J Androl. 2015; 17:826–30. 10.4103/1008-682x.148081 - DOI - PMC - PubMed
    1. Coffey DS, Walsh PC. Clinical and experimental studies of benign prostatic hyperplasia. Urol Clin North Am. 1990; 17:461–75. - PubMed
    1. Yono M, Yamamoto Y, Imanishi A, Yoshida M, Ueda S, Latifpour J. Differential effects of prazosin and naftopidil on pelvic blood flow and nitric oxide synthase levels in spontaneously hypertensive rats. J Recept Signal Transduct Res. 2008; 28:403–12. 10.1080/10799890802176626 - DOI - PubMed
    1. McNeal JE. Origin and evolution of benign prostatic enlargement. Invest Urol. 1978; 15:340–45. - PubMed

Publication types