. 2019 Nov 6;10(1):5040.
doi: 10.1038/s41467-019-12874-3.

Asynchronous Antarctic and Greenland ice-volume contributions to the last interglacial sea-level highstand

Affiliations

Asynchronous Antarctic and Greenland ice-volume contributions to the last interglacial sea-level highstand

Eelco J Rohling et al. Nat Commun. .

Abstract

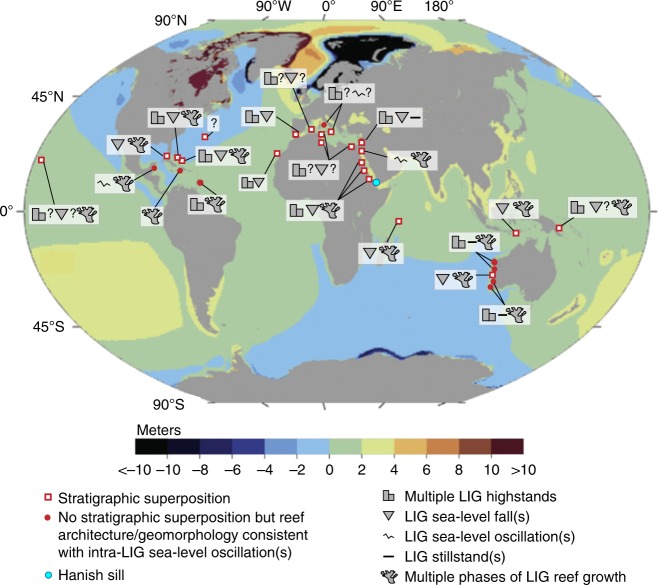
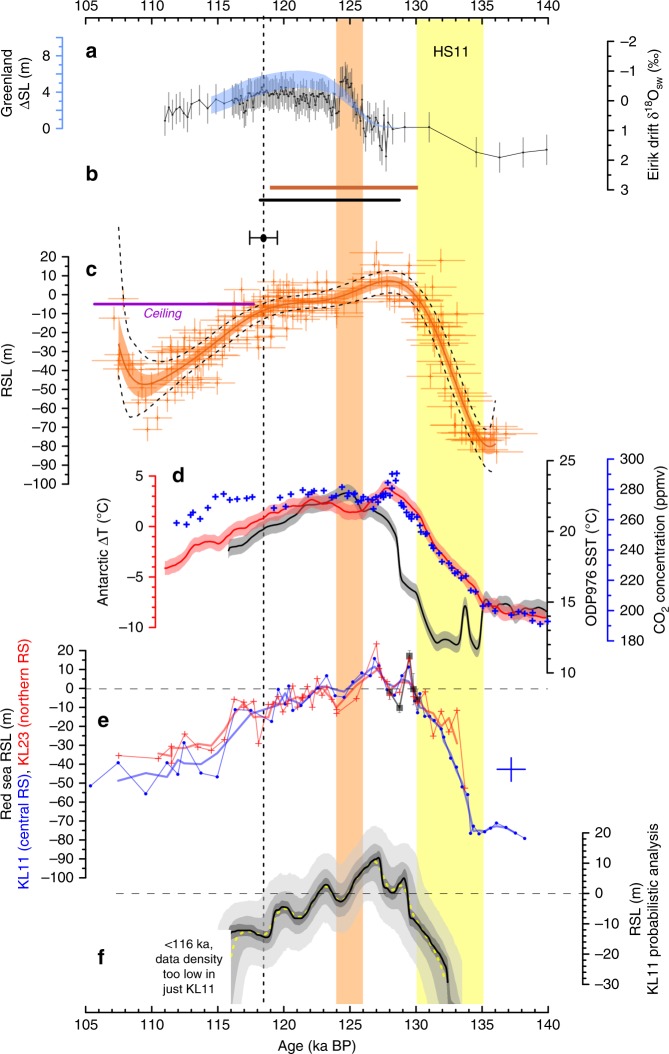
The last interglacial (LIG; ~130 to ~118 thousand years ago, ka) was the last time global sea level rose well above the present level. Greenland Ice Sheet (GrIS) contributions were insufficient to explain the highstand, so that substantial Antarctic Ice Sheet (AIS) reduction is implied. However, the nature and drivers of GrIS and AIS reductions remain enigmatic, even though they may be critical for understanding future sea-level rise. Here we complement existing records with new data, and reveal that the LIG contained an AIS-derived highstand from ~129.5 to ~125 ka, a lowstand centred on 125-124 ka, and joint AIS + GrIS contributions from ~123.5 to ~118 ka. Moreover, a dual substructure within the first highstand suggests temporal variability in the AIS contributions. Implied rates of sea-level rise are high (up to several meters per century; m c-1), and lend credibility to high rates inferred by ice modelling under certain ice-shelf instability parameterisations.


Conflict of interest statement

The authors declare no competing interests.

Figures

Fig. 1
Fig. 1
Global summary of stratigraphic evidence for Last Interglacial sea-level instability in coral-reef deposits and coastal-sediment sequences. Blue dot is the location of Hanish Sill, the constraining point for the Red Sea sea-level record. Red squares with white centres are stratigraphically superimposed coral reef or sedimentary archives for sea-level oscillations within the Last Interglacial (LIG). Solid red dots are locations where sea-level oscillations are inferred but where there is no stratigraphic superposition. The underlying map is of the difference between maximum Last Interglacial (LIG) relative sea level (RSL) values for glacio-isostatic adjustment (GIA) modelling results based on two contrasting ice models (ICE-1 and ICE-3) for the penultimate glaciation using Earth model E1 (VM1-like set up). The ICE-1 model is a version of the ICE-5G ice history (LGM-like), whereas ICE-3 has both reduced total ice volume relative to ICE-1, and a different ice-mass distribution (i.e., a smaller North American Ice Sheet complex and larger Eurasian Ice Sheet) that is consistent with glaciological reconstructions of the penultimate glacial period
Fig. 2
Fig. 2
Variability in Last Interglacial sea-level time-series. Yellow bar: time-interval of Heinrich Stadial 11 (HS11). Orange bar: approximate interval of temporary sea-level drop in various records. Dashed line: end of main LIG highstand set to 118.5 ka (cross-bar indicates 95% confidence limits of ±1.2 ka), based on compilations in b and the speleothem sea-level “ceiling” (c). a GrIS contributions to sea level from a model-based assessment of Greenland ice-core data (blue), and changes in surface sea-water δ18O at Eirik Drift (black; this study) with uncertainties (2σ) determined from underpinning δ18O and Mg/Ca measurement uncertainties and Mg/Ca calibration uncertainties. b Ninety-five per cent probability interval for coral sea-level markers above 0 m (brown), and LIG duration from a previous compilation (black). c Red Sea RSL stack (red, including KL23) with 1σ error bars. Smoothings are shown to highlight general trends only, and represent simple polynomial regressions with 68% and 95% confidence limits (orange shading and black dashes, respectively). Purple line indicates the sea-level “ceiling” indicated by subaerial speleothem growth (Yucatan). d Probability maximum (PM, lines) and its 95% confidence interval for Antarctic temperature changes (red), and proxy for eastern Atlantic water temperature (ODP976, grey). Blue crosses: composite record of atmospheric CO2 concentrations from Antarctic ice cores. e Individual records for Red Sea cores KL11 (blue, dots) and KL23 (red, plusses), with 300-year moving Gaussian smoothings (as used in ref. ). Also shown is a replication exercise to validate the single-sample earliest-LIG peak in KL23 (grey, filled squares) with 1 standard error intervals (bars, σ/√{N}, based on N = 5, 5, 4, 4, and 5 replications, from youngest to oldest sample, respectively). Separate blue cross indicates typical uncertainties (1σ) in individual KL11 datapoints prior to probabilistic analysis of the record. f Probabilistic analysis of the KL11 Red Sea RSL record, taking into account the strict stratigraphic coherence of this record. Results are reported for the median (50th percentile, dashed yellow), PM (modal value, black), the 95% probability interval of the PM (dark grey shading), and both the 68% and 95% probability intervals for individual datapoints (intermediate and light grey shading, respectively)
Fig. 3
Fig. 3
Identification of Greenland Ice Sheet and Antarctic Ice Sheet contributions to Last Interglacial sea-level variations. a Global Mean Sea Level (GMSL) approximation based on the probabilistically assessed KL11 PM (black line) and its 95% probability interval (grey). This record is shown in terms of RSL in Fig. 2f, but here includes the glacio-isostatic correction and its propagated uncertainty. Black triangles identify limits between which sea-level rises R1, R2, and R3 were measured. Rates of rise with 95% bounds: R1 = 2.8 (1.2–3.7) m c−1; R2 = 2.3 (0.9–3.5) m c−1; R3 = 0.6 (0.1–1.3) m c−1. b Blue: GrIS sea-level contribution from the model-data assimilation of ref. (shading represents the 95% probability interval). Grey: GrIS contribution based on Eirik Drift δ18Osw. Uncertainties as in Fig. 2a. Orange: AIS contribution from subtraction of the blue GrIS reconstruction from the record in a. Green: AIS contribution found by subtracting the grey GrIS reconstruction from the record in a. Orange and green AIS reconstructions are shown as medians (lines) and 95% confidence intervals (shading). Reconstructed AIS contributions cross downward through a fine dashed when they fall below –10 m, which indicates a rough maximum AIS growth limit in terms of sea-level lowering (AIS growth is limited by Antarctic continental shelf edges). When the green/orange curves fall below these limits, North American and/or Eurasian ice-sheet growth is likely implied. The key result from the present study lies in identification of GrIS and AIS sea-level contributions above 0 m. c Southern Ocean ODP (Ocean Drilling Program) Site 1094 authigenic uranium mass accumulation rates, on its original, Antarctic Ice Core Chronology (AICC2012) tuned, age model. Dashed lines indicate potential offsets (within uncertainties) between the ODP 1094 AICC2012-based chronology and our LIG chronology (see refs. , and this study)
Fig. 4
Fig. 4
Timing of Antarctic Ice Sheet retreat relative to circum-Antarctic climate and ocean warming. LIG records of a. Antarctic ice core composite atmospheric CO2 (ref. ), b EPICA Dome C sea-salt Na flux (on a logarithmic scale), which reflects Southern Ocean sea-ice extent, c Vostok δD (lilac),, d Site 1089 planktic foraminiferal (G. bulloides) δ18O (red), e Site 1094 TEX86L-based sea surface temperatures (orange), f Site 1089 planktic minus benthic foraminiferal δ18O (‰) plotted as 3-point running mean (red) and sample average including combined 1-sigma uncertainty (light red shading), g Site 1094 authigenic uranium (aU) accumulation where higher values indicate bottom-water deoxygenation, h Site 1063 εNd (dark blue, measured by MC-ICP-MS; light blue, measured by TIMS), and i bottom-water δ13C records from Site 1063 (blue, 3-point running mean, based on benthic foraminifera Cibicidoides wuellerstorfi, Melonis pompilioides, and Oridorsalis), MD03–2664 (yellow, 3-point running mean, C. wuellerstorfi), Site 1089 (red, C. wuellerstorfi), and Site 1094 (orange, C. wuellerstorfi). h and i Indicate North Atlantic Deep Water (NADW) influence as denoted. Map inset includes marine core locations, plotted using Ocean Data View (https://odv.awi.de)

References

    1. Rohling EJ, et al. High rates of sea-level rise during the last interglacial period. Nat. Geosci. 2008;1:38–42. doi: 10.1038/ngeo.2007.28. - DOI
    1. Kopp RE, Simons FJ, Mitrovica JX, Maloof AC, Oppenheimer M. Probabilistic assessment of sea level during the last interglacial stage. Nature. 2009;462:863–867. doi: 10.1038/nature08686. - DOI - PubMed
    1. Dutton A, Webster JM, Zwartz D, Lambeck K, Wohlfarth B. Tropical tales of polar ice: evidence of Last Interglacial polar ice sheet retreat recorded by fossil reefs of the granitic Seychelles islands. Quat. Sci. Rev. 2015;107:182–196. doi: 10.1016/j.quascirev.2014.10.025. - DOI
    1. Rohling EJ, et al. Differences between the last two glacial maxima and implications for ice-sheet, δ18O, and sea-level reconstructions. Quat. Sci. Rev. 2017;176:1–28. doi: 10.1016/j.quascirev.2017.09.009. - DOI
    1. McKay NP, Overpeck JT, Otto-Bliesner BL. The role of ocean thermal expansion in Last Interglacial sea level rise. Geophys. Res. Lett. 2011;38:L14605. doi: 10.1029/2011GL048280. - DOI

Publication types