. 2019 Nov 6;10(1):5029.
doi: 10.1038/s41467-019-13036-1.

Evaluation of 16S rRNA gene sequencing for species and strain-level microbiome analysis

Affiliations

Evaluation of 16S rRNA gene sequencing for species and strain-level microbiome analysis

Jethro S Johnson et al. Nat Commun. .

Abstract

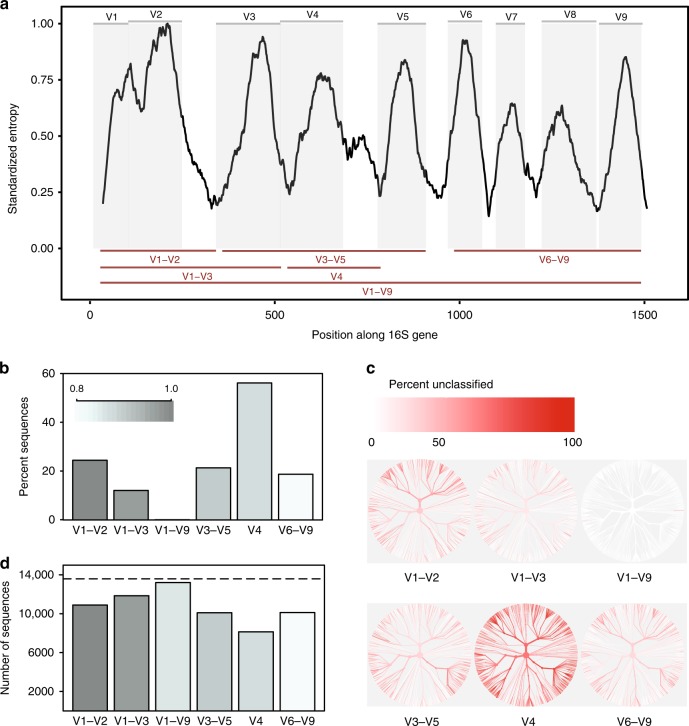
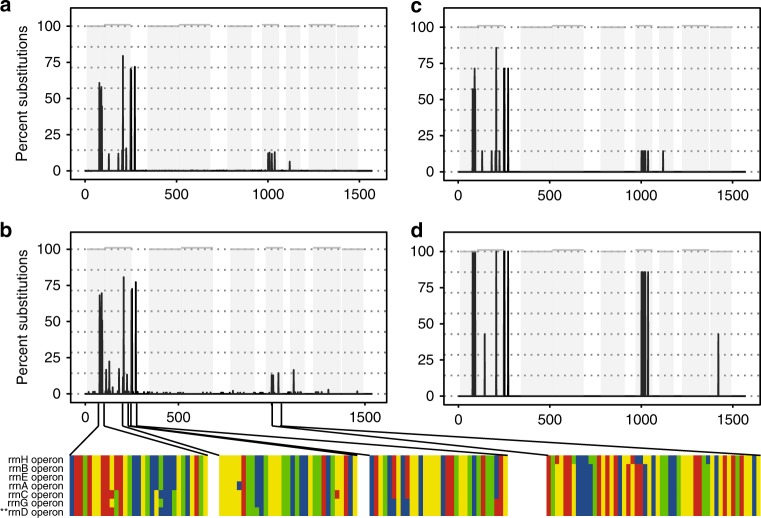
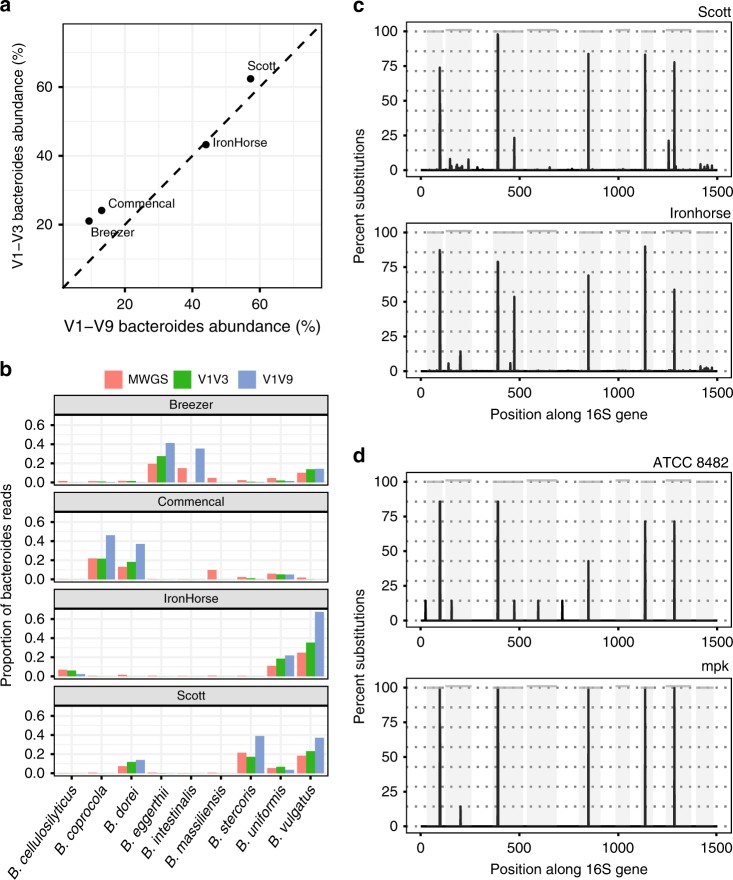
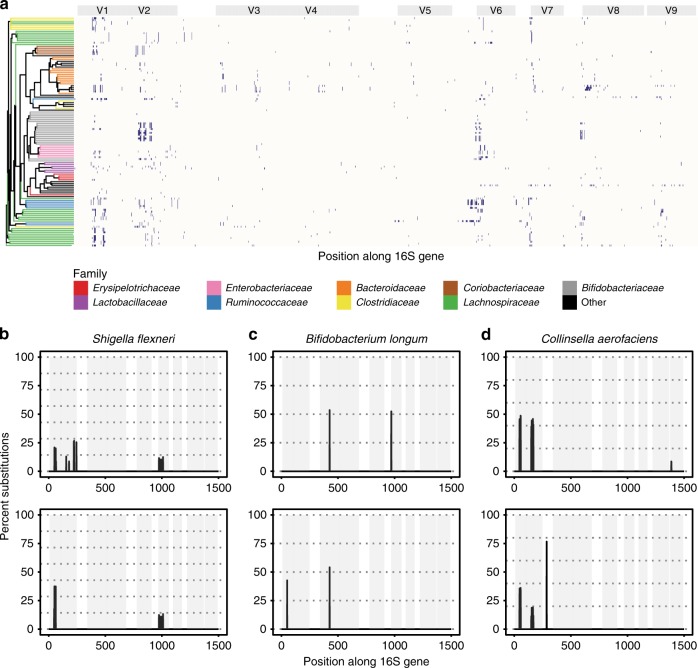
The 16S rRNA gene has been a mainstay of sequence-based bacterial analysis for decades. However, high-throughput sequencing of the full gene has only recently become a realistic prospect. Here, we use in silico and sequence-based experiments to critically re-evaluate the potential of the 16S gene to provide taxonomic resolution at species and strain level. We demonstrate that targeting of 16S variable regions with short-read sequencing platforms cannot achieve the taxonomic resolution afforded by sequencing the entire (~1500 bp) gene. We further demonstrate that full-length sequencing platforms are sufficiently accurate to resolve subtle nucleotide substitutions (but not insertions/deletions) that exist between intragenomic copies of the 16S gene. In consequence, we argue that modern analysis approaches must necessarily account for intragenomic variation between 16S gene copies. In particular, we demonstrate that appropriate treatment of full-length 16S intragenomic copy variants has the potential to provide taxonomic resolution of bacterial communities at species and strain level.


Conflict of interest statement

The authors declare no conflict of interest.

Figures

Fig. 1
Fig. 1
In-silico comparison of 16S rRNA variable regions. a Shannon entropy across the 16S gene based on the alignment of a single representative sequence for each known species present in the Greengenes database. Sequences were aligned against a single reference 16S gene for Escherichia coli K-12 MG1655 (NCBI Gene ID 947777). Gray panels depict variable regions defined by commonly used primer-binding sites (Supplementary Table 1). Variable regions considered in this study are shown as red lines (bottom). b Proportion of sequences for each variable region that could not be identified to species level when classifying each sequence against the reference database from which it was derived at a confidence threshold of 80% (RDP classifier). c Trees based on taxonomy of sequences present in the in-silico database. The same tree is provided for each variable region. The color of each branch reflects the proportion of sequences within each clade that could not be identified to species level. d The number of OTUs created when clustering sequences for each variable region at 99% sequence similarity. Dashed line indicates the number of unique sequences (>1% different) in the original database. Source data are provided as a Source Data file
Fig. 2
Fig. 2
Polymorphisms in E. coli 16S rRNA gene sequences. a The position and frequency of substitutions appearing in E. coli strain K-12 MG1655 V1–V9 amplicons generated from our mock community and sequenced on the PacBio RS II platform. b The position and frequency of substitutions in reads generated from genomic sequencing of the isolated E. coli strain K-12 MG1655 on the Illumina MiSeq platform. Magnified regions show respective positions in the alignment of all seven 16S genes present in the E. coli K-12 MG1655 reference genome. The 16S sequence from the rrnD operon (**) is used as the reference for all SNP phasing. c The predicted nucleotide substitution profile of E. coli K-12 MG1655 based on aligning the seven 16S gene sequences present in the reference genome. d The predicted substitution profile of E. coli O157 Sakai based on aligning the seven 16S gene sequences present in the reference genome. Gray panels depict variable regions defined by commonly used primer-binding sites (Supplementary Table 1). Dashed lines indicate the expected proportion of nucleotide substitutions, given there are seven 16S gene copies within each genome. Source data are provided as a Source Data file
Fig. 3
Fig. 3
Detecting Bacteroides in human stool samples. a The relative abundance of the genus Bacteroides in four human stool samples quantified using either V1–V9 amplicons (x-axis) or V1–V3 amplicons (y-axis). b The relative abundance of Bacteroides species in the same four samples. Species abundance was quantified from mWGS sequencing or from V1–V3/V1–V9 OTUs generated at 99% identity. Abundance is shown for the most abundant species as quantified by mWGS (for abundance estimates of all Bacteroides species detected by each platform, see Supplementary Table 5). c Nucleotide substitution profiles generated by aligning all V1–V9 amplicon sequences assigned to the single OTU identified as Bacteroides vulgatus. Profiles are shown for the two stool samples with high B. vulgatus relative abundance (IronHorse and Scott). d Nucleotide substitution profiles predicted from the reference genomes of two different B. vulgatus strains ATCC 8482 and mpk. In both c and d, nucleotide substitutions were identified relative to a single reference 16S gene for B. vulgatus ATCC 8482 (NCBI Gene ID 5304800). Gray panels depict variable regions defined by commonly used primer-binding sites (Supplementary Table 1). Dashed lines indicate the expected proportion of nucleotide substitutions, given there are seven 16S gene copies within each genome. Source data are provided as a Source Data file
Fig. 4
Fig. 4
Intragenomic 16S gene polymorphisms in human gut microbiome isolates. a Location of SNPs present in the 16S genes of individually cultured bacterial isolates. SNP locations were identified through phasing full-length 16S gene sequences generated for each individual isolate. X-axis denotes position along the 16S gene. Y-axis denotes individual isolates clustered based on their inferred phylogeny. Dark blue region indicates the location of a polymorphism. For clarity, a maximum of five isolates belonging to the same species are shown. For details of nucleotide substitution profiles for all sequenced isolates, see Supplementary Data 2. bd Examples of nucleotide substitution profiles showing strain-level differences between isolates identified as belonging to three bacterial species: b Shigella flexneri; c Bifidobacterium longum; d Collinsella aerofaciens. For each species, two isolate nucleotide substitution profiles are shown; however, additional examples can be found in Supplementary Data 2. Isolates were identified as belonging to the same species if their representative sequences were assigned to the same OTU when clustering at 99% sequence identity. Taxonomic identification was performed using BLAST to align representative sequences to the NCBI 16S BLAST database (see Methods). Gray panels depict variable regions defined by commonly used primer-binding sites (Supplementary Table 1). Dashed lines indicate the expected proportion of nucleotide substitutions, given the number of 16S gene copies predicted for each genome. Source data are provided as a Source Data file

References

    1. Schloss PD, Handelsman J. Introducing DOTUR, a computer program for defining operational taxonomic units and estimating species richness. Appl. Environ. Microbiol. 2005;71:1501. doi: 10.1128/AEM.71.3.1501-1506.2005. - DOI - PMC - PubMed
    1. Fitz-Gibbon S, et al. Propionibacterium acnes strain populations in the human skin microbiome associated with acne. J. Invest. Dermatol. 2013;133:2152–2160. doi: 10.1038/jid.2013.21. - DOI - PMC - PubMed
    1. Jiao X, et al. A benchmark study on error assessment and quality control of CCS reads derived from the PacBio RS. J. Datamining Genomics Proteom. 2013;4:1–5. - PMC - PubMed
    1. Li C, et al. INC-Seq: accurate single molecule reas using nanopore sequencing. GigaScience. 2016;5:34. doi: 10.1186/s13742-016-0140-7. - DOI - PMC - PubMed
    1. Callahan BJ, et al. DADA2: high-resolution sample inference from Illumina amplicon data. Nat. Methods. 2016;13:581. doi: 10.1038/nmeth.3869. - DOI - PMC - PubMed

Publication types