. 2019 Nov 6;10(1):5032.
doi: 10.1038/s41467-019-13049-w.

Measuring the shape of the biodiversity-disease relationship across systems reveals new findings and key gaps

Affiliations

Measuring the shape of the biodiversity-disease relationship across systems reveals new findings and key gaps

Fletcher W Halliday et al. Nat Commun. .

Abstract

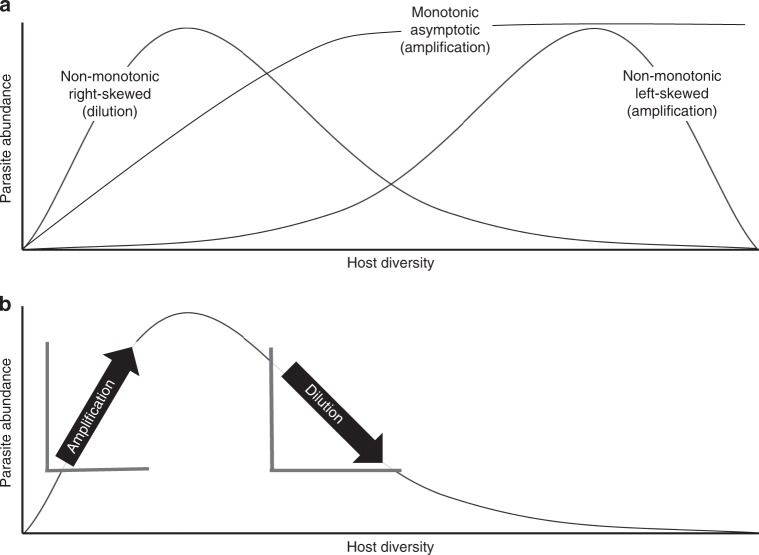
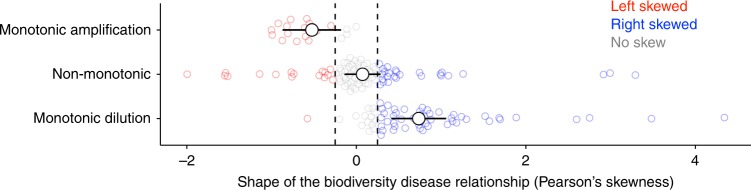
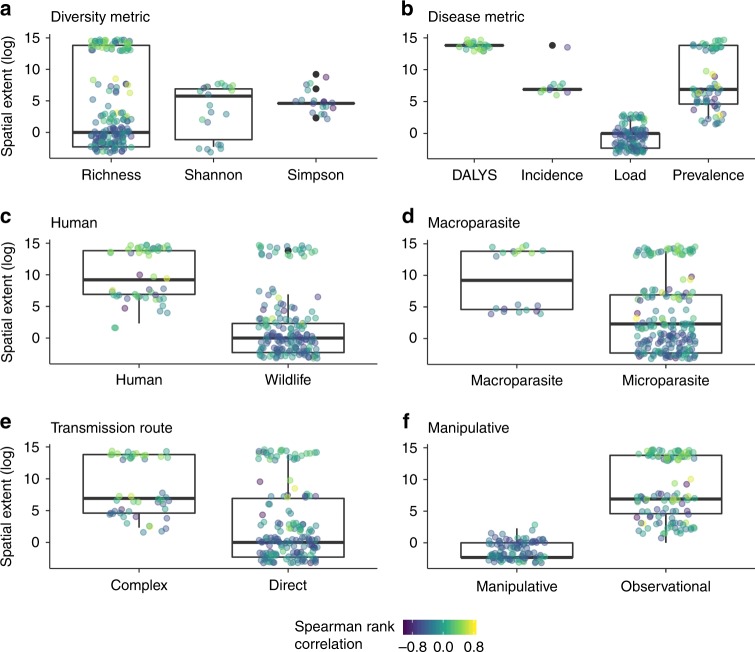
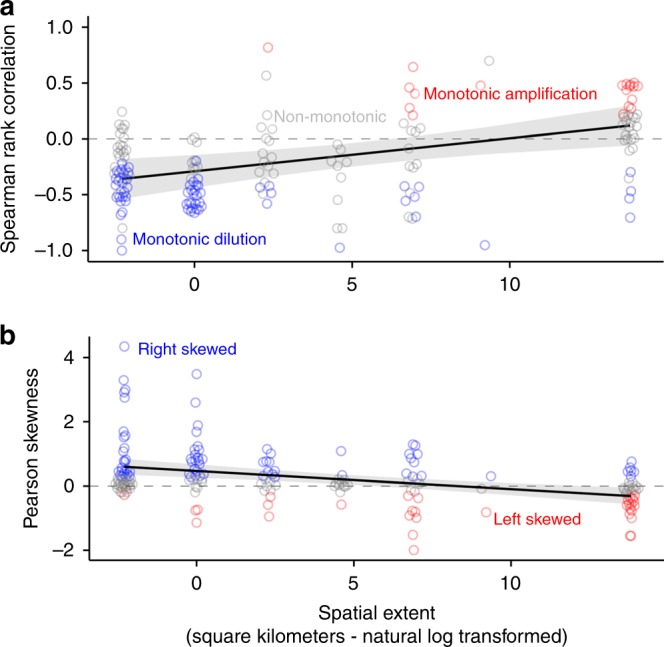
Diverse host communities commonly inhibit the spread of parasites at small scales. However, the generality of this effect remains controversial. Here, we present the analysis of 205 biodiversity-disease relationships on 67 parasite species to test whether biodiversity-disease relationships are generally nonlinear, moderated by spatial scale, and sensitive to underrepresentation in the literature. Our analysis of the published literature reveals that biodiversity-disease relationships are generally hump-shaped (i.e., nonlinear) and biodiversity generally inhibits disease at local scales, but this effect weakens as spatial scale increases. Spatial scale is, however, related to study design and parasite type, highlighting the need for additional multiscale research. Few studies are unrepresentative of communities at low diversity, but missing data at low diversity from field studies could result in underreporting of amplification effects. Experiments appear to underrepresent high-diversity communities, which could result in underreporting of dilution effects. Despite context dependence, biodiversity loss at local scales appears to increase disease, suggesting that at local scales, biodiversity loss could negatively impact human and wildlife populations.


Conflict of interest statement

The authors declare no competing interests.

Figures

Fig. 1
Fig. 1
Hypothetical relationships between biodiversity and disease risk. a A non-monotonic right-skewed distribution suggests that dilution might occur more frequently, but less intensely than amplification because the relationship is moderately negative over a greater portion of the biodiversity gradient than it is strongly positive. A non-monotonic left-skewed distribution suggests that amplification might occur more frequently but less intensely than dilution, because the relationship is moderately positive over a greater portion of the biodiversity gradient than it is strongly negative. A monotonic and asymptotic distribution suggests that amplification becomes increasingly moderate with biodiversity. b In addition to the shape of biodiversity–disease relationships, the location on the curve where biodiversity levels are observed will also affect the likelihood and intensity of dilution and amplification. For example, in a right-skewed biodiversity–disease relationship, collecting measurements at biodiversity beyond the peak of parasite abundance could lead researchers to conclude that there is was a linear dilution effect, whereas measurements before the peak of parasite abundance would lead researchers to conclude that there was a linear amplification effect
Fig. 2
Fig. 2
Results of the analysis comparing Spearman rank correlation to Pearson’s skewness. Points are model-estimated means and error bars are 95% confidence intervals. The colored points show the distribution of the raw data. Left-skewed relationships (Pearson’s skewness < 0.25) are shown in red, right-skewed relationships (Pearson’s skewness > 0.25) are shown in blue, and non-skewed relationships are shown in gray. Spearman rank correlation was strongly associated with Pearson’s skewness: monotonic amplification effects (ρ > 0, Spearman p < 0.05) tended to be left-skewed, monotonic dilution effects (ρ < 0, Spearman p < 0.05) were right skewed, and non-monotonic relationships were not significantly skewed. Source data are provided as a Source Data file
Fig. 3
Fig. 3
Relationship between spatial extent and ecological factors. a host diversity metric, b disease metric, c parasites that infect humans vs. wildlife, d macro- vs. microparasites, e parasites with complex vs. direct lifecycles, and f observational vs. manipulative studies. Each point represents an individual study, colored by the Spearman rank correlation coefficient for the study, with numbers below zero (purple and dark-blue) indicating monotonic dilution and numbers above zero (light-green and yellow) indicating monotonic amplification effects. The box shows the first and third quartiles, the middle line shows the median, and the whiskers extend from the box to the largest and smallest values, no more than 1.5 × the interquartile range. Source data are provided as a Source Data file
Fig. 4
Fig. 4
Results of the analyses relating spatial scale to the shape of the biodiversity–disease relationship. Points represent each published biodiversity–disease relationship, colored by their estimated shape (red = monotonic amplification in a and left-skewed in b; blue = monotonic dilution in a and right-skewed in b; gray = non-significant or non-monotonic in a non-skewed in b). Solid lines indicate the estimated fit of a multilevel random effects model, and gray ribbons indicate the 95% confidence intervals. Spatial scale moderates the relationship between biodiversity and disease: a Spearman rank correlation between biodiversity and disease was positively associated with spatial extent, and b Pearson’s skewness was negatively associated with spatial extent. Source data are provided as a Source Data file
Fig. 5
Fig. 5
Results of constraining biodiversity–disease relationships to pass through the origin. The top two rows show Pearson’s skewness for unconstrained curves, and curves that were constrained to pass through the origin, with each study connected by a solid line. Left-skewed relationships (Pearson’s skewness < 0.25) are shown in red, right-skewed relationships (Pearson’s skewness > 0.25) are shown in blue, and non-skewed relationships are shown in gray. The bottom row shows the model-estimated effect of constraining the curves to pass through the origin, with the point indicating the model-estimated mean, and error bars showing the 95% confidence interval. On average, constraining curves to pass through the origin results in a more left-skewed relationship between biodiversity and disease. Source data are provided as a Source Data file

References

    1. Keesing F, Holt RD, Ostfeld RS. Effects of species diversity on disease risk. Ecol. Lett. 2006;9:485–498. doi: 10.1111/j.1461-0248.2006.00885.x. - DOI - PubMed
    1. Wood CL, Lafferty KD. Biodiversity and disease: a synthesis of ecological perspectives on Lyme disease transmission. Trends Ecol. Evol. 2013;28:239–247. doi: 10.1016/j.tree.2012.10.011. - DOI - PubMed
    1. Civitello DJ, et al. Biodiversity inhibits parasites: broad evidence for the dilution effect. Proc. Natl. Acad. Sci. 2015;112:8667–8671. doi: 10.1073/pnas.1506279112. - DOI - PMC - PubMed
    1. Ostfeld, R. S. & Keesing, F. Is biodiversity bad for your health? Ecosphere8, e01676 (2017).
    1. Keesing F, et al. Impacts of biodiversity on the emergence and transmission of infectious diseases. Nature. 2010;468:647–652. doi: 10.1038/nature09575. - DOI - PMC - PubMed

Publication types