

Vertical distribution of aerosols in dust storms during the Arctic winter
- PMID: 31695067
- PMCID: PMC6834589
- DOI: 10.1038/s41598-019-51764-y
Vertical distribution of aerosols in dust storms during the Arctic winter
Abstract
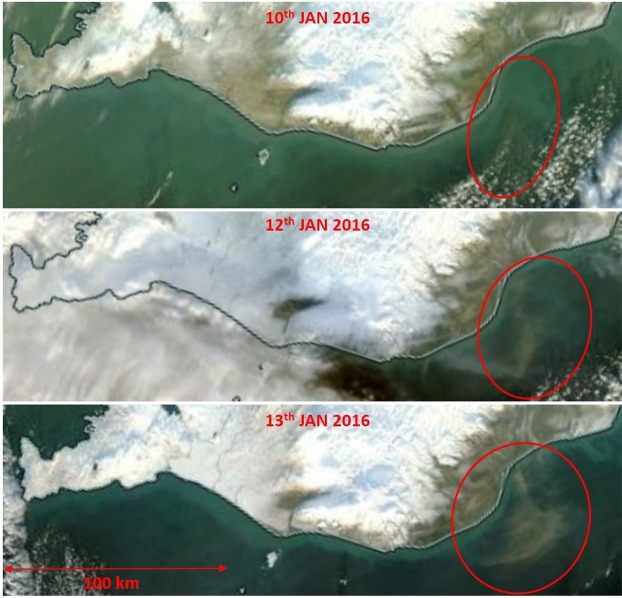
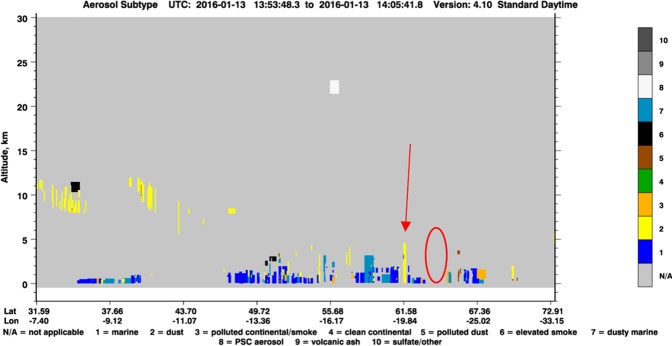
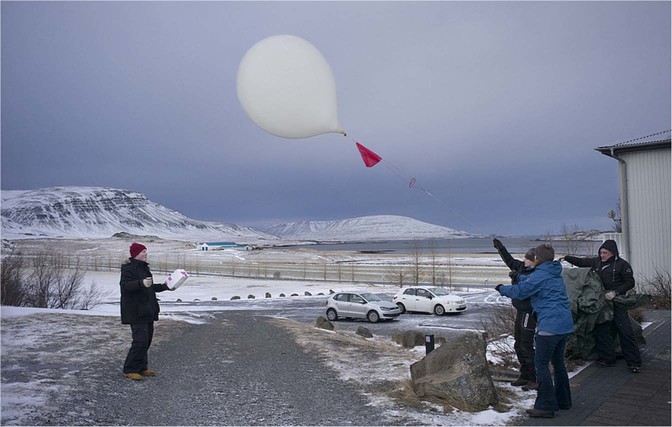
High Latitude Dust (HLD) contributes 5% to the global dust budget, but HLD measurements are sparse. Dust observations from Iceland provide dust aerosol distributions during the Arctic winter for the first time, profiling dust storms as well as clean air conditions. Five winter dust storms were captured during harsh conditions. Mean number concentrations during the non-dust flights were <5 particles cm-3 for the particles 0.2-100 µm in diameter and >40 particles cm-3 during dust storms. A moderate dust storm with >250 particles cm-3 (2 km altitude) was captured on 10th January 2016 as a result of sediments suspended from glacial outburst flood Skaftahlaup in 2015. Similar concentrations were reported previously in the Saharan air layer. Detected particle sizes were up to 20 µm close to the surface, up to 10 µm at 900 m altitude, up to 5 µm at 5 km altitude, and submicron at altitudes >6 km. Dust sources in the Arctic are active during the winter and produce large amounts of particulate matter dispersed over long distances and high altitudes. HLD contributes to Arctic air pollution and has the potential to influence ice nucleation in mixed-phase clouds and Arctic amplification.
Conflict of interest statement
The authors declare no competing interests.
Figures


References
-
- Bond TC, et al. Bounding the role of black carbon in the climate system: a scientific assessment. J. Geophys. Res. Atmos. 2013;118:5380–5552. doi: 10.1002/jgrd.50171. - DOI
-
- Najafi MR, Zwiers FW, Gillett NP. Attribution of Arctic temperature change to greenhouse-gas and aerosol influences. Nat. Clim. Change. 2015;5:246–249. doi: 10.1038/nclimate2524. - DOI
-
- Sand M, et al. Aerosols at the Poles: An AeroCom Phase II multi-model evaluation. Atmos. Chem. Phys. 2017;17:12197–12218. doi: 10.5194/acp-17-12197-2017. - DOI
-
- Boy M, et al. Interactions between the atmosphere, cryosphere and ecosystems at northern high latitudes. Atmos. Chem. Phys. 2019;19:2015–2061. doi: 10.5194/acp-19-2015-2019. - DOI
-
- Goldenson N, et al. Arctic climate response to forcing from light-absorbing particles in snow and sea ice in CESM. Atmos. Chem. Phys. 2012;12:7903–7920. doi: 10.5194/acp-12-7903-2012. - DOI
Publication types
LinkOut - more resources
Full Text Sources
