. 2019 Nov;26(11):1063-1070.
doi: 10.1038/s41594-019-0323-x. Epub 2019 Nov 6.

An ultra high-throughput method for single-cell joint analysis of open chromatin and transcriptome

Affiliations

An ultra high-throughput method for single-cell joint analysis of open chromatin and transcriptome

Chenxu Zhu et al. Nat Struct Mol Biol. 2019 Nov.

Abstract

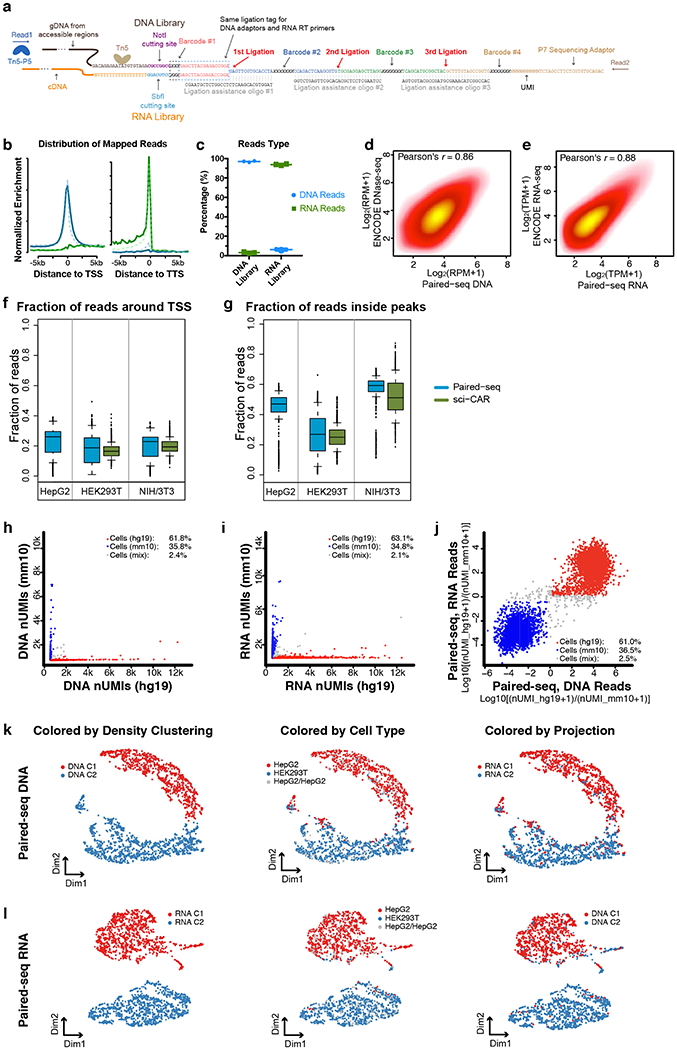
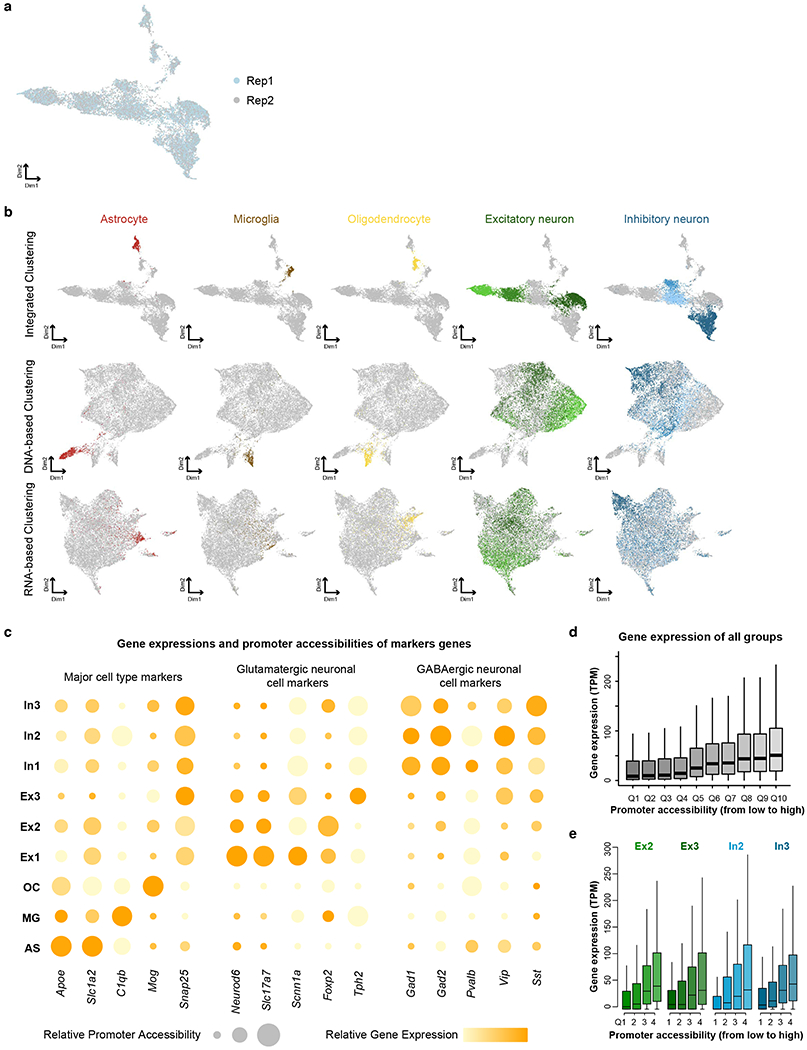
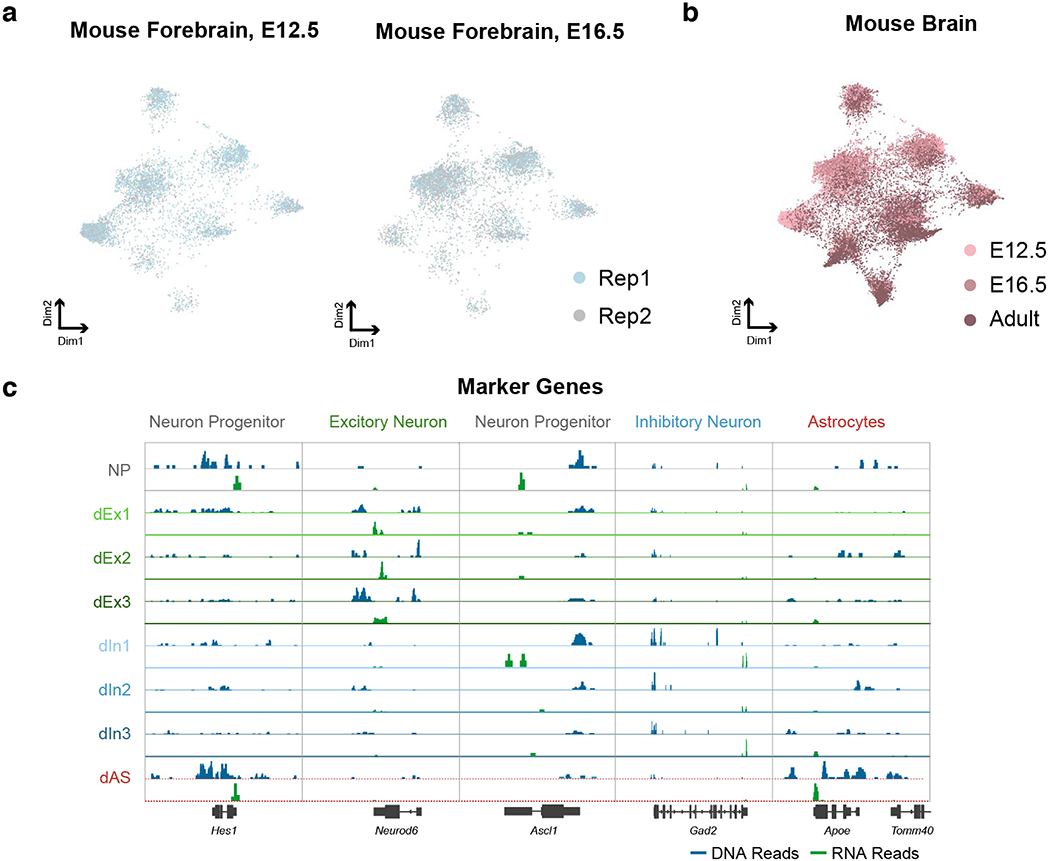
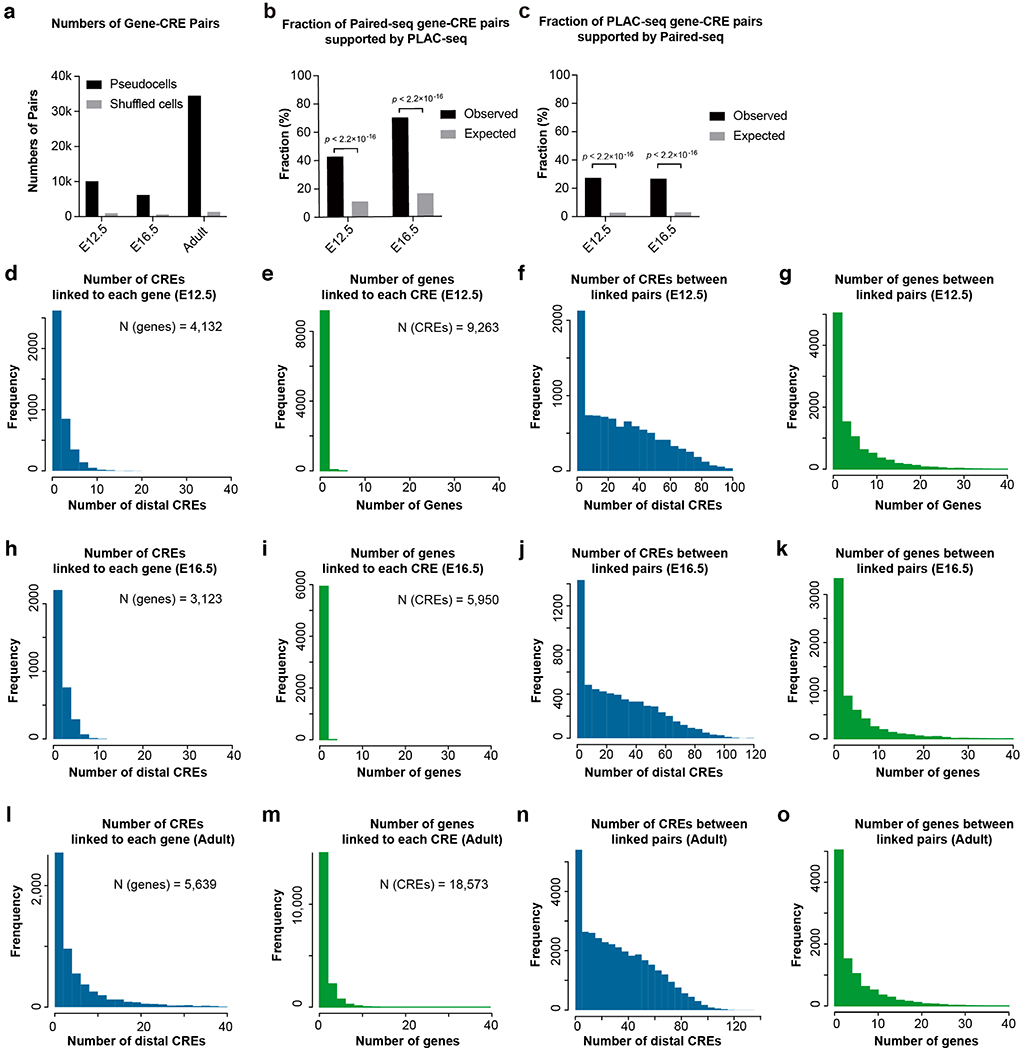
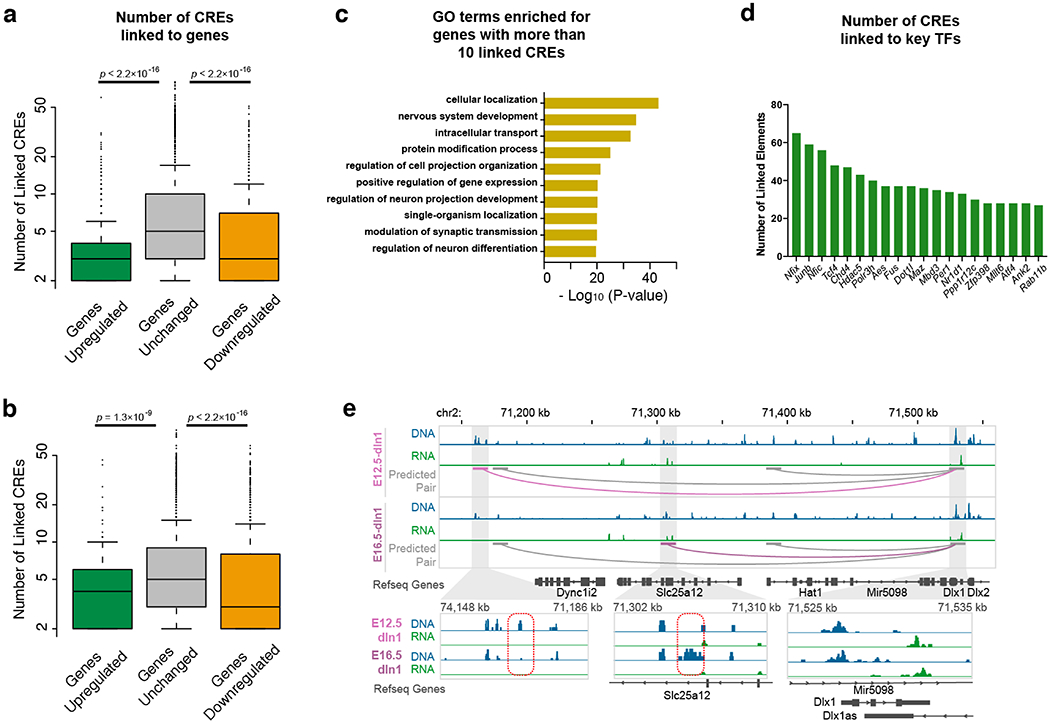
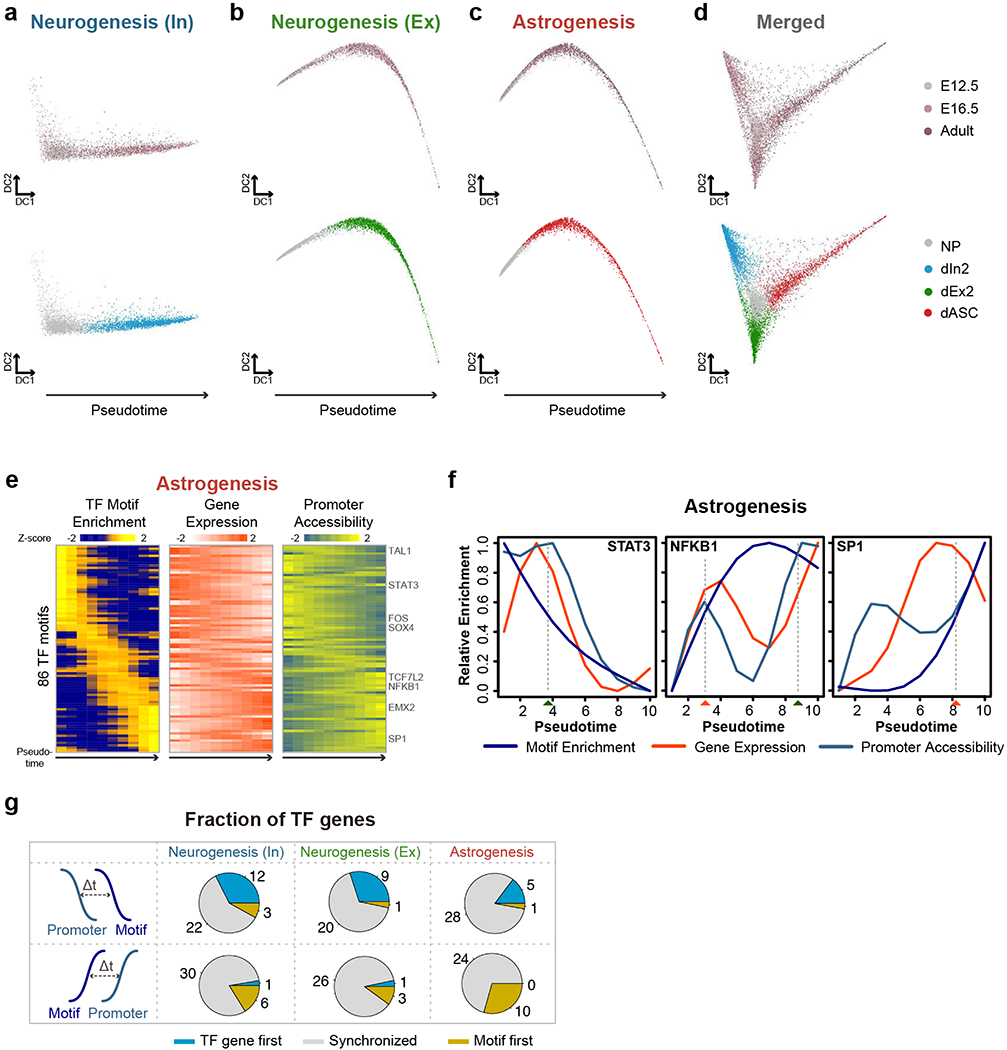
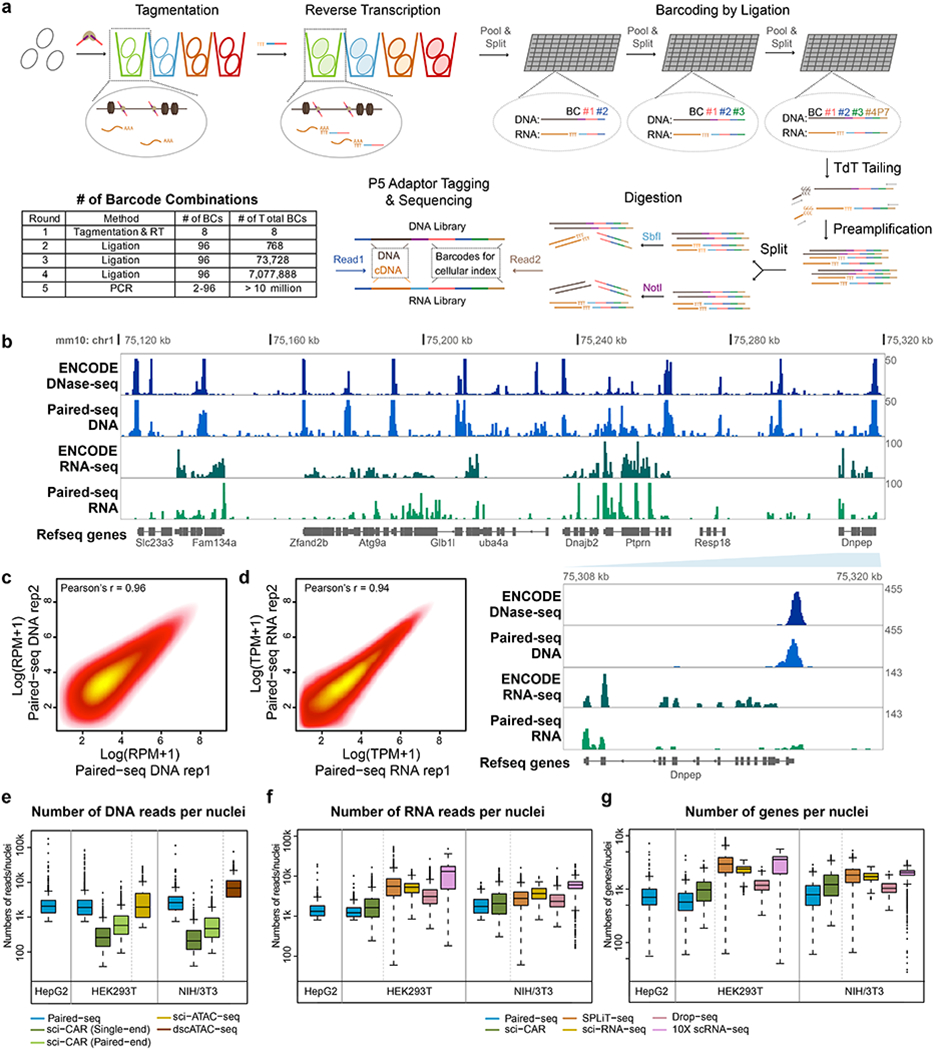
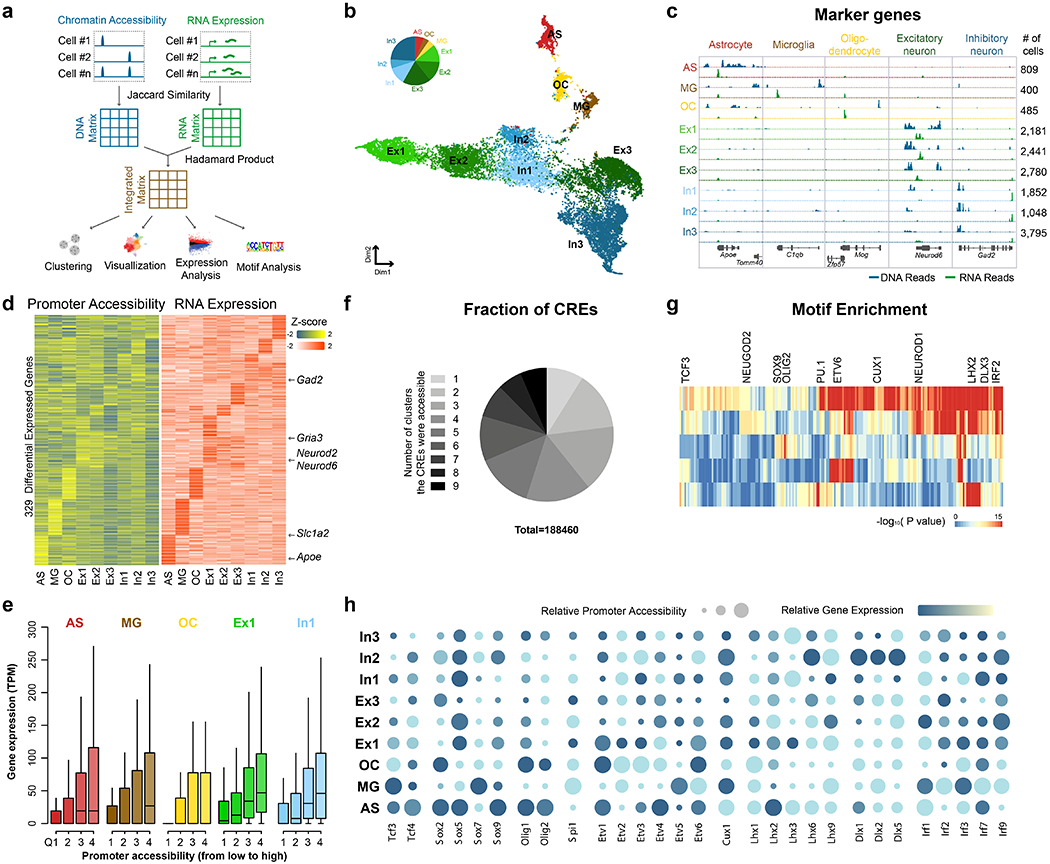
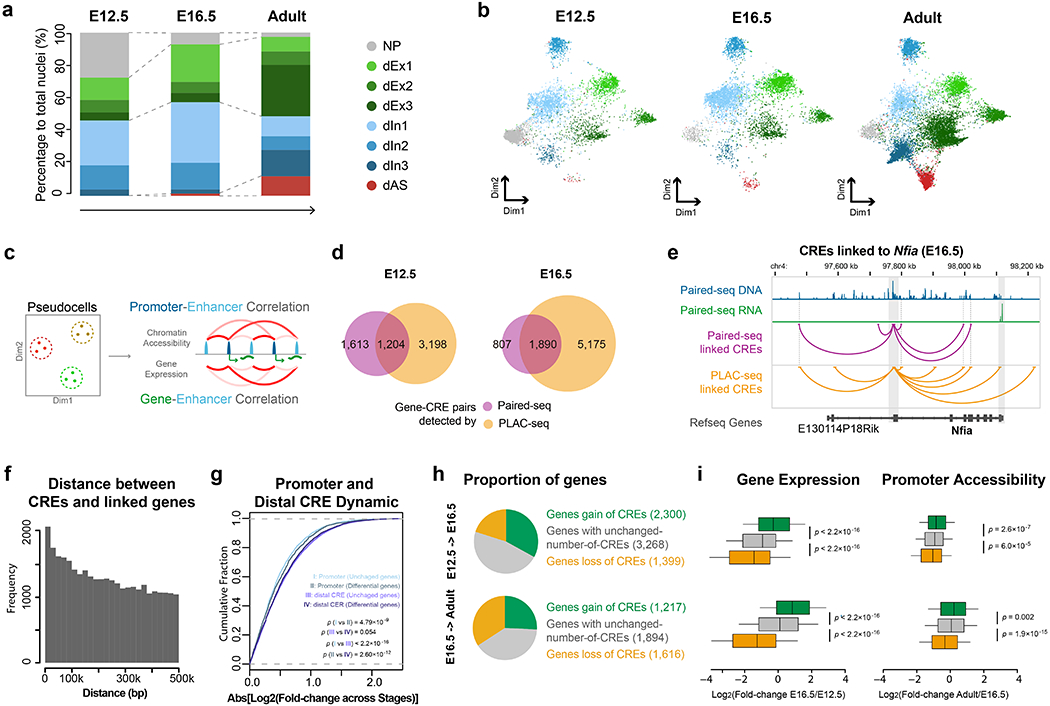
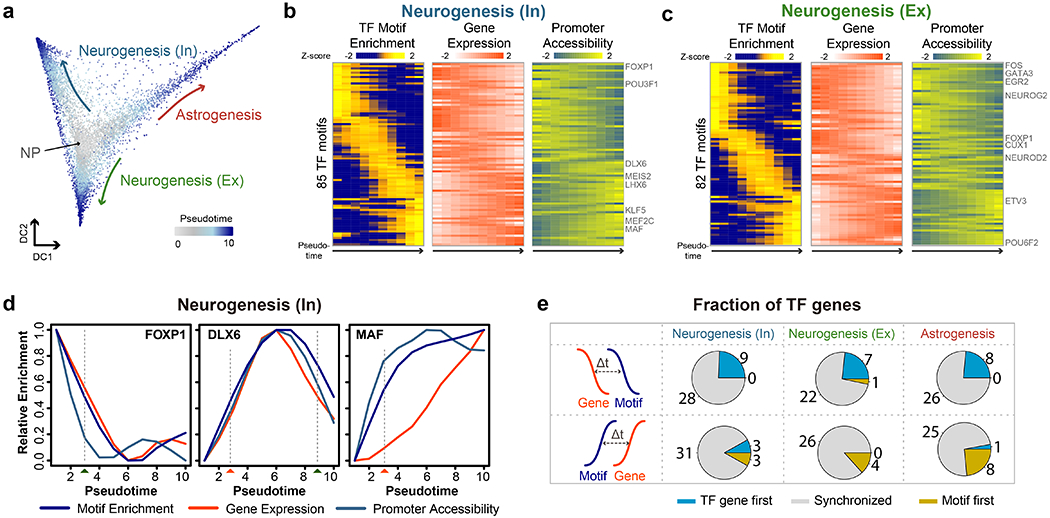
Simultaneous profiling of transcriptome and chromatin accessibility within single cells is a powerful approach to dissect gene regulatory programs in complex tissues. However, current tools are limited by modest throughput. We now describe an ultra high-throughput method, Paired-seq, for parallel analysis of transcriptome and accessible chromatin in millions of single cells. We demonstrate the utility of Paired-seq for analyzing the dynamic and cell-type-specific gene regulatory programs in complex tissues by applying it to mouse adult cerebral cortex and fetal forebrain. The joint profiles of a large number of single cells allowed us to deconvolute the transcriptome and open chromatin landscapes in the major cell types within these brain tissues, infer putative target genes of candidate enhancers, and reconstruct the trajectory of cellular lineages within the developing forebrain.


Conflict of interest statement

Competing interests

The authors declare no competing interests.

Figures

Extended Data Fig. 1.
Extended Data Fig. 1.. Quality control for Paired-seq libraries.
a, Sequence of Paired-seq products illustrating the structure of DNA barcode combinations. b, Paired-seq DNA profiles are enriched around the transcription start sites (TSSs) while (e) RNA profiles are enriched at the transcription termination sites (TTSs) in NIH/3T3 cells. As comparison, DNA and RNA profiles from sci-CAR were also plotted. c, Proportions of DNA and RNA reads in both libraries are shown, n=3 independent experiments. Scatter plots showing the correlation of reads from two replicates of Paired-seq (d) DNA profiles or (e) RNA profiles. Boxplots showing (f) the fraction of reads around TSS (−1000 to +500 bp) and (g) the faction of reads inside known peaks (GSE:49847) of Paired-seq DNA profiles from HEK293T, HepG2 and NIH/3T3 cells. sci-CAR datasets (GSE117089) from the same cell types were also used for comparison. Scatter plot showing the proportion of human and mouse reads in each cell in Paired-seq (h) DNA and (i) RNA profiles. j, Scatter plot showing the proportions of both DNA and RNA reads mapped to genomes in the same single cells. Cells with more than 80% reads mapped to human and mouse genome were colored in red and blue, respectively. UMAP visualization of HepG2 and HEK293T cells based on (k) DNA and (l) RNA reads. Cells were colored by density-based clustering from each profile and cell identities. The clustering results were also projected to each other. In boxplots center lines indicate the median, box limits indicate the first and third quartiles and whiskers indicate 1.5x interquartile range (IQR). The sample sizes are provided in the Source Data with this paper online.
Extended Data Fig. 2.
Extended Data Fig. 2.. Integrative analysis of Paired-seq DNA and RNA profiles from mouse adult cerebral cortex.
a, UMAP visualization of co-clustering of nuclei from two replicates. b, Comparison of DNA-based, RNA-based and integrated clustering results. Cells were colored based on unsupervised clustering from integrated clustering and colored the same as Fig. 2b. c, Promoter accessibility and gene expression of several marker genes in the nine major groups. Relative promoter accessibilities and gene expressions were indicated in the size and the color of circles. d, Expression levels of genes of all clusters are plotted in a boxplot for each quantile of promoter accessibility. e, For each cell cluster, expression levels of genes are plotted in a boxplot for each quantile of promoter accessibility. In boxplots center lines indicate the median, box limits indicate the first and third quartiles and whiskers indicate 1.5x interquartile range (IQR).
Extended Data Fig. 3.
Extended Data Fig. 3.. Co-clustering of Paired-seq datasets from mouse E12.5, E16.5 forebrain and adult cerebral cortex.
a, UMAP visualization of Paired-seq data from two replicates of both mouse E12.5 and E16.5 forebrains showing clustering of cells based on cell types, not replicates. b, UMAP visualization of Paired-seq data of mouse E12.5, E16.5 forebrains and adult cerebral cortex showing clustering of cells based on cell type, not batches. c, Aggregate chromatin accessibility (blue) and gene expression (green) profiles for each cell clusters at several marker gene loci.
Extended Data Fig. 4.
Extended Data Fig. 4.. Paired-seq facilitates the linking of candidate CREs to putative target genes in mouse fetal forebrains.
a, Bar charts show the numbers of gene-CRE links identified in mouse E12.5 and E16.5 forebrain, and adult cerebral cortex datasets. b and c, Barcharts show the fractions of gene-CRE pairs (b) identified by Paired-seq and supported by PLAC-seq or (c) identified by PLAC-seq and supported by Paired-seq. P-value, two-sided Fisher’s exact test. d-o, Number of identified CREs linked to each gene, number of identified genes linked to each CRE, number of CREs between CREs and their linked genes, and number of genes between CREs and their linked genes in (d-g) E12.5, (h-k) E16.5 forebrain and (l-o) adult cerebral cortex.
Extended Data Fig. 5.
Extended Data Fig. 5.. Dynamics of gene-CRE pairing during mouse brain development.
Boxplots showing the number of linked CREs for genes of each group of (a) E12.5 to E16.5 and (b) E16.5 to Adult. P-value, two-sided K-S test. Genes were classified according the number of linked candidate CREs: genes with a gain of CREs (Log2[fold-change] > 3), genes with unchanged number of linked CREs (−1 < Log2[fold-change] < 1) and genes with a loss of linked CREs (Log2[fold-change] < −3). c, DAVID GO analysis of genes with more than 10 linked CREs. d, Top 20 TF genes with the highest number of linked CREs. e, The predicted gene-CRE pair for Dlx1 gene in dIn2 cluster. The common links shared by two stages of development were shown in grey and the stage-specific links were shown in light- and dark-violet red. In the close-up view, the positions of stage-specific CREs were indicated by red dashed box. In boxplots center lines indicate the median, box limits indicate the first and third quartiles and whiskers indicate 1.5x interquartile range (IQR).
Extended Data Fig. 6.
Extended Data Fig. 6.. Analysis of cellular trajectory of developing mouse forebrain.
a-c, Diffusion map showing the single-cell trajectories of neurogenesis towards (a) GABAergic neurons, (b) glutamatergic neurons and (c) astrogenesis. d, The combined diffusion map corresponding to Fig. 4a was also shown. The cells were colored by stages and clusters, respectively. e, Heatmap shows the ordering of the chromVAR TF motif enrichments across astrogenesis. The relative expression and promoter accessibility of corresponding TF genes were also shown. f, Line plots showing the relative enrichment of TF motifs, gene expression and promoter accessibility for STAT3, NFKB1 and SP1 according to the diffusion pseudotime for astrogenesis. The estimated time-of-gain and time-of-loss of TF motif were indicated by red and green rectangles below. g, Pie-charts showing the fraction of TFs with the TF gene promoters became accessible before (TF gene first), synchronized with, or after (Motif first) the TF motifs became accessible, for neurogenesis towards GABAergic neurons, glutamatergic neurons and astrogenesis.
Fig. 1 |
Fig. 1 |. Paired-seq enables simultaneous profiling of accessible chromatin and gene expression in millions of single cells.
a, Schematic of Paired-seq workflow. Paired-seq includes five rounds of combinatorial barcoding that enables labeling of millions of cells in one single experiment. In the first round, cells are subject to Tn5 transposition followed by reverse transcription in separate tubes. This is followed by three rounds of ligation-mediated barcoding carried out in 96-well plates using a split and pool strategy. In the final round, DNA barcode tags are first added to genomic DNA and cDNA by TdT-assisted DNA tailing. The resulting DNA is PCR amplified with different primers, and subject to restriction digestion to produce separate libraries for detecting chromatin accessibility and RNA transcripts. b, A representative genome browser view of Paired-seq data from NIH/3T3 cells (Mouse genome assembly mm10). Tracks of DNase-seq and RNA-seq data downloaded from ENCODE data portal are also shown. Proportions of DNA and RNA reads in both libraries are shown. A zoomed-in view of Dnpep gene locus were shown in the bottom right panel, indicated by the light blue wedge. Scatter plots show the correlation of read counts from two technical replicates of Paired-seq DNA profiles (c) or RNA profiles (d). Boxplots show (e) the number of uniquely mapped DNA reads, (f) the number of uniquely RNA mapped reads and (g) the number of genes captured per cell from either HEK293T, HepG2 and NIH/3T3 cells. As comparison, the numbers of reads or genes captured per cell by sci-CAR (GSE117089), sci-ATAC-seq (GSE67446), dscATAC-seq (GSE123581), SPLiT-seq (GSE110823), sci-RNA-seq (GSE98561), Drop-seq (GSE63269) and 10X scRNA-seq (1k_hgmm_v3_nextgem dataset) from the same cell types are also shown. All datasets were sequenced or down-sampled to ~15k raw reads per cell. In boxplots center lines indicate the median, box limits indicate the first and third quartiles and whiskers indicate 1.5x interquartile range (IQR). Source data for panels e-g are available online; sample sizes are provided there.
Fig. 2 |
Fig. 2 |. Paired-seq identified major cell types in the mouse cerebral cortex.
a, Schematic of integrated analysis of Paired-seq DNA and RNA profiles. Pairwise similarity matrices were first constructed from accessible chromatin and expression profiles of the nuclei using the Jaccard similarity index. DNA and RNA matrices are combined into a new matrix by calculating the Hadamard product, which is then processed with SnapATAC to cluster cells and generate both open chromatin and RNA transcript profiles of each cluster. b, Clustering of single nuclei from mouse adult cerebral cortex revealed nine major groups: astrocyte (AS), microglia (MG), oligodendrocyte (OC), Glutamatergic neural cells (Ex1, Ex2 and Ex3) and GABAergic neural cells (In1, In2 and In3). c, Aggregate chromatin accessibility (blue) and gene expression (green) profiles for each cell cluster at several marker gene loci. d, Heatmaps show promoter accessibility and the corresponding gene expression level of differentially expressed genes. e, Expression levels of genes for each cluster are plotted for each quantile of promoter accessibility. In boxplots, center lines indicate the median, box limits indicate the first and third quartiles and whiskers indicate 1.5x interquartile range (IQR). Sample sizes are provided in the Source data available online. f, Pie-chart showing the fractions of CREs accessible in different number of clusters. g, Transcription factor motif enrichment analysis for each major group. h, Promoter accessibility and gene expression of representative TF genes. Relative promoter accessibilities and expression levels of each TF gene are indicated by the size and color of circles. Source data for panels b, e and f are available online.
Fig. 3 |
Fig. 3 |. Paired-seq links candidate cis-regulatory elements to their putative target genes.
Clustering of single nuclei from mouse E12.5 and E16.5 forebrain samples revealed eight distinct major groups: neuronal progenitors (NP), glutamatergic neural cells (dEx1, dEx2, dEx3), GABAergic neural cells (dIn1, dIn2 and dIn3), and astrocytes (dAS) according to the maker genes (Extended Data Fig. 3c.) a, Stacked bar charts showing the percentages of different cell clusters identified from E12.5 forebrain, E16.5 forebrain and adult cerebral cortex. b, UMAP plot shows the different representation of cell clusters from E12.5 forebrain, E16.5 forebrain and adult cerebral cortex. c, Schematics for identifying potential gene-CRE pairs. d, Venn-diagram showing the fraction of gene-CRE pairs identified from Paired-seq and H3K4me3 PLAC-seq data from mouse E12.5 and E16.5 forebrains. e, Genome browser view of the Nfia locus. Gene-CRE pairs identified by Paired-seq and PLAC-seq data from E16.5 mouse forebrain samples are shown in purple and yellow, respectively. Promoter region and 3’UTR of Nfia gene are highlighted in grey. f, Histogram of the genomic distances between the candidate CREs and their linked genes. g, Cumulative distribution function plot of promoter and CRE dynamics. Genes were grouped into unchanged genes and differentially expressed genes according to the fold-change of the expression level between E12.5 and E16.5 (Log2[Fold-change]>2). The x-axis is the absolute value of fold-change of promoter or CRE accessibility between the two stages. P-value, two sided K-S test, nI and III = 22,923 unchanged genes and nII and IV = 1,776 differentially expressed genes. h, Pie-charts showing genes classified according to changes of candidate CREs linked to them: genes with a gain of linked candidate CREs between stages (Log2[fold-change] > 3), genes with unchanged number of CREs (−1 < Log2[fold-change] < 1) and genes with a loss of linked candidate CREs (Log2[fold-change] < −3). i, Boxplots showing the fold-change of expression and promoter accessibility of genes in the 3 groups. P-value, two-sided K-S test. In boxplots center lines indicate the median, box limits indicate the first and third quartiles and whiskers indicate 1.5x interquartile range (IQR). The sample size of each group is provided in h. Source data for panels a and b are available online.
Fig.4 |
Fig.4 |. Analysis of cellular trajectory in the developing mouse forebrain.
a, Diffusion map showing the trajectories of astrogenesis and neurogenesis. b, c, Heatmaps show the ordering of the chromvAR TF motif enrichments during neurogenesis towards (b) GABAergic neurons and (c) glutamatergic neurons. The relative expression and promoter accessibility of corresponding TF genes are also shown. d, Line plots showing the relative enrichment of TF motifs, gene expression and promoter accessibility for FOXP1, DLX6 and MAF according to the diffusion pesudotime for neurogenesis of GABAergic neurons. The estimated time-of-gain and time-of-loss of TF motif enrichment in open chromatin are indicated by red and green rectangles below. e, Pie-charts of the fraction of TFs showing upregulation of TF genes before (TF gene first), synchronized with, or after (Motif first) the detection of TF motif enrichment in accessible chromatin during neurogenesis towards GABAergic neurons, glutamatergic neurons and astrogenesis. Source data for panels b-d are available online.

References

    1. de Laat W & Duboule D Topology of mammalian developmental enhancers and their regulatory landscapes. Nature 502, 499–506 (2013). - PubMed
    1. Johnson DS, Mortazavi A, Myers RM & Wold B Genome-wide mapping of in vivo protein-DNA interactions. Science 316, 1497–1502 (2007). - PubMed
    1. Crawford GE et al. Genome-wide mapping of DNase hypersensitive sites using massively parallel signature sequencing (MPSS). Genome Res 16, 123–131 (2006). - PMC - PubMed
    1. Buenrostro JD, Giresi PG, Zaba LC, Chang HY & Greenleaf WJ. Transposition of native chromatin for fast and sensitive epigenomic profiling of open chromatin, DNA-binding proteins and nucleosome position. Nat Methods 10, 1213–1218 (2013). - PMC - PubMed
    1. Yue F et al. A comparative encyclopedia of DNA elements in the mouse genome. Nature 515, 355–364 (2014). - PMC - PubMed

Publication types